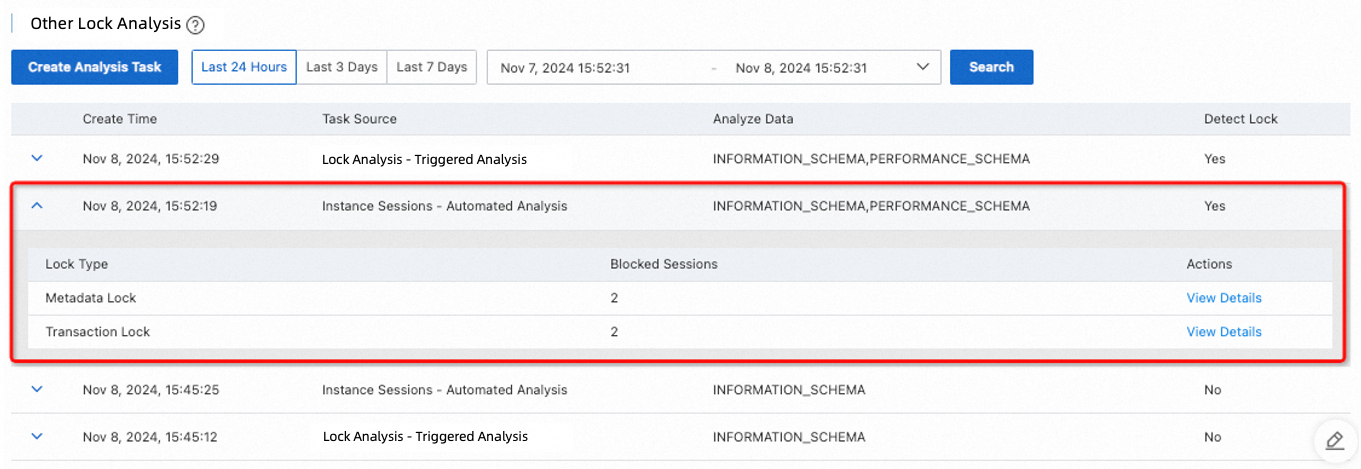
This topic describes how to use the lock analysis feature of Database Autonomy Service (DAS) to analyze metadata lock waits and transaction blocking.
The data in the figures is for demonstration purposes only. In practice, parameters such as thread IDs and SQL statements will differ based on your actual database environment.
Prerequisites
The destination database instance runs one of the following database engines:
RDS for MySQL
PolarDB for MySQL
The destination database instance is connected to DAS, and the connection status is Normal Access. For more information, see Connect a database instance to DAS.
Alibaba Cloud Managed Services (formerly known as Economy Edition) for DAS is enabled.
ImportantAlibaba Cloud Managed Services (formerly known as Economy Edition) for DAS is available only in specific regions. For more information, see Supported databases and regions by edition.
To enable Alibaba Cloud Managed Services (formerly known as Economy Edition) for DAS, see Manage Alibaba Cloud Managed Services (formerly known as Economy Edition) for DAS.
Lock types
Metadata lock analysis
Analytical data: DAS determines the lock wait relationship and generates a relationship graph based on data from tables such as
information_schema.processlist.
Transaction blocking analysis
ImportantThe transaction blocking analysis feature is not supported for PolarDB for MySQL 5.6 instances.
Analytical data: DAS analyzes the transaction blocking relationship and generates a relationship graph based on data from
information_schema.processlist,information_schema.innodb_trx, and the following tables.RDS for MySQL 5.6 and 5.7:
information_schema.innodb_lock_waitsPolarDB for MySQL 5.7:
information_schema.innodb_lock_waitsRDS for MySQL and PolarDB for MySQL 8.0:
performance_schema.data_lock_waits
Parameter settings: For RDS for MySQL 8.0 and PolarDB for MySQL 8.0 instances, enable the
performance_schemaparameter. To modify the parameters of a database instance:For RDS for MySQL, see Set instance parameters.
For PolarDB for MySQL, see Set cluster and node parameters.
Trigger methods
Triggered analysis in Lock Analysis: On the Lock Analysis page, you can manually trigger other lock analysis.
Automated analysis in Instance Sessions: When you refresh the Instance Sessions page, other lock analysis is automatically triggered.
Triggered analysis in Lock Analysis
Create an analysis
Log on to the DAS console.
In the navigation pane on the left, click Intelligent O&M Center > Instance Monitoring.
Find the target instance, click the instance ID, and then go to the instance details page.
In the navigation pane on the left, click Lock Analysis. In the Other Lock Analysis section of the Lock Analysis page, click Create Analysis Task.

View details
Click the ![]() icon for a diagnostic result to view information about metadata lock waits and transaction blocking.
icon for a diagnostic result to view information about metadata lock waits and transaction blocking.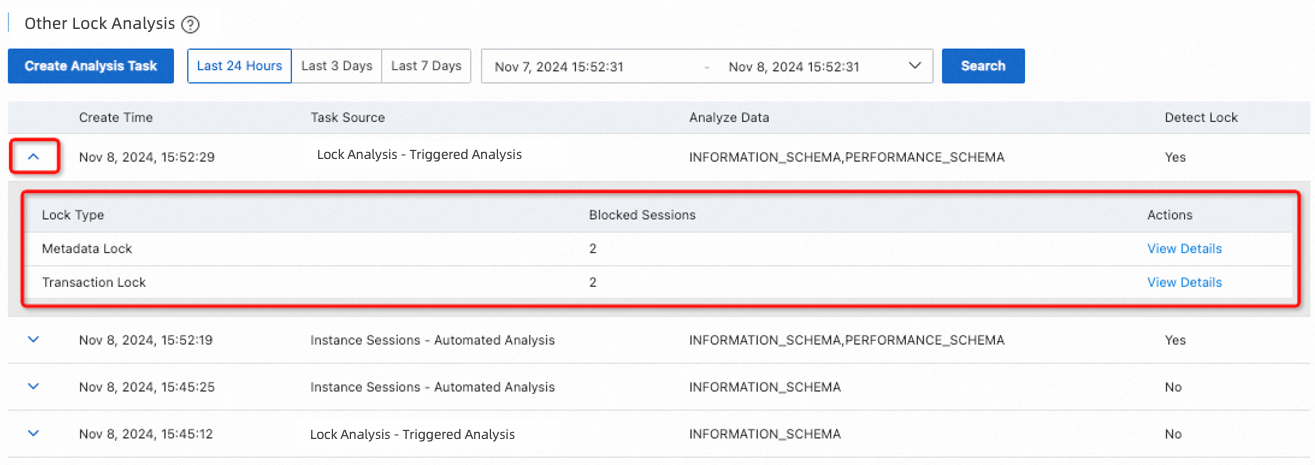
Transaction lock details
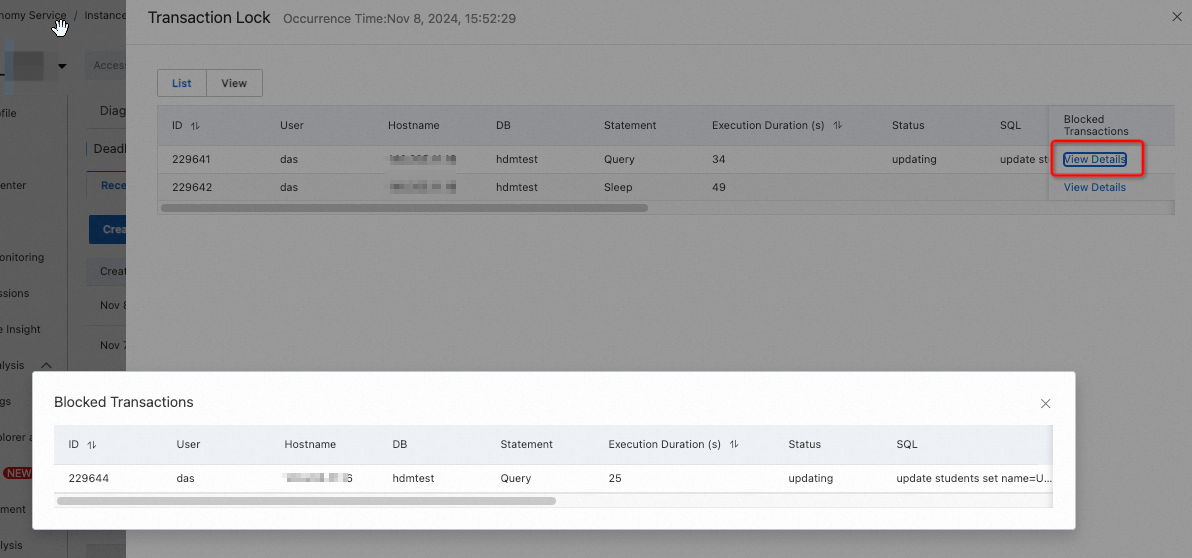
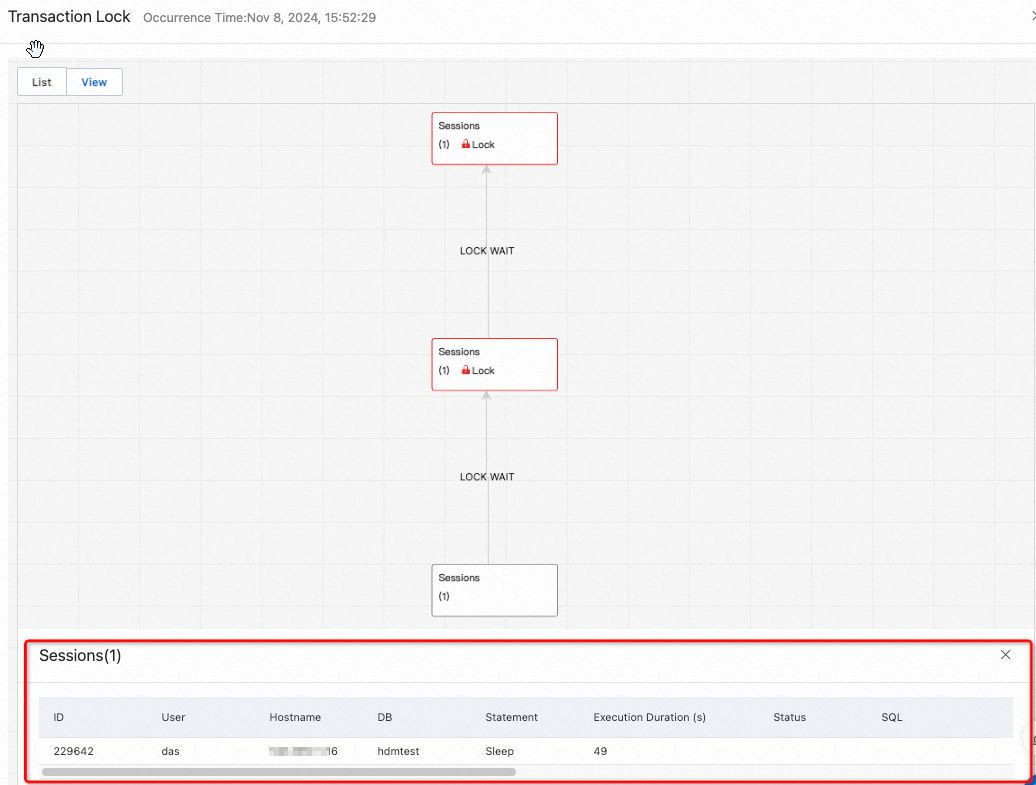
In the transaction lock list, click View Details in the Actions column. The details of the transaction lock are displayed in the following two modes:
List: Displays the details of blocked transactions in a list.
View: Displays the lock details in a visual transaction wait relationship graph. Click a session tile to view the details of the session at the bottom.
Metadata lock details
In the metadata lock list, click View Details in the Actions column. In the view, you can click a session tile to view the session details at the bottom. You can also kill related sessions.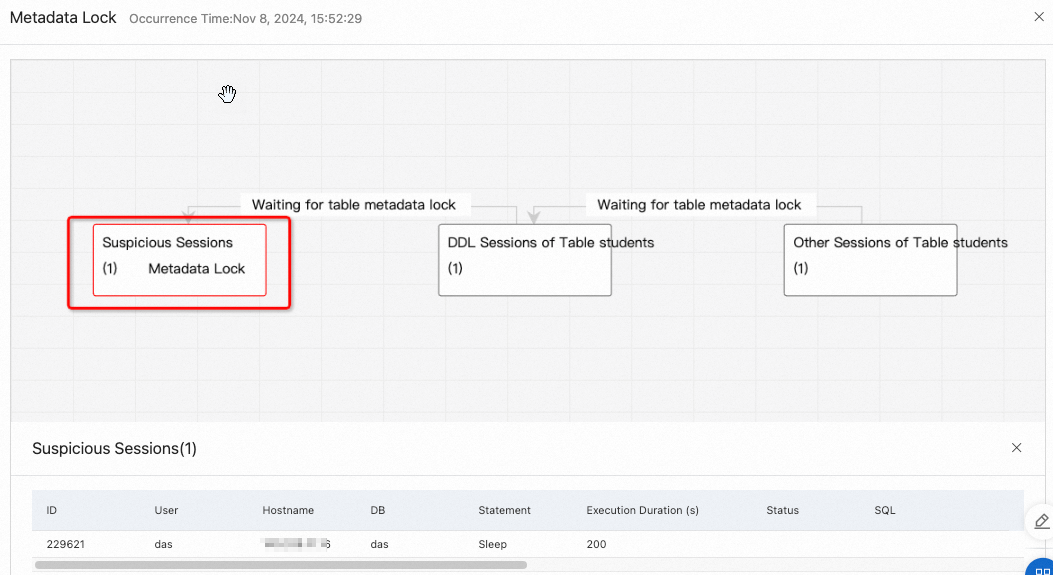
Combined analysis with SQL Explorer and Audit
If a suspicious session is in the Sleep state and no SQL information is available, the session may have an open transaction for which the SQL statements were executed, but the transaction was not committed or rolled back. In this case, in the navigation pane on the left of the destination instance, click SQL Explorer and Audit. On the Audit page, click Enable Advanced Query and enter the thread ID of the suspicious session to query and analyze the SQL statements that were executed. This helps you determine if a lock wait is occurring because the transaction was not committed.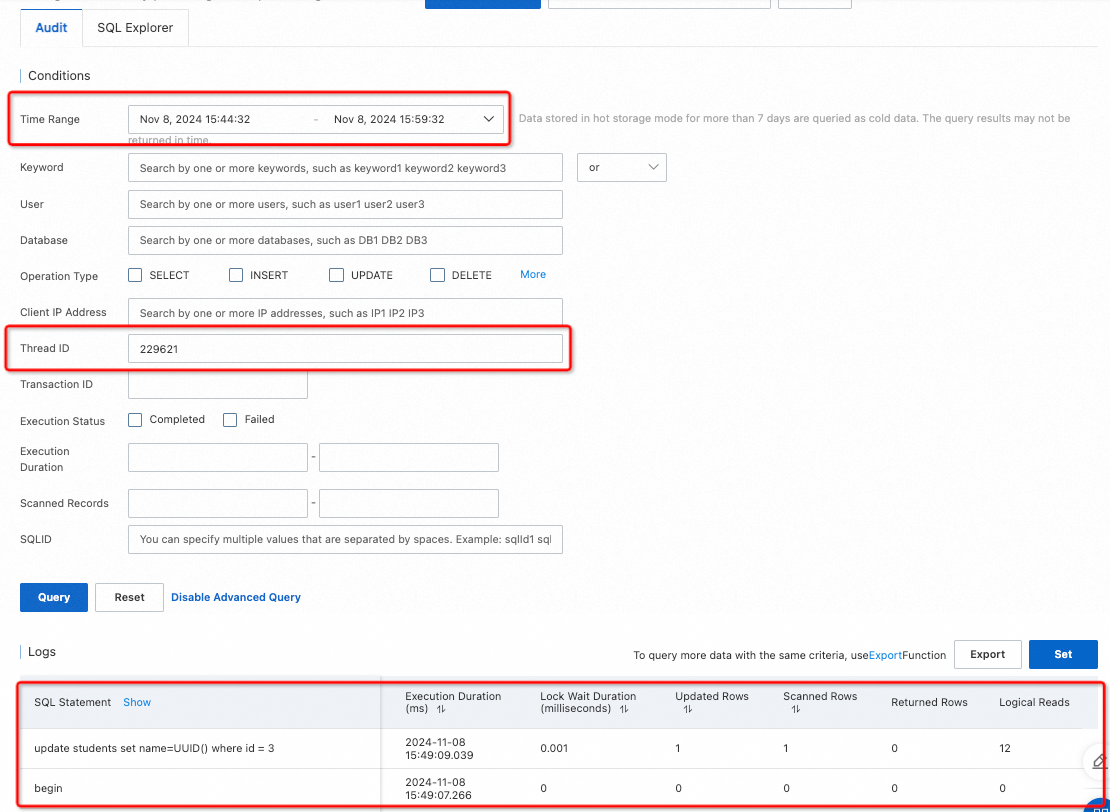
Automated analysis in Instance Sessions
Procedure
Log on to the DAS console.
In the navigation pane on the left, click Intelligent O&M Center > Instance Monitoring.
Find the target instance, click the instance ID, and then go to the instance details page.
In the navigation pane on the left, click Instance Sessions. On the Session Manager page, other lock analysis is automatically triggered, and the analysis results are displayed in the upper-right corner of the page.
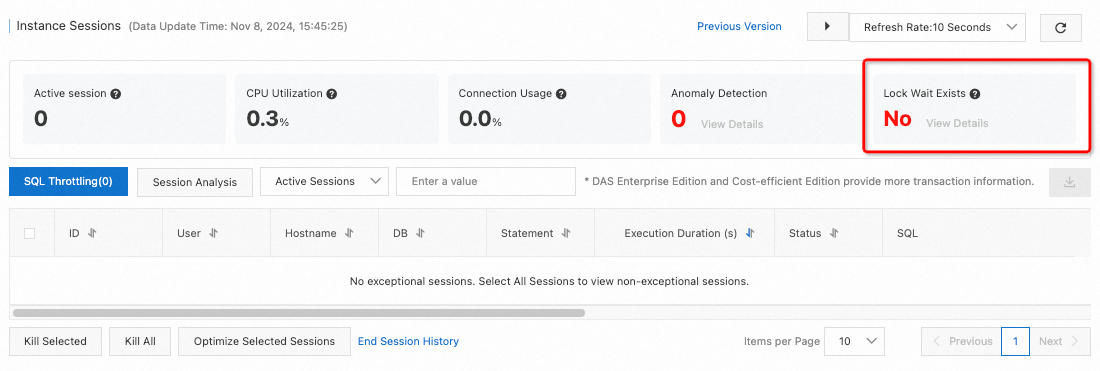
View details on the Instance Sessions page
On the Instance Sessions page, if a lock wait exists, click View Details. In the panel that appears, you can view transaction locks (if any) and metadata locks (if any).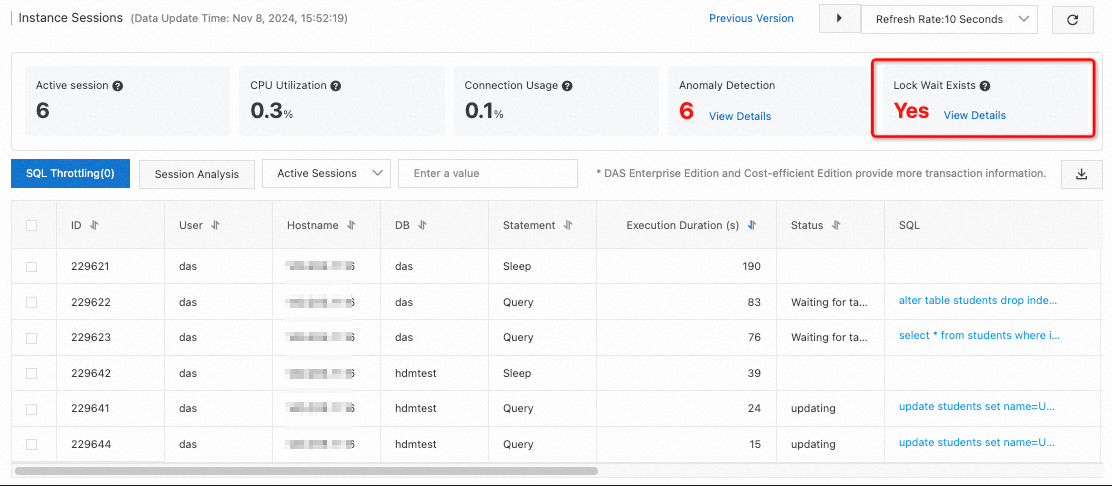
Transaction lock details
In the transaction lock list, click View Details in the Actions column. You can view the transaction lock details in List or View mode. These modes are the same as those used for triggered analysis. For more information, see Transaction lock details in triggered analysis.

Metadata lock details
In the metadata lock list, click View Details in the Actions column. You can view the metadata lock details in a view. This view is the same as the one used for triggered analysis. For more information, see Metadata lock details in triggered analysis.

View details on the Lock Analysis page
On the Lock Analysis page, click the ![]() icon for a diagnostic result to view the historical statistics of other lock analyses that were automatically triggered on the Instance Sessions page. The viewing method is the same as that for triggered analysis. For more information, see View details in triggered analysis.
icon for a diagnostic result to view the historical statistics of other lock analyses that were automatically triggered on the Instance Sessions page. The viewing method is the same as that for triggered analysis. For more information, see View details in triggered analysis.