This topic describes how to use the lock analysis feature of Database Autonomy Service (DAS) to analyze database deadlocks. This feature includes recent deadlock analysis and full deadlock analysis.
The data in the figures is for demonstration purposes only. In practice, use your actual data for parameters, such as thread IDs and SQL statements.
Prerequisites
The target database instance runs one of the following database engines:
Recent deadlock analysis:
RDS MySQL
Self-managed MySQL
PolarDB for MySQL
PolarDB-X 2.0
Full deadlock analysis:
RDS MySQL
PolarDB for MySQL
The target database instance is connected to DAS and its connection status is Normal Access. For more information, see Connect a database instance to DAS.
Alibaba Cloud Managed Services (formerly DAS Economy Edition) is enabled.
ImportantAlibaba Cloud Managed Services (formerly DAS Economy Edition) is available only in some regions. For more information, see Supported databases and regions by edition.
To enable Alibaba Cloud Managed Services (formerly DAS Economy Edition), see Manage Alibaba Cloud Managed Services (formerly DAS Economy Edition).
Recent deadlock analysis
Enable the
innodb_deadlock_detectparameter for the instance.NoteThis parameter is usually enabled by default. You can run the
SHOW VARIABLES LIKE 'innodb_deadlock_detect'statement to confirm. Note that you cannot change the value of this parameter for some types of instances.To modify the parameters of a database instance:
For RDS MySQL, see Set instance parameters.
For PolarDB for MySQL, see Set cluster and node parameters.
DAS analyzes the most recent deadlock log from the output of the
SHOW ENGINE INNODB STATUSstatement.
If multiple deadlocks occur, DAS analyzes only the most recent one when you trigger an analysis. The analysis results are then saved.
Procedure
Log on to the DAS console.
In the navigation pane on the left, click Intelligent O&M Center > Instance Monitoring.
Find the target instance, click the instance ID, and then go to the instance details page.
In the navigation pane on the left, click Lock Analysis. On the Lock Analysis page, click the Recent Deadlock Analysis tab.
Click Create Analysis Task to start a recent deadlock analysis.
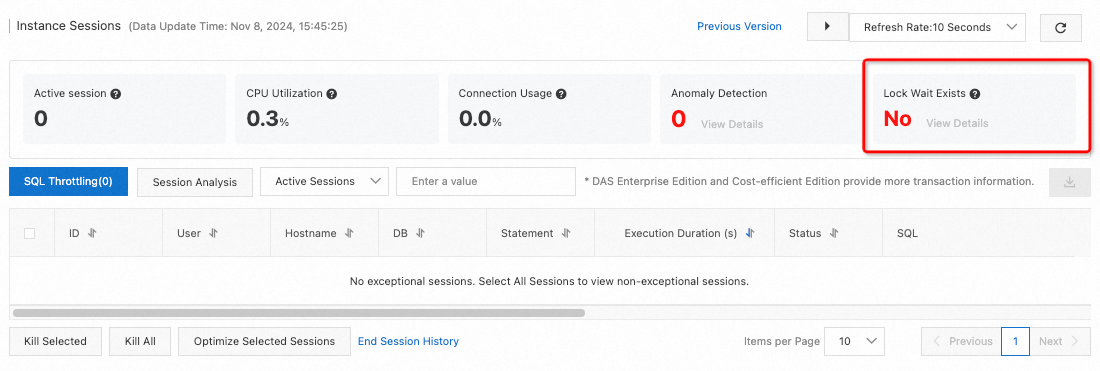
View details
Select a time range to view the results of diagnostic tasks that were triggered during that period.
In the list of diagnostic tasks for recent deadlock analysis, click View Details in the Details column.

A panel appears and shows three ways to view the deadlock details:
View: Displays a visualization of the deadlock relationship. Click a transaction tile to view the details of that transaction below.
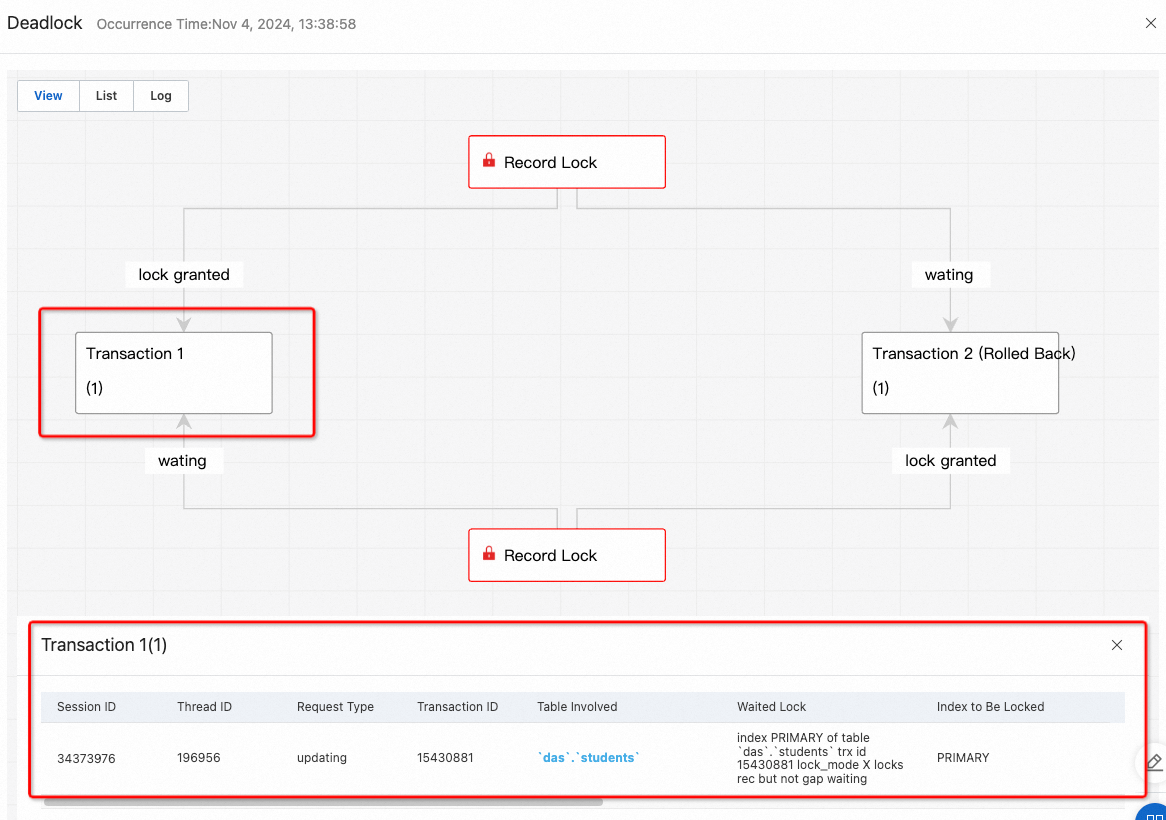
List: Displays a side-by-side comparison of the details of lock-holding transactions.

Log: Displays the original deadlock log (LATEST DETECTED DEADLOCK) from the output of the
SHOW ENGINE INNODB STATUSstatement.
Combined analysis with SQL Explorer and Audit
In the navigation pane on the left of the target instance, click SQL Explorer and Audit. On the Audit page, click Enable Advanced Query.
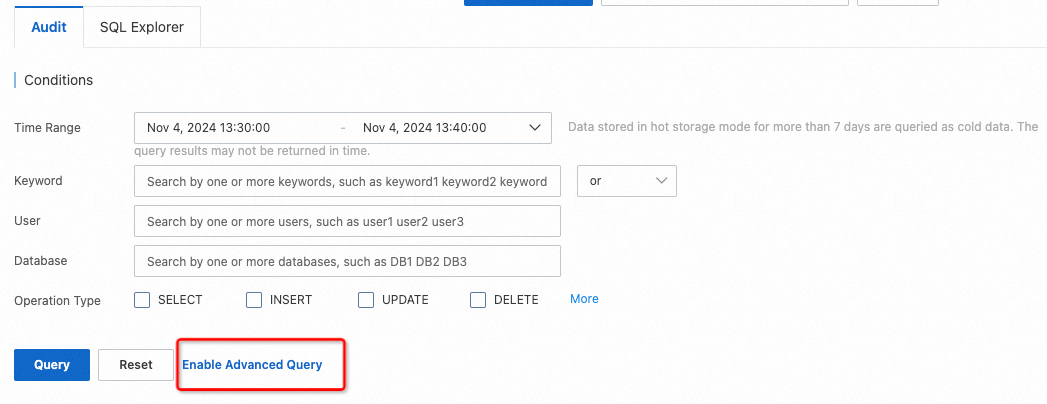
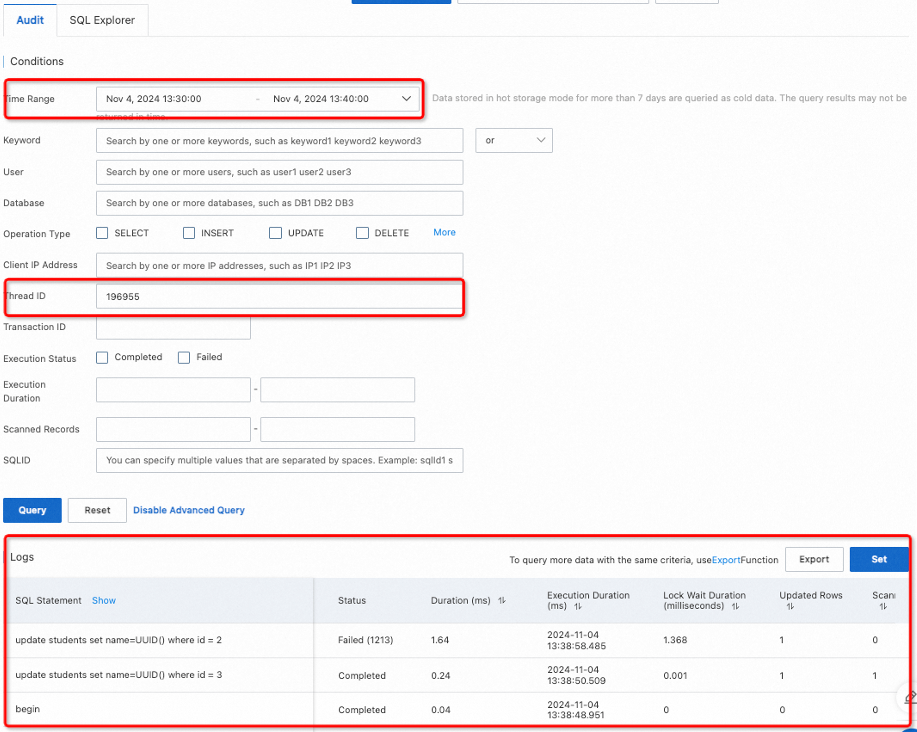
Select a time range that covers the time when the deadlock occurred. Enter the thread ID from the recent deadlock analysis to query the SQL statements that the transaction executed.
Transaction 1 in the preceding example
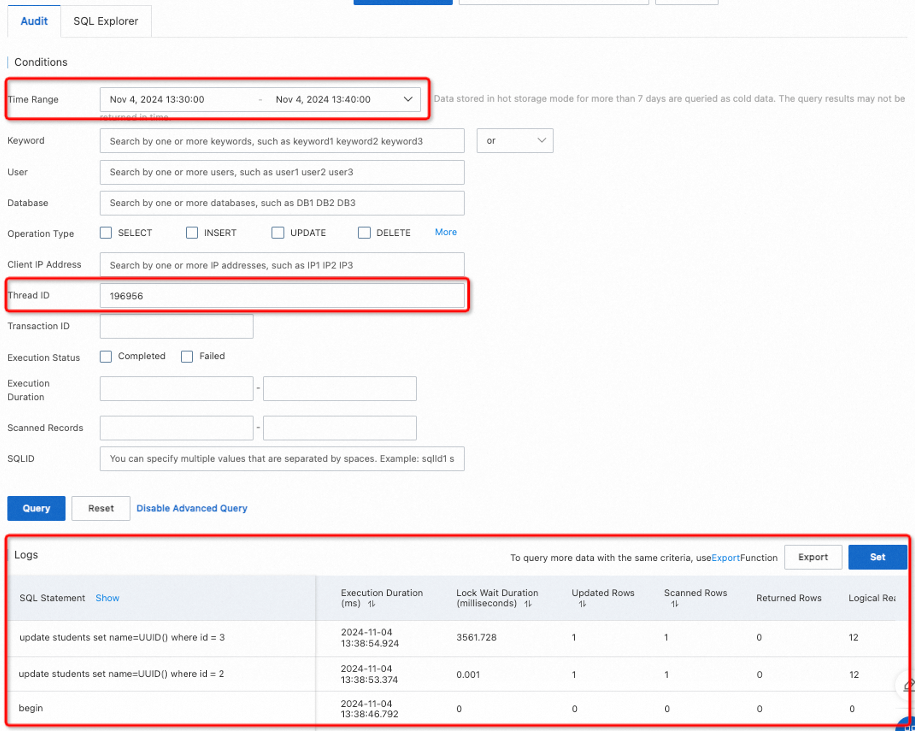
Transaction 2 in the preceding example (rolled back)
Full deadlock analysis
Enable the
innodb_deadlock_detectandinnodb_print_all_deadlocksparameters for the instance. For an RDS MySQL instance, set thelog_error_verbosityparameter to 3.NoteThe
innodb_deadlock_detectparameter is usually enabled by default. You can run theSHOW VARIABLES LIKE 'innodb_deadlock_detect'statement to confirm. Note that you cannot change the value of this parameter for some types of instances.To modify the parameters of a database instance:
For RDS MySQL, see Set instance parameters.
For PolarDB for MySQL, see Set cluster and node parameters.
DAS parses deadlock information from the instance error log every hour to collect statistics on the deadlock count trend and the details of each deadlock.
Cooldown time: If Alibaba Cloud Managed Services (formerly DAS Economy Edition) is enabled for an instance but the required parameters are not enabled, DAS pauses the analysis for a 12-hour cooldown time. If you enable the required parameters during this cooldown time, DAS reschedules the analysis task to run after the cooldown period ends. For example:
An analysis task is scheduled for an instance at 11:12. If DAS detects that a required parameter is disabled, the scheduled task is put on hold and a 12-hour cooldown begins. At 23:12, DAS attempts to run the full deadlock analysis task again. If the parameter is still disabled, another 12-hour cooldown starts. If the parameter was enabled before 23:12, the task runs as scheduled at 23:12 and continues to run every hour until the parameter is disabled or Alibaba Cloud Managed Services (formerly DAS Economy Edition) is turned off for the instance.
Full deadlock analysis does not support deadlocks that contain the description "TOO DEEP OR LONG SEARCH IN THE LOCK TABLE WAITS-FOR GRAPH, WE WILL ROLL BACK FOLLOWING TRANSACTION".
Procedure
Log on to the DAS console.
In the navigation pane on the left, click Intelligent O&M Center > Instance Monitoring.
Find the target instance, click the instance ID, and then go to the instance details page.
In the navigation pane on the left, click Lock Analysis. On the Lock Analysis page, click the Full Deadlock Analysis tab.
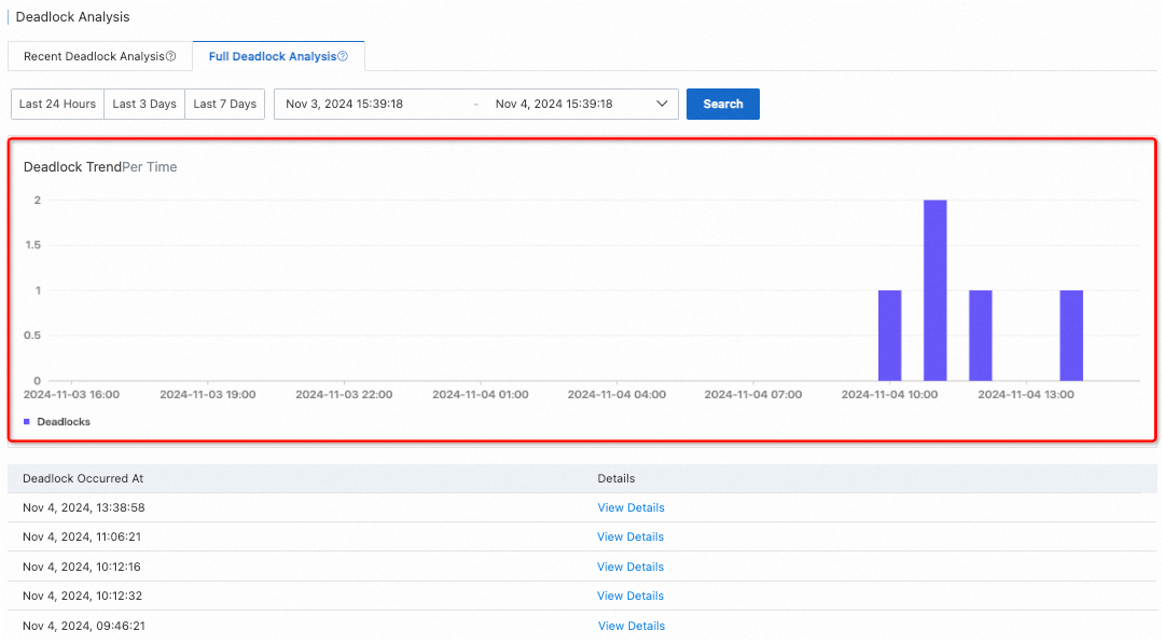
Full deadlock analysis automatically analyzes deadlock logs from the instance error log every hour. This feature collects statistics on the number of deadlocks and plots the Deadlock Trend chart at the top of the page. You can select a time range to view the deadlock trend for that period.
View details
In the deadlock list for full deadlock analysis, click View Details in the Details column.

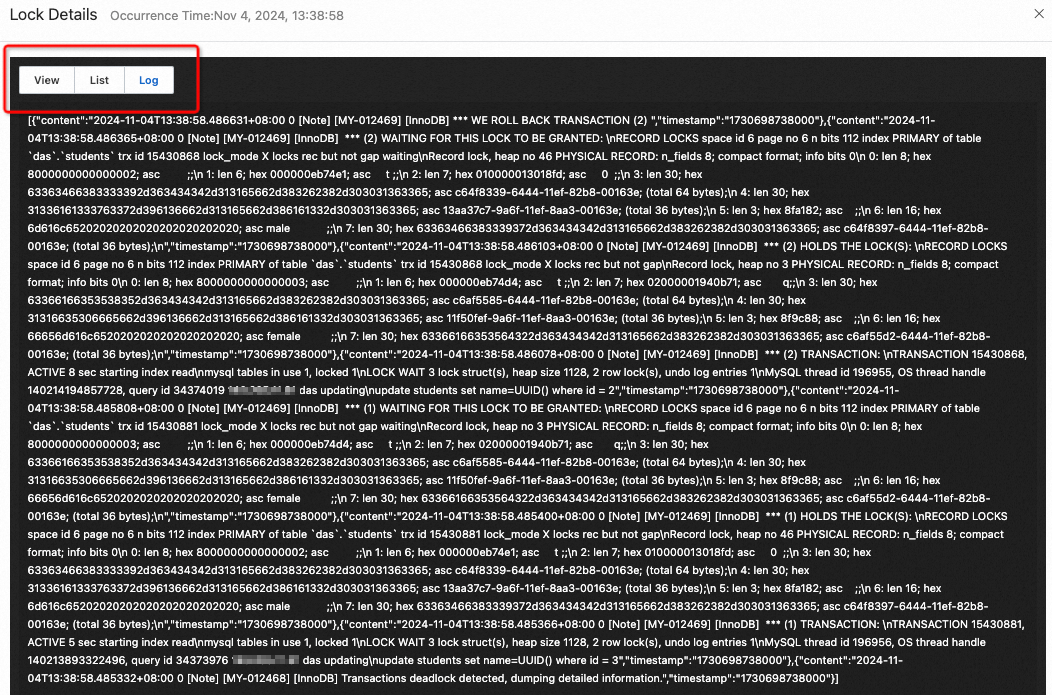
A panel appears with three tabs to view the deadlock details: View, List, and Log. The Log tab contains error logs related to the deadlock. The formats on the View and List tabs are the same as those for recent deadlock analysis. For more information, see View details in Recent deadlock analysis.
Combined analysis with SQL Explorer and Audit
The procedure is the same as that for recent deadlock analysis. For more information, see Combined analysis with SQL Explorer and Audit in Recent deadlock analysis.