The CPU diagnostics feature of Application Real-Time Monitoring Service (ARMS) uses the continuous profiling technology to regularly collect method stack snapshots of executing CPU threads to locate the root cause of high CPU utilization. When the CPU utilization of your system is high, the feature quickly locates the business logic methods that cause high CPU consumption.
If you enable the CPU diagnostics feature, the CPU overhead is increased by about 5%. You must reserve a certain amount of available resources in advance.
Enable the CPU diagnostics feature
Log on to the ARMS console. In the left-side navigation pane, choose .
On the Applications page, select a region in the top navigation bar and click the name of the application that you want to manage.
NoteIf the
 icon is displayed in the Language column, the application is connected to Application Monitoring. If a hyphen (-) is displayed, the application is connected to Managed Service for OpenTelemetry.
 In the left-side navigation pane, click Application Settings. On the page that appears, click the Custom Configuration tab.
In the Continuous profiling section, turn on Main switch and CPU hotspot, and then configure the IP address of an application instance or the CIDR blocks of multiple instances.
In the lower part of the tab, click Save.
The modification takes effect without the need to restart the application.
Use the continuous profiling technology to view hotspot CPU data
The following example shows a method that consumes CPU resources and is executed for 500 milliseconds.
public class CPUPressure {

    // The request method.
   public void runBusiness() {
        long start = System.currentTimeMillis(), period = 0;
        while (period <= 500L) {
            period = System.currentTimeMillis() - start;
        }
    }
}
Log on to the ARMS console. In the left-side navigation pane, choose .
On the Applications page, select a region in the top navigation bar and click the name of the application that you want to manage.
NoteIf the
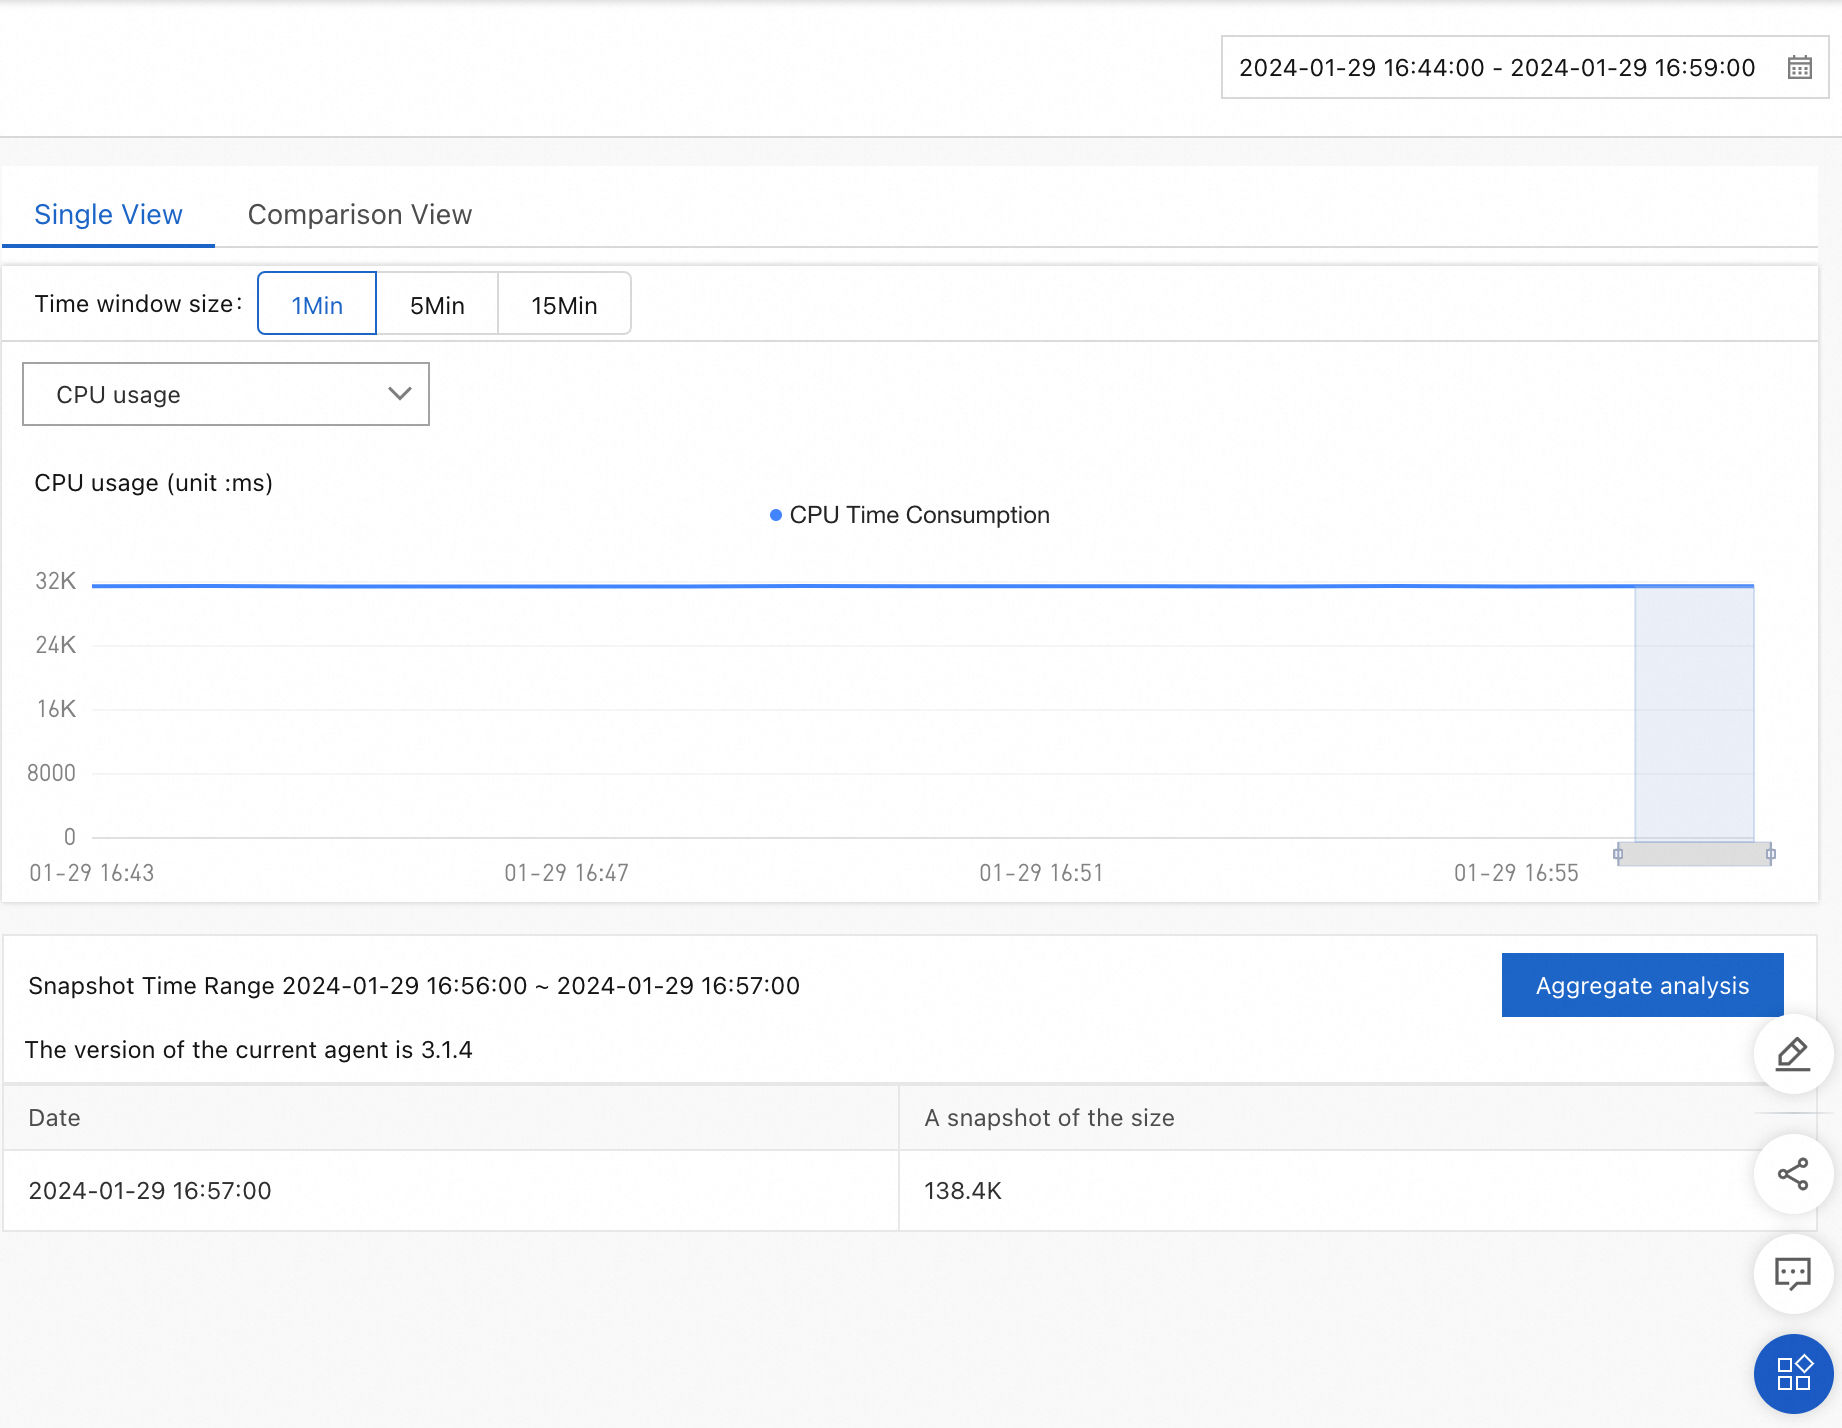
icon is displayed in the Language column, the application is connected to Application Monitoring. If a hyphen (-) is displayed, the application is connected to Managed Service for OpenTelemetry. In the left-side navigation pane, click Continuous profiling. On the Continuous profiling page, select the instance that you want to view and a time period to query.
On the Single View tab, you can query data and view aggregation analysis results.
NoteThe following performance analysis types are available:
CPU Time: the number of CPU cores requested.
Allocated Memory: the size of memory requested.
Allocations: the number of memory requests. Based on the number of memory requests, you can view the methods that frequently request memory.
Click Aggregation & Analysis. On the page that appears, set the Profiling Type parameter to CPU Time.
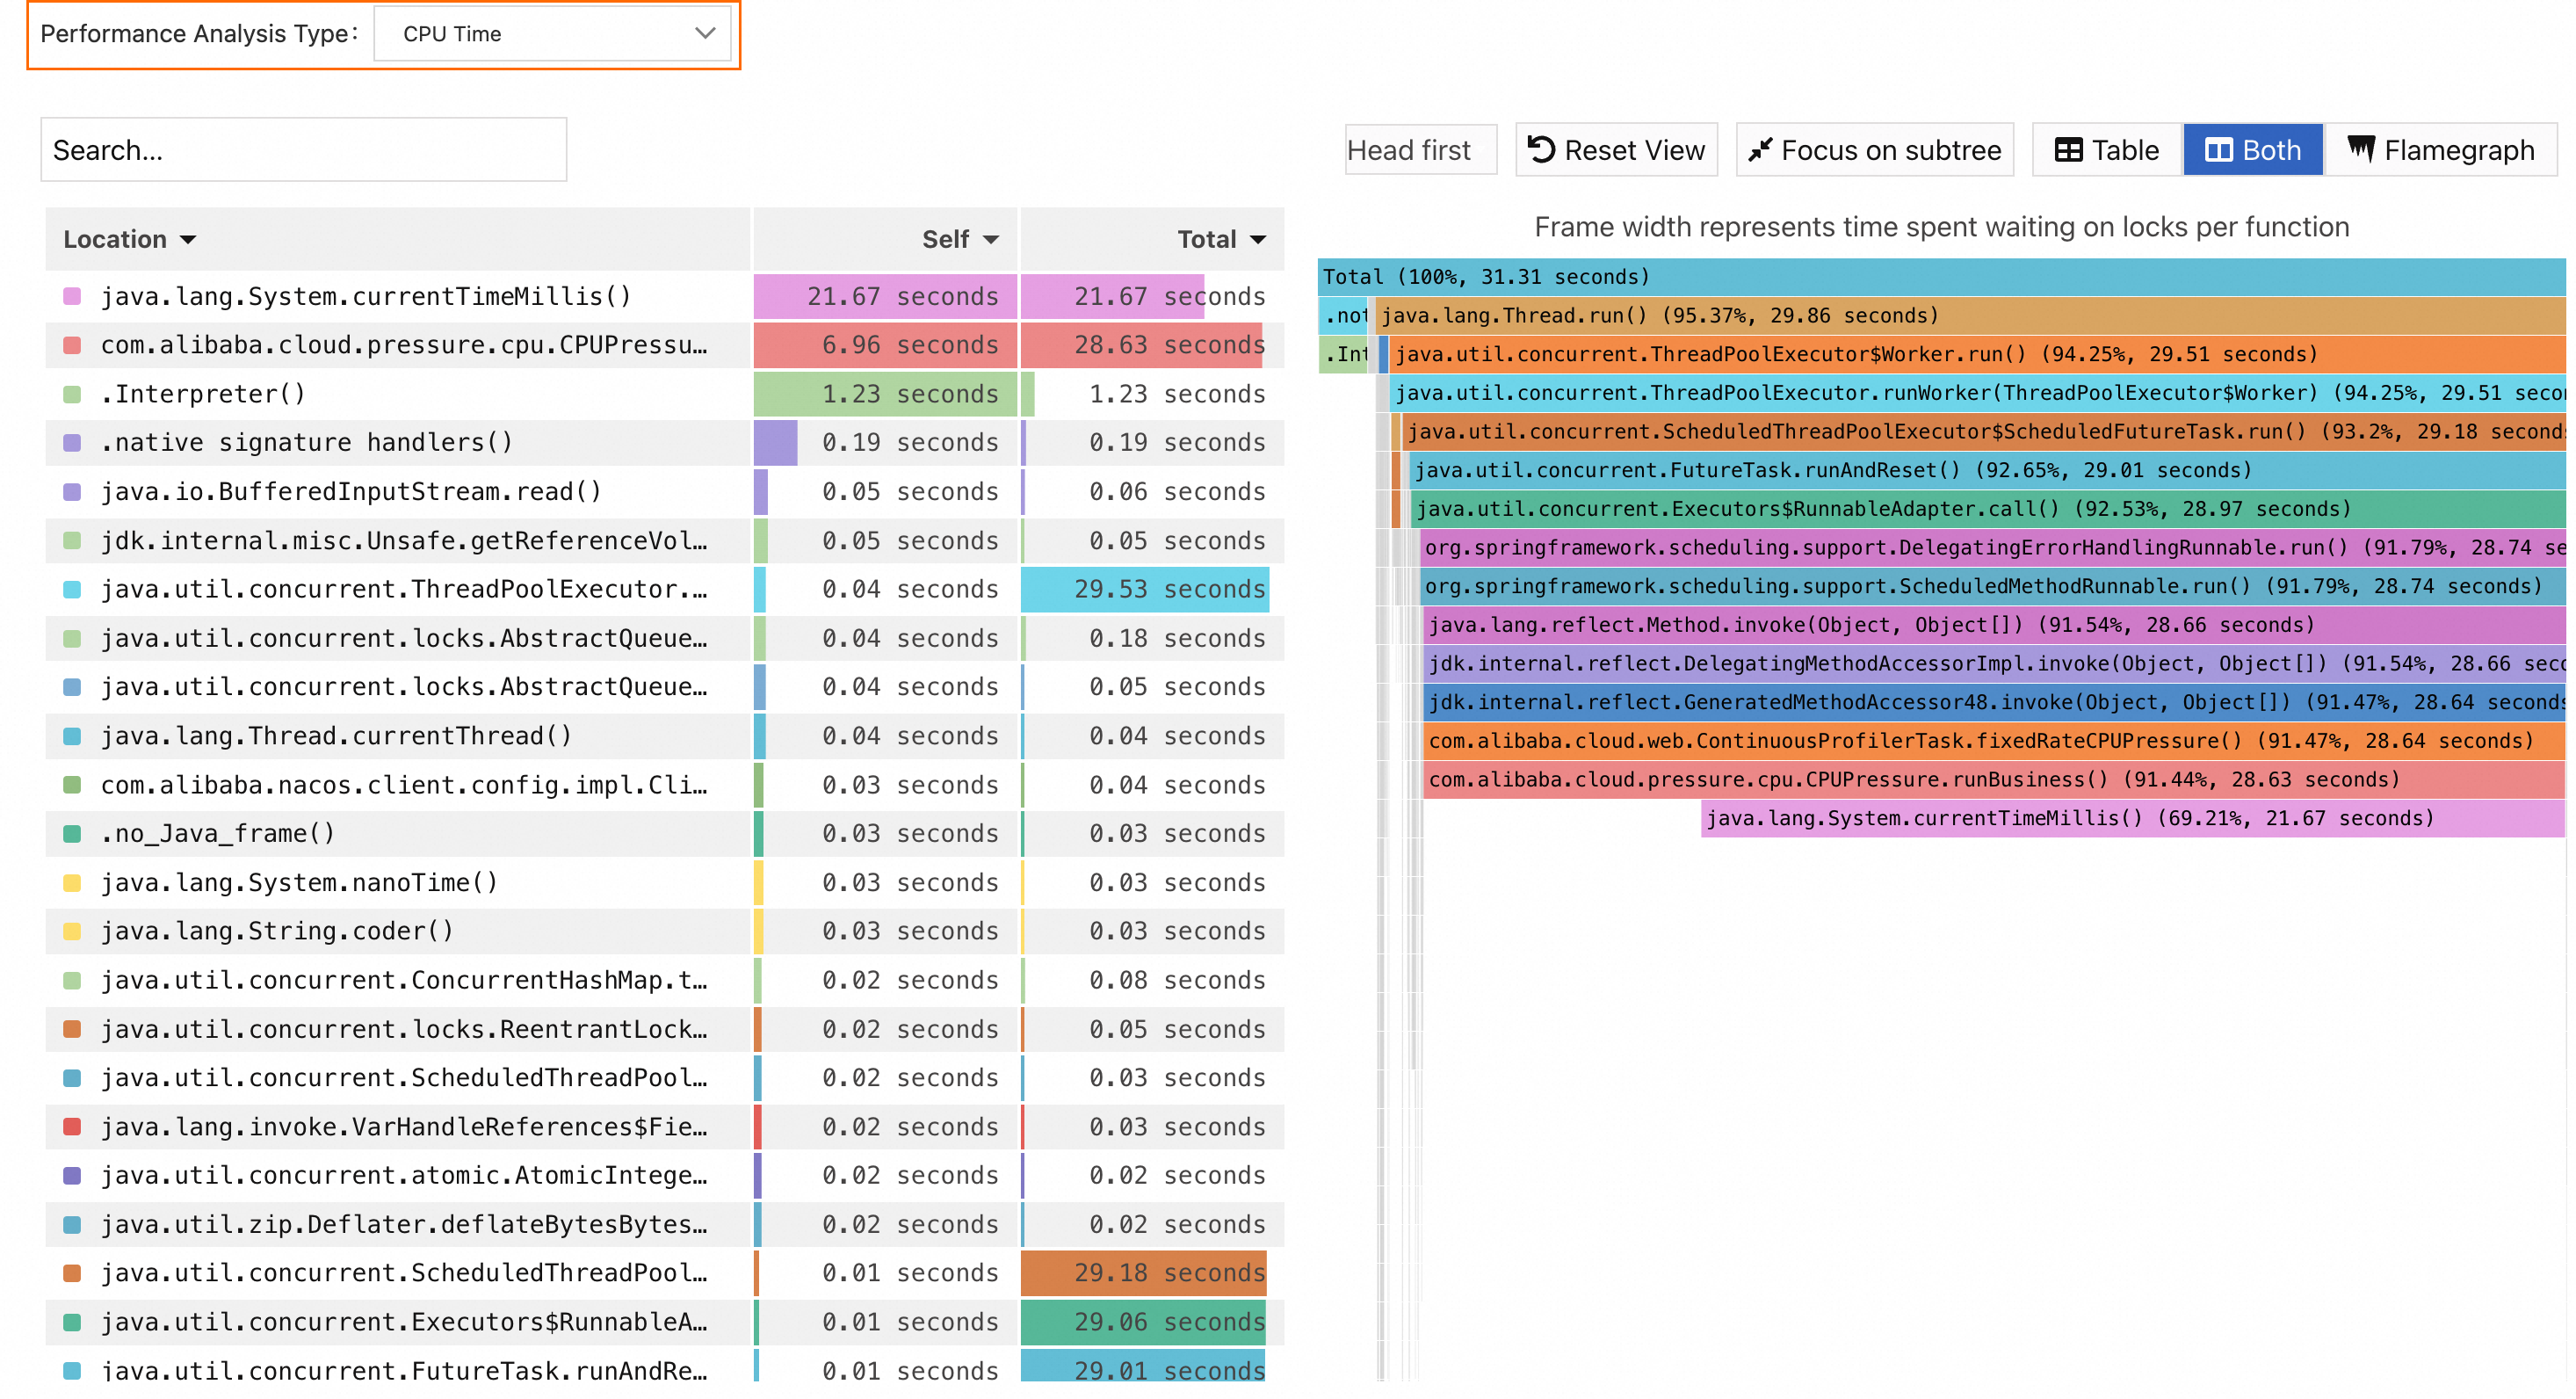
The left side of the figure is a CPU utilization list of all methods involved in the call, and the right side is a flame graph of all method information.
The Self column displays the time or resources that each method consumes within the stack, excluding the time or resources that their child methods consume. The data can be used to identify methods that spend excessive time or resources for their own.
The Total column displays the time or resources consumed for each method itself, including the time or resources consumed for all of its child methods. The data can be used to identify methods that contribute the most time or resources.
Based on the preceding figure, perform the following analysis.
Arrange the values in the Self column in ascending order. Find and click the method java.lang.System.currentTimeMillis() with the largest value. The relevant methods are shown in the flame graph.
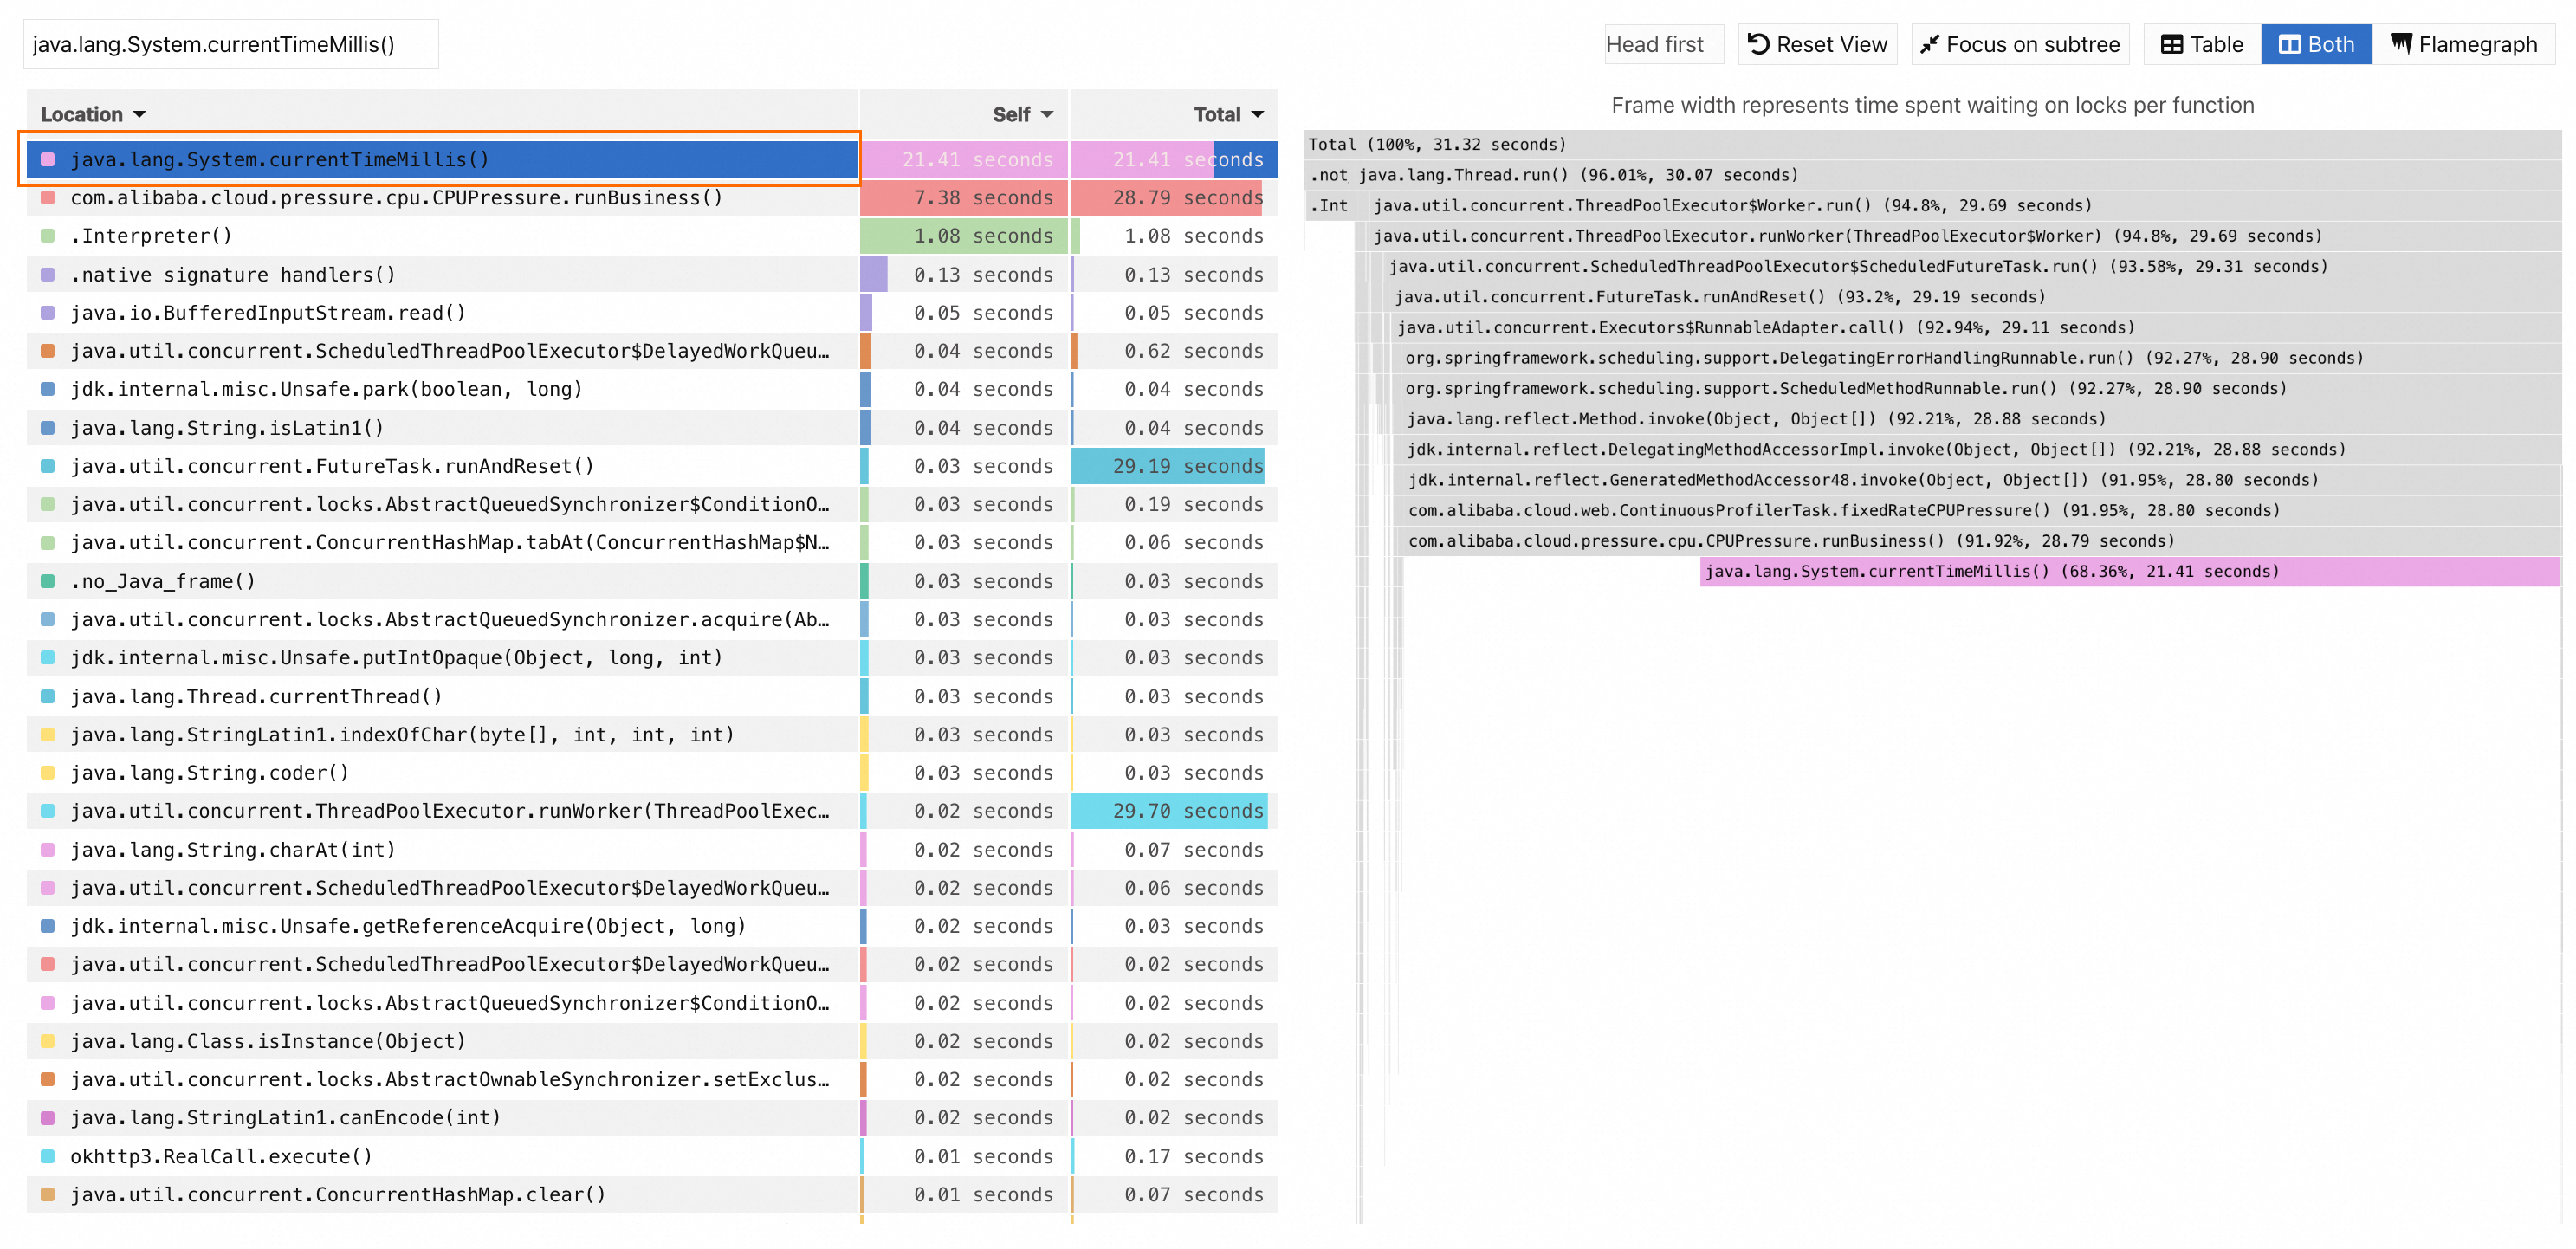
You can find that the java.lang.System.currentTimeMillis() method has the widest box at the stack top of the flame graph.
Because the java.lang.System.currentTimeMillis() method is a library function of Java Development Kit (JDK), you need to search up further, and you can find the java.lang.System.currentTimeMillis() method and its parent method com.alibaba.cloud.pressure.memory.CPUPressure.runBusiness(). As the first service method defined by the application, the com.alibaba.cloud.pressure.memory.CPUPressure.runBusiness() method consumes 28.63 seconds, accounting for 91.44% of the stack. Therefore, a conclusion can be drawn that the com.alibaba.cloud.pressure.memory.CPUPressure.runBusiness() method consumes a large amount of resources in the specified time period. You can use the method to analyze the logic of relevant methods and check whether they can be optimized.
The preceding analysis shows that the com.alibaba.cloud.pressure.memory.CPUPressure.runBusiness() method takes 28.63 seconds in 1 minute, which is logically consistent with the sample scenario.