The code diagnostics feature of Application Real-Time Monitoring Service (ARMS) uses continuous profiling technology to regularly collect method stack snapshots of threads and simulate code execution.
Scenarios
If a promotion encounters slow calls, the code diagnostics feature can quickly locate the faulty code.
If the system encounters many slow calls, the feature can automatically save the faulty code.
If your business is too complex to reproduce occasional slow calls, the feature can simulate code execution and method calls.
If the methods and instrumentation at non-framework layers are missing from traces, the feature helps you restore the time consumed for the methods involving instrumentation.
Prerequisites
The ARMS agent is V3.1.4 or later.
Earlier than V4.2.1: supports only synchronous calls. Asynchronous calls may result in missing data. For example, when Spring Cloud Gateway, Undertow, or Lettuce is used, threads may be asynchronously switched, causing data collection inaccuracies.
V4.2.1 or later: supports both synchronous and asynchronous calls.
The operating system kernel and JDK version meet the requirements. The code diagnostics feature depends on the continuous profiling feature.
Enable the code diagnostics feature
Log on to the ARMS console. In the left-side navigation pane, choose .
On the Application List page, select a region in the top navigation bar and click the name of the application you want to manage.
NoteIcons displayed in the Language column indicate languages in which applications are written.
 : Java application
 : Go application
 : Python application
Hyphen (-): application monitored in Managed Service for OpenTelemetry.
In the left-side navigation pane, click Application Settings. On the page that appears, click the Custom Configuration tab.
In the Continuous profiling section, turn on Main switch and Code hotspot, and then configure the IP address of an application instance or the CIDR blocks of multiple instances.
In the lower part of the tab, click Save.
The modification takes effect without the need to restart the application.
View hotspot code data on the Interface Invocation page
Example: Parse and traverse JSON data and call downstream HTTP interfaces.
public class HotSpotAction extends AbsAction {

  private RestTemplate restTemplate = new RestTemplate();

  // The request method.
  @Override
  public void runBusiness() {
    readFile();
    invokeAPI();
  }

  // Execute an HTTP call.
  private void invokeAPI() {
    String url = "https://httpbin.org/get";
    String response = restTemplate.getForObject(url, String.class);
  }

   // Read and parse the file data.
  private double readFile() {
    InputStreamReader reader = new InputStreamReader(
        ClassLoader.getSystemResourceAsStream("data/xxx.json"));
    LinkedList<Movie> movieList = GSON.fromJson(reader, new TypeToken<LinkedList<Movie>>() {
    }.getType());
    double totalCount = 0;
    for (int i = 0; i < movieList.size(); i++) {
      totalCount += movieList.get(i).rating();
    }
    return totalCount;
  }
}
Log on to the ARMS console. In the left-side navigation pane, choose .
On the Application List page, select a region in the top navigation bar and click the name of the application you want to manage.
NoteIcons displayed in the Language column indicate languages in which applications are written.
 : Java application
 : Go application
 : Python application
Hyphen (-): application monitored in Managed Service for OpenTelemetry.
In the left-side navigation pane, click Interface Invocation. On the page that appears, select an interface and click the Interface Snapshot tab.
On the Interface Snapshot tab, click a trace ID.
Click the Magnifier icon in the Details column and then click the Code Hotspot tab.

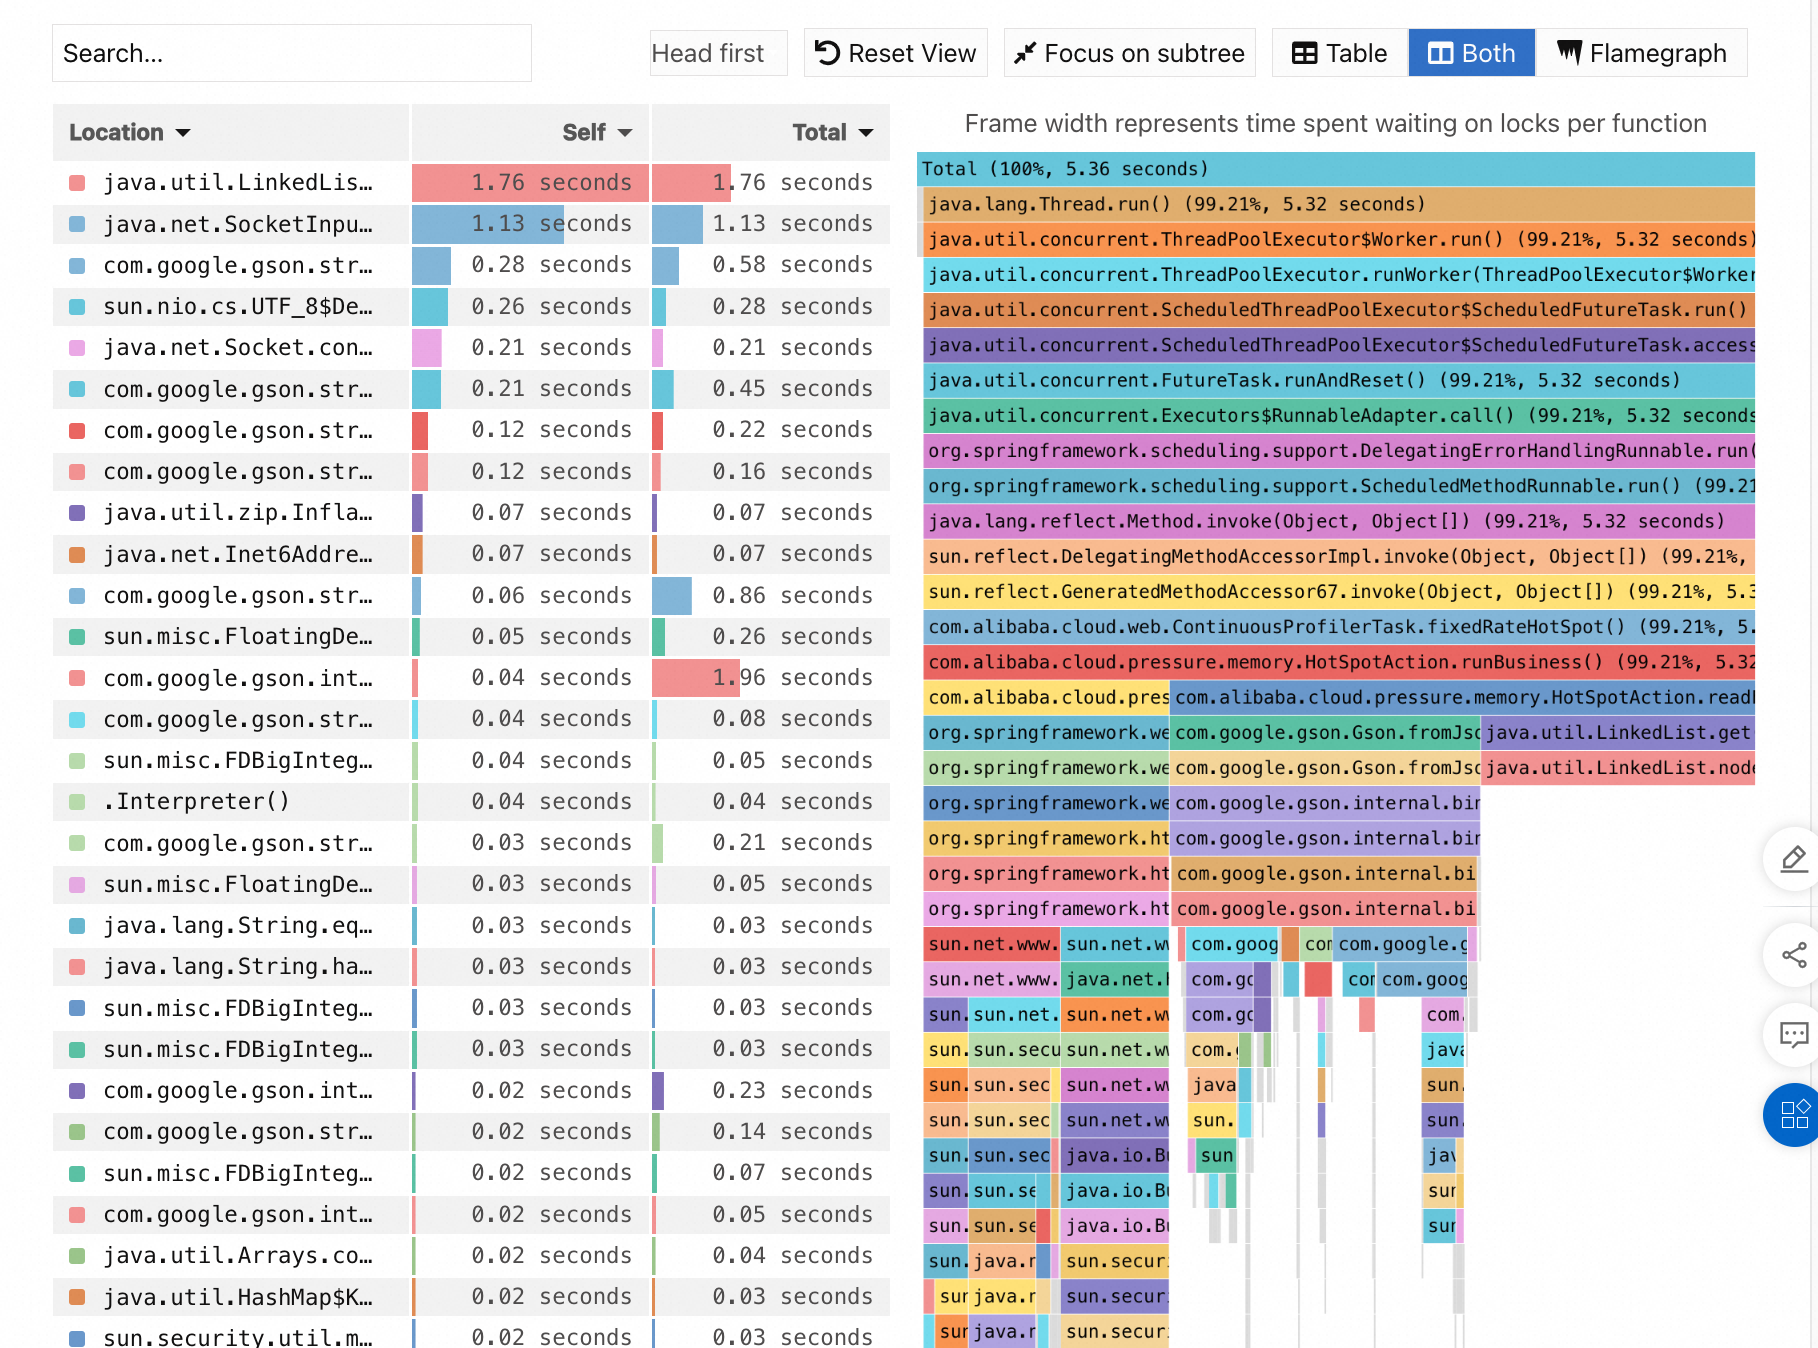
The left side of the figure shows the time consumed for all methods involved, and the right side shows the flame graph of all method stack information for each method.
The Self column displays the time or resources that each method consumes within the stack, excluding the time or resources that their child methods consume. The data can be used to identify methods that spend excessive time or resources.
The Total column displays the time or resources consumed by each method, including those consumed for all of its child methods. The data can be used to identify the methods that contribute the most time or resources.
When you analyze code logic, you can locate the time-consuming methods by focusing on the Self column or the wide flame at the bottom of the right-side flame graph. Generally, a wide flame indicates a system performance bottleneck. The java.lang.Thread.sleep() method in the preceding figure consumes much time because of system performance bottlenecks.
Based on the preceding figure, perform the following analysis:
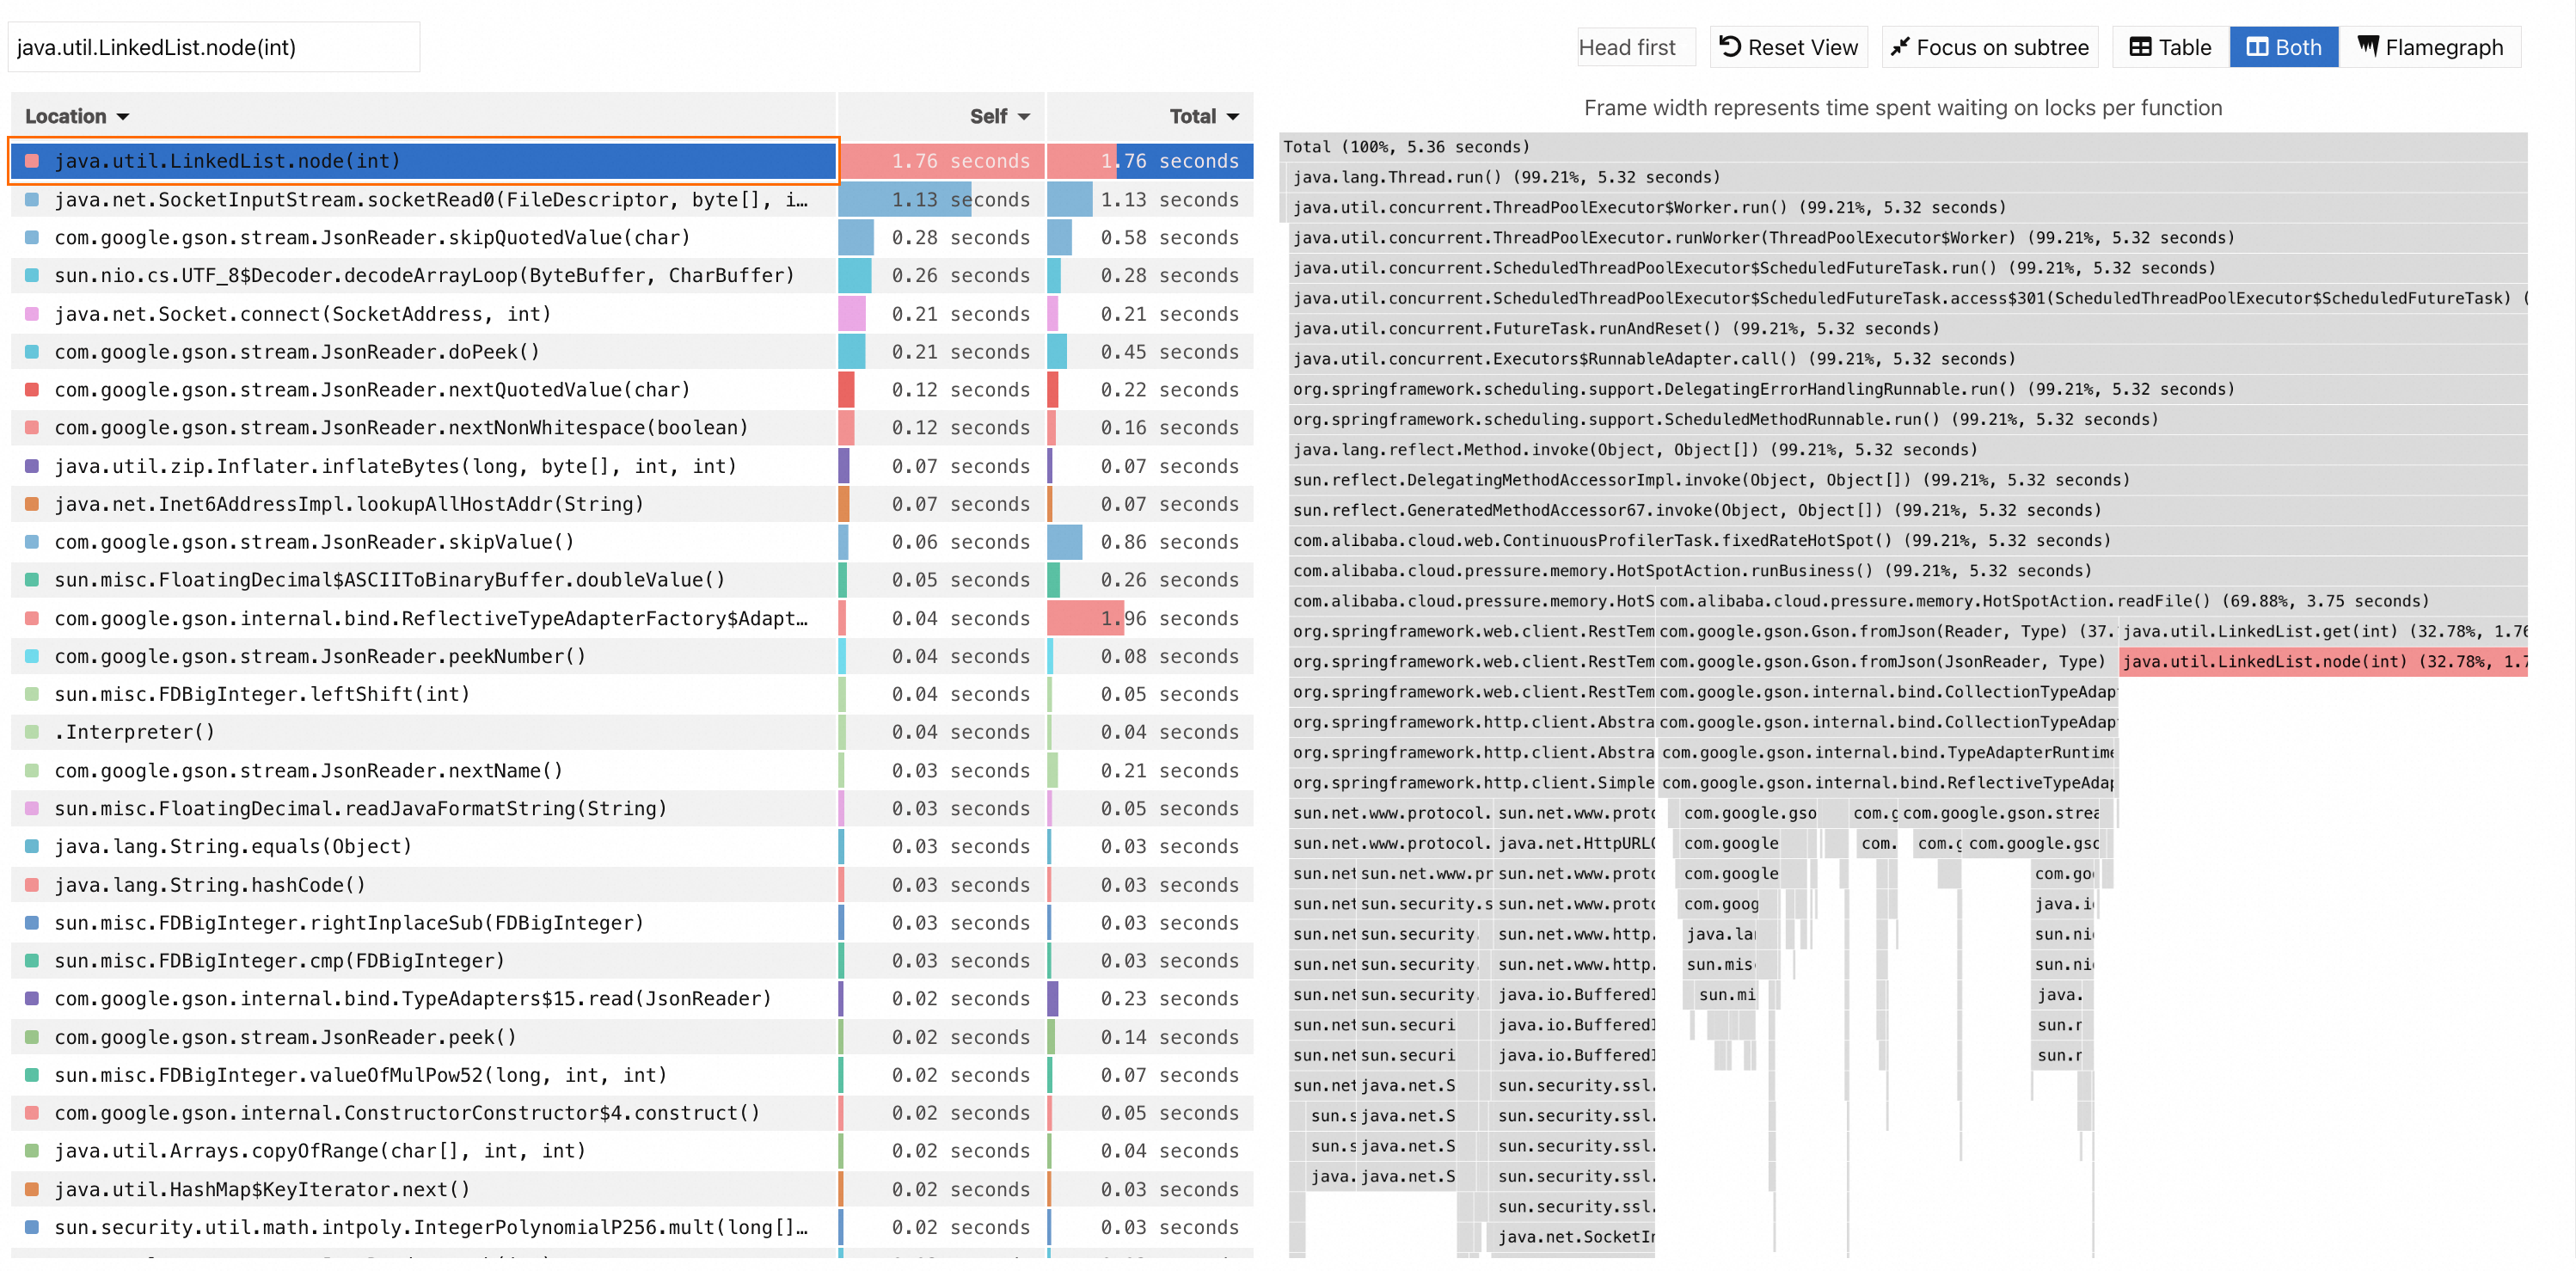
Arrange the values in the Self column in ascending order. Find and click the method java.util.LinkedList.node(int) with the largest value. The relevant methods are shown in the flame graph.

Note that the java.util.LinkedList.node(int) method has the widest box at the stack top of the flame graph.
Because the java.util.LinkedList.node(int) method is a library function of Java Development Kit (JDK), if you search further upward, you will find the java.util.LinkedList.get(int) method and its parent method com.alibaba.cloud.pressure.memory.HotSpotAction.readFile(). As the first service method defined by the application, the com.alibaba.cloud.pressure.memory.HotSpotAction.readFile() method consumes 3.75 seconds, accounting for 69.88% of the stack. You can thus conclude that the com.alibaba.cloud.pressure.memory.HotSpotAction.readFile() method consumes many resources in the specified time period. You can use the method described here to analyze the logic of relevant methods and check whether they can be optimized.
FAQs
Why is the time consumed for the code less than that for the request?
To minimize the impact of the code diagnostics feature on application performance, we have optimized data collection. This way, the time displayed is less than the actual time. Generally, the deviation is no more than 20 milliseconds. We recommend that you ignore the deviation of absolute values and focus on the methods that consume the longest time.
Do the statistics of code diagnostics have limitations?
For requests that take more than 15 minutes, the code diagnostics feature provides only the analysis data for the first 15 minutes.
To reduce system overhead, Application Monitoring does not collect code data from requests that consume less than 500 milliseconds. Therefore, data may not be displayed on the Hotspot Code tab.
References
When you use the continuous profiling feature:
Troubleshoot high CPU and memory utilization issues by referring to the following:
Troubleshoot common issues.