When troubleshooting distributed applications, you often need to jump from a trace span to related logs, external dashboards, or saved searches. Interaction events in Trace Explorer add one-click drill-down links to span fields, so you can correlate trace data with other observability signals without switching consoles.
Trace Explorer supports four interaction event types:
| Event type | Action |
|---|---|
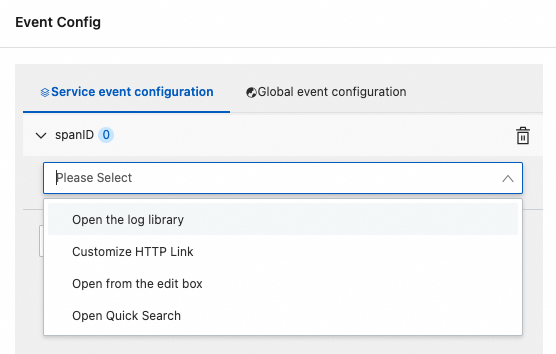
| Open the log library | Redirects to a specified Simple Log Service (SLS) Logstore |
| Customize HTTP Link | Redirects to a specified HTTP URL |
| Open from the edit box | Displays the field value in text or JSON format in a pop-up window |
| Open Quick Search | Redirects to an SLS saved search |
Preset interaction events
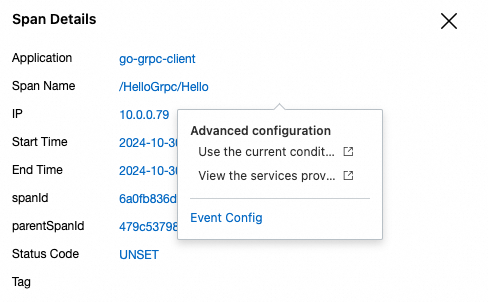
Trace Explorer includes built-in events that cover common drill-down scenarios. Review these before creating custom events -- your use case may already be covered.
| Event | Effective field | Description |
|---|---|---|
| Use the current condition to query the trace | All except Span Events | Appends the field as a query condition |
| View application details | serviceName | Redirects to the Overview tab of the application details page |
| View the services provided | spanName | Redirects to the Provided Services tab of the application details page |
| View instance monitoring details | IP | Redirects to the Instance Monitoring tab of the application details page |
| View raw trace data | TraceID and SpanId | Views the raw trace data stored in SLS |
Create a custom interaction event
If preset events do not cover your use case, create a custom interaction event. Custom events apply at one of two scopes:
Service event configuration: The event applies to all traces of the current application.
Global event configuration: The event applies to all traces in the current region.
To create a custom interaction event:
On the Trace Explorer page, click a trace ID.
Click a span, then click Event Config in the Span Details section.

In the Drilldown Config panel, select the scope: Service event configuration or Global event configuration.
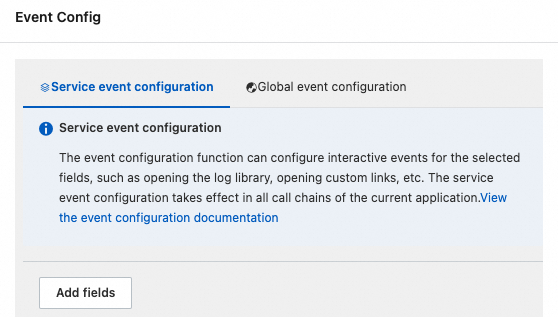
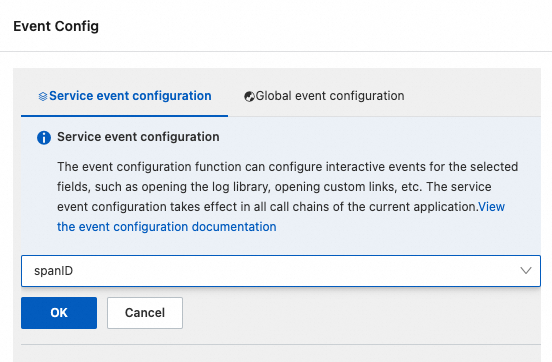
Click Add fields, select a field, and click OK.
Click Add event and select an event type from the drop-down list.
Configure the event parameters and click OK. For parameter details, see Event type reference.
Trigger a custom interaction event
After you configure an event, you can trigger it from the span details view:
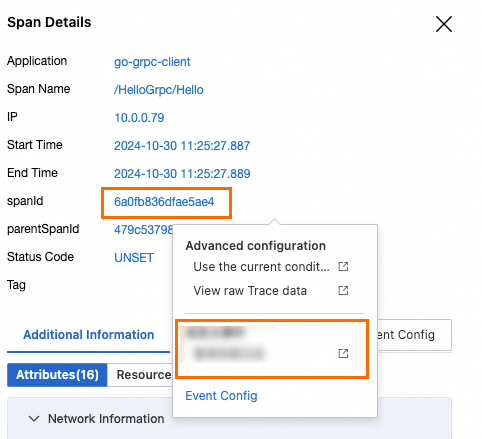
In the Span Details section, hover over a blue field. A tooltip displays the custom interaction events configured for that field.
Click an event name to trigger it.
Event type reference
Open the log library
Redirects to a specified SLS Logstore when triggered.
Prerequisite: A Logstore is created. For more information, see Manage a Logstore.
| Parameter | Required | Description |
|---|---|---|
| Custom Name | Yes | The name displayed in the tooltip when you hover over the field. |
| Please select region | Yes | The region where the SLS project resides. |
| Please select the project | Yes | The SLS project name. |
| Please select a log repository | Yes | The SLS Logstore to redirect to. |
| Open a new window | No | Whether to open the Logstore in a pop-up window. |
| Time range | No | The time range for the Logstore query. See Time range options. |
| Filter statement | No | A filter statement appended before the query statement with the AND operator. Click Add variables to insert field values as filter conditions. Example: traceId=${{traceID}} AND spanId=${{spanID}}. |
Customize HTTP Link
Redirects to a specified HTTP URL when triggered.
Prerequisite: An HTTP URL is available.
| Parameter | Required | Description |
|---|---|---|
| Custom Name | Yes | The name displayed in the tooltip when you hover over the field. |
| agreement | Yes | The URL protocol: HTTP or HTTPS. |
| Link address | Yes | The target URL path. Click Add variables to insert field values as path parameters. When triggered, field values replace the corresponding variables in the URL. |
| Whether to transcode | No | Whether to URL-encode the link. |
| Open a new window | No | Whether to open the URL in a pop-up window. |
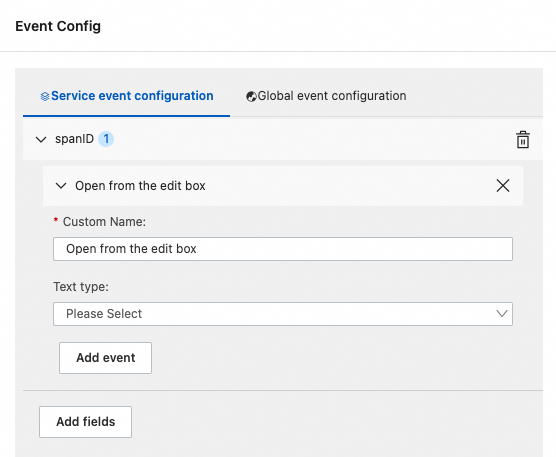
Open from the edit box
Displays the field value in text or JSON format in a pop-up window when triggered.
| Parameter | Required | Description |
|---|---|---|
| Custom Name | Yes | The name displayed in the tooltip when you hover over the field. |
| Text type | No | The display format for the field value: text or JSON. |
Open Quick Search
Redirects to an SLS saved search when triggered.
Prerequisites:
A saved search is created in SLS. For more information, see Saved search.
If you use variables in the interaction event, make sure the variables are configured in the query statement of the saved search. For more information, see Variables.
| Parameter | Required | Description |
|---|---|---|
| Custom Name | Yes | The name displayed in the tooltip when you hover over the field. |
| Please select region | Yes | The region where the SLS project resides. |
| Please select the project | Yes | The SLS project name. |
| Please select Quick Search | Yes | The saved search to redirect to. |
| Open a new window | No | Whether to open the saved search in a pop-up window. |
| Time range | No | The time range for the saved search query. See Time range options. |
| Filter statement | No | A filter statement appended before the query statement with the AND operator. Click Add variables to insert field values as filter conditions. |
| Dynamic variables | No | Override variables in the saved search query statement. If a variable name matches one in the query statement, the value specified here takes precedence. You can add up to 5 dynamic variables and 5 static variables. |
| Static variables | No | Static key-value pairs that replace placeholder variables in the saved search. |
Dynamic variable fields:
| Field | Description |
|---|---|
| Variable | The variable name. |
| Variable Value Column | The column whose values dynamically replace the variable in the saved search. |
Static variable fields:
| Field | Description |
|---|---|
| Variable | The variable name. |
| Value | A fixed value that replaces the placeholder variable in the saved search. |
Time range options
Both Open the log library and Open Quick Search support the following time range modes:
| Mode | Behavior |
|---|---|
| Default | Uses the default time range: 15 Minutes (Relative). |
| Use Query Time | Uses the time range specified in Trace Explorer at the moment the event is triggered. |
| Data Point Time | Start time = Time Range Field value minus Time range field difference value. End time = Time Range Field value plus Time range field difference value. |
| Relative time range | Uses the specified relative time range. |
| Time frame | Uses the hourly points within the specified time frame. |
Redirect through a virtual domain name
If you access Trace Explorer through a virtual domain name -- for example, an ARMS console page embedded in a self-managed web application -- triggering Open the log library or Open Quick Search redirects to the SLS logon page instead of the SLS console. To work around this, use Customize HTTP Link to redirect through the SLS virtual domain name:
Create a Customize HTTP Link event.
Select the HTTPS protocol and enter the URL of the SLS console page in the Link Address field.
Replace the domain
sls.console.alibabacloud.comin the URL withsls4servims.console.alibabacloud.com(the SLS virtual domain name). For more information, see Embed console pages and share log data.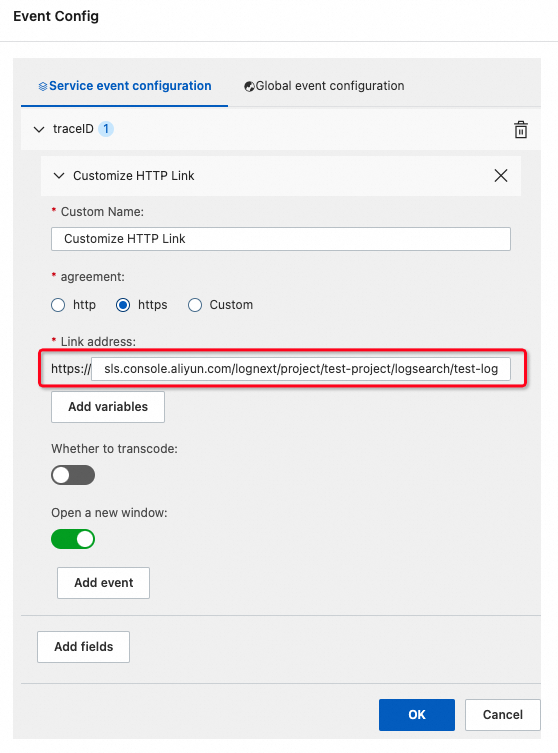
To pass query parameters to the Logstore, click Add variables to insert them as variables.
The following example URL opens a Logstore named test-logstore in the project test-project and searches for the current trace:
https://sls.console.alibabacloud.com/lognext/project/test-project/logsearch/test-logstore?queryString=traceId=${{traceID}}