Trace Explorer of the Application Real-Time Monitoring Service (ARMS) console provides a search bar, a filter panel, and a quick filter pane. You can combine the filter conditions and options based on your needs.
Search bar
On the Trace Explorer page, enter an expression in the search bar.

Trace Explorer supports the query statement syntax of Simple Log Service (SLS).
For information about the fields, see Search syntax.
For information about the SLS operators, see Trace Explorer parameters. Analysis statements are not supported.
If you want to use the wildcard characters * and ? in the expression, select Allow Fuzzy Search.
The unit of duration is nanoseconds. For example, to query traces whose duration is greater than 500 milliseconds, you need to enter the
duration >= 500000000expression. To query traces whose duration ranges from 0 to 500 milliseconds, you need to enter theduration in (0 500000000)expression. The interval (0, 500000000) is left-closed and right-open.To query fields in Attributes or Resources, add the
attributes.orresources.prefix to the expression.
Sample expressions:
Query traces related to the /components/api/v1/ads/data interface whose HTTP status code is 500:
spanName : "/components/api/v1/ads/data" and attributes.http.status_code : 500Query traces related to exceptions thrown by the opentelemetry-demo-adservice application:
serviceName : "opentelemetry-demo-adservice" and attributes.excep.ids : *
Filter panel
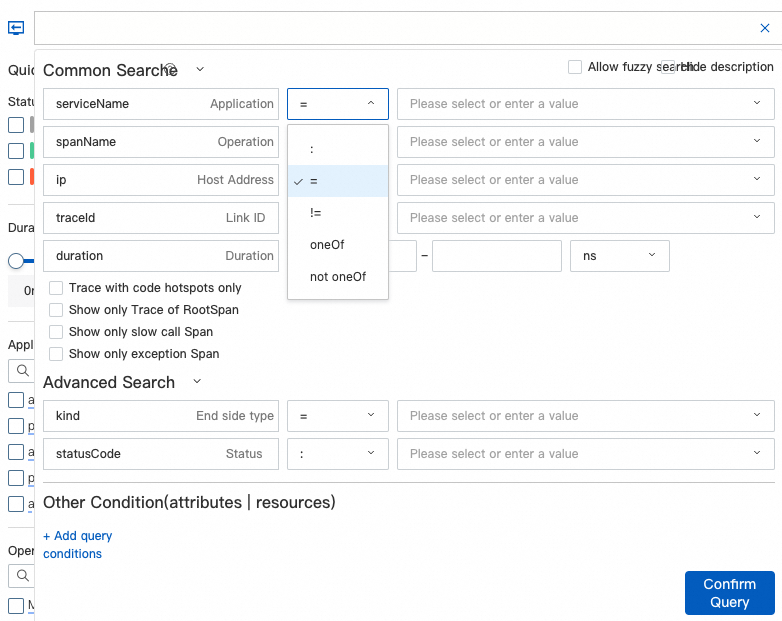
On the Trace Explorer page, click the search bar. In the drop-down filter panel, you can specify filter conditions and values, or add custom attributes or resources to the query.

To assign multiple values to a filter condition, use the oneOf operator. To exclude values from a filter condition, use the not oneOf operator.
The unit of duration is nanoseconds. For example, to query traces whose duration is greater than 500 milliseconds, you need to enter the
duration >= 500000000expression. To query traces whose duration ranges from 0 to 500 milliseconds, you need to enter theduration in (0 500000000)expression. The interval (0, 500000000) is left-closed and right-open.To query fields in Attributes or Resources, click + Add Query Condition.
Quick filter pane
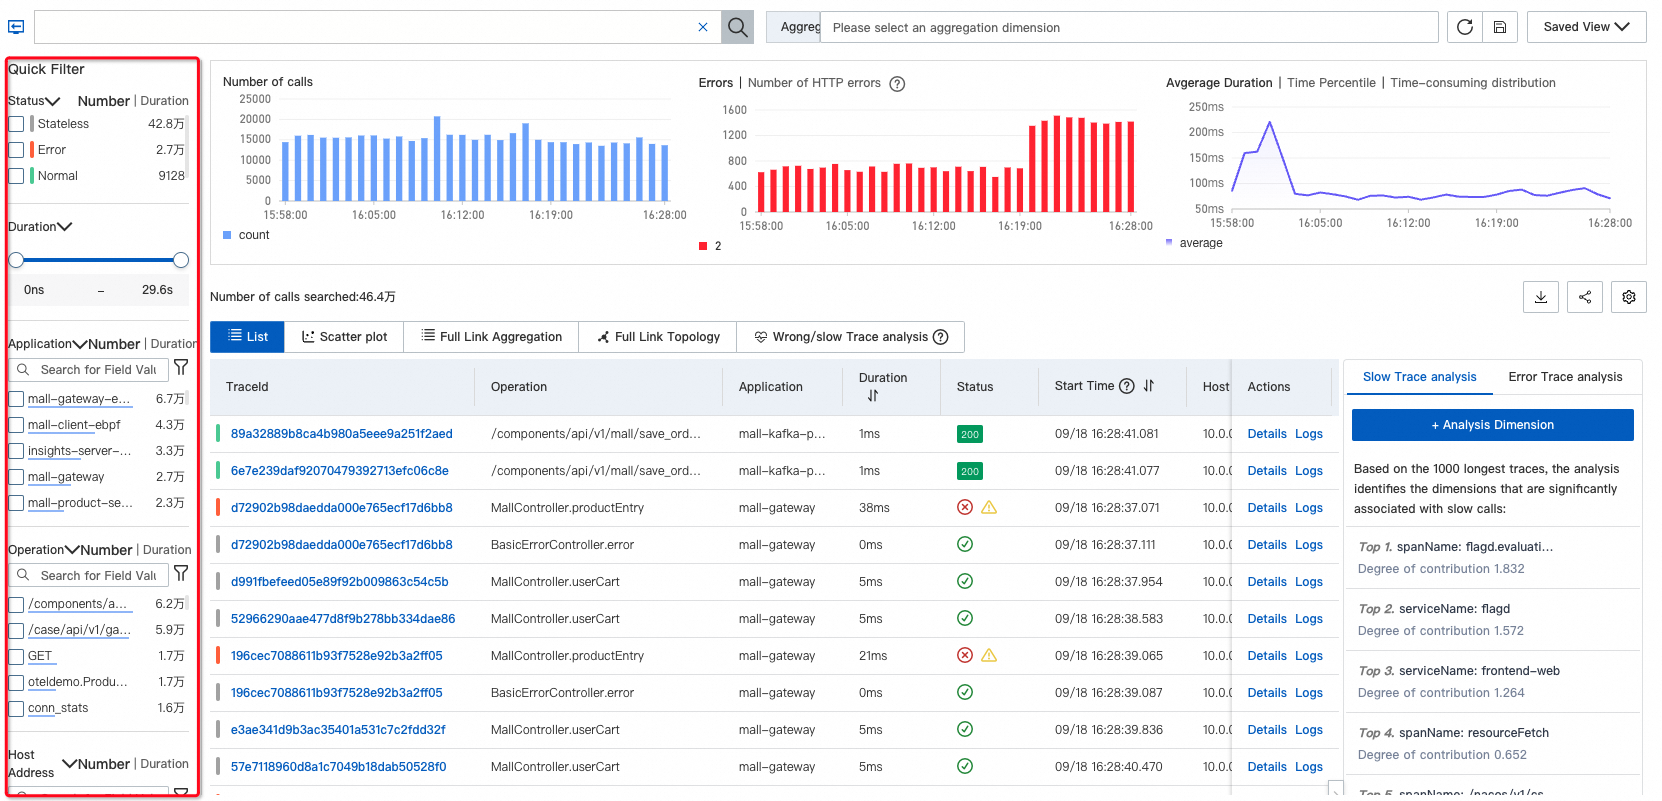
In the Quick Filter pane of the Trace Explorer page, query traces by status, duration, application name, span name, or host address.
To query traces whose
status codeis 2xx, you can configure the Status condition and set the value to Error.To query traces related to a specific application or interface, configure the application or interface as a filter condition.
The user-friendly quick filter pane supports multi-level filtering. The real-time data of queried traces is displayed on the Trace Explorer page to help you quickly identify potential exceptions.
