Integrate Nagios with Application Real-Time Monitoring Service (ARMS) Alert Management to forward host and service alerts from Nagios to ARMS. ARMS then deduplicates and routes these alerts through notification policies.
Prerequisites
Before you begin, make sure that you have:
An Alibaba Cloud account with ARMS enabled
A running Nagios server with administrative access
Python installed on the Nagios server
The
requestsPython library (installed during setup if not already present)
Step 1: Create a Nagios integration in ARMS
Log on to the ARMS console.
In the left-side navigation pane, choose Alert Management > Integrations.
On the Alert Integration tab, click Nagios.
In the Create Nagios Integration dialog box, enter a name and description, specify the automatic recovery time, and then click Save.
NoteIf an alert event is not triggered again within the automatic recovery period, ARMS automatically clears it.
On the Alert Integration tab, find the Nagios integration you created and copy the URL in the Integration Address column.

Step 2: Configure Nagios to forward alerts
Create a Python script on the Nagios server to post alert data to the ARMS integration endpoint, then configure Nagios commands and contacts to invoke the script.
Create the alert notification script
Log on to the Nagios server and go to the plugins directory:
cd /usr/local/nagios/libexec/Create a file named
nagios-alert.pywith the following content:ImportantReplace
<your-integration-url>with the integration address you copied in Step 1.#!/usr/bin/python # -*- coding: utf-8 -*- import requests import json import sys import os headers = {'Content-Type': 'application/json;charset=utf-8'} api_url = "<your-integration-url>" # Replace with the integration address from Step 1 def parse(sys): object_type = str(sys.argv[1]) notification_type = str(sys.argv[2]) host_name = str(sys.argv[3]) host_ip = str(sys.argv[4]) state = str(sys.argv[5]) time = str(sys.argv[6]) info = str(sys.argv[7]) if object_type == 'host': description = "[{}] {} alert: {} is {}".format(notification_type, object_type, host_name, state) service = "" else: service = str(sys.argv[8]) description = "[{}] {} alert: {}/{} is {}".format(notification_type, object_type, host_name, service, state) content_dict = {'service':""} content_dict['object_type'] = object_type content_dict['notification_type'] = notification_type content_dict['host_name'] = host_name content_dict['host_ip'] = host_ip content_dict['state'] = state content_dict['time'] = time content_dict['info'] = info content_dict['service'] = service content_dict['description'] = description print(content_dict) return content_dict def msg(text): result = requests.post(url=api_url, data=json.dumps(text), headers=headers) print(result) if __name__ == '__main__': text = parse(sys) msg(text)Install the
requestslibrary if it is not already installed:pip install requests
Define Nagios commands
Open the Nagios commands configuration file:
vim /usr/local/nagios/etc/objects/commands.cfAdd the following command definitions to the file:
define command{
    command_name notify-host-by-alert
    command_line python /usr/local/nagios/libexec/nagios-alert.py "host" "$NOTIFICATIONTYPE$" "$HOSTALIAS$" "$HOSTADDRESS$" "$HOSTSTATE$" "$LONGDATETIME$" "$HOSTOUTPUT$"
    }

define command{
    command_name notify-service-by-alert
    command_line python /usr/local/nagios/libexec/nagios-alert.py "service" "$NOTIFICATIONTYPE$" "$HOSTALIAS$" "$HOSTADDRESS$" "$SERVICESTATE$" "$LONGDATETIME$" "$SERVICEOUTPUT$" "$SERVICEDESC$"
    }
Save and close the file.
Update contact notification commands
Open the Nagios contacts configuration file:
vim /usr/local/nagios/etc/objects/contacts.cfgAdd or update the following notification command directives in the contact definition:
service_notification_commands   notify-service-by-alert
host_notification_commands      notify-host-by-alert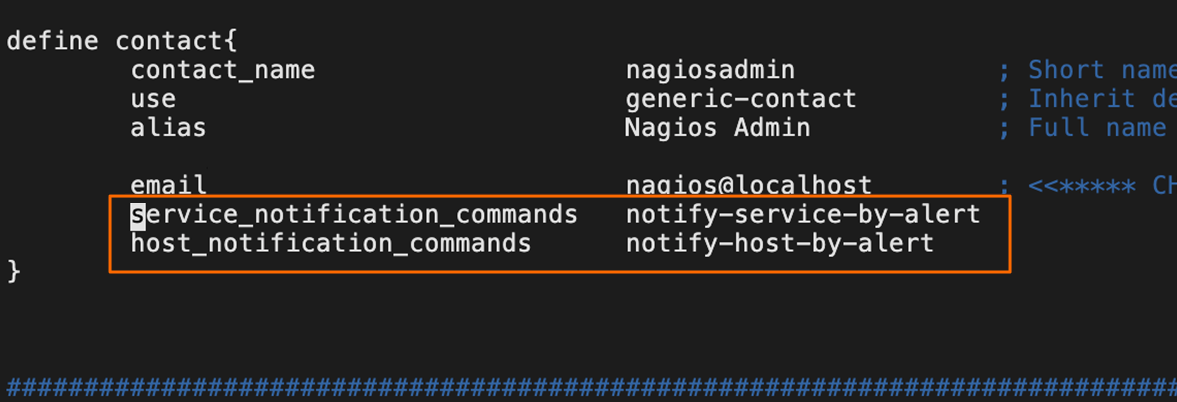
Save and close the file.
Restart Nagios
Run the following command to apply the changes:
systemctl restart nagios(Optional) Step 3: Customize field mappings
ARMS provides default field mappings between Nagios alert data and ARMS alert events. To add or modify these mappings, edit the integration.
The following JSON shows a sample Nagios alert payload:
{
    "info": "SWAP CRITICAL - 0% free (0 MB out of 0 MB) - Swap is either disabled, not present, or of zero size.",
    "description": "[PROBLEM] service alert: localhost/Swap Usage is CRITICAL",
    "service": "Swap Usage",
    "host_ip": "127.0.0.1",
    "state": "CRITICAL",
    "object_type": "service",
    "time": "Tue Sep 14 10:46:49 CST 2021",
    "notification_type": "PROBLEM",
    "host_name": "localhost"
}
Send test data
On the Alert Integration tab, find the integration and click Edit in the Actions column.
In the Event Mapping section, click Send Test Data.
In the Send Test Data dialog box, paste a JSON alert payload and click Send.
NoteIf the message "Uploaded. No events are generated. Configure mappings based on the original data." appears, the source fields are not yet mapped. The uploaded data is displayed in the left pane for you to select fields when configuring mappings.
If the message "Uploaded." appears, the alert content has been reported to the Alert Event History page. For more information, see View historical alert events.
In the Send Test Data dialog box, click Disable.
Configure field mappings
In the left pane of the Event Mapping section, click a data record to view its details.
(Optional) In the Select Root Node section, enable batch processing if the alert data contains an array node. Select the array node to use as the root node. The system processes data under that node in a batch.
NoteIf multiple array nodes exist in the alert data, you can select only one for batch processing.
In the Map Source Fields to Target Fields section, map source fields to ARMS alert fields. Click the Map icon to select a mapping method:
Direct -- Maps a single source field to an ARMS alert field.
Series -- Concatenates multiple source fields with a delimiter (special characters only), then maps the result to an ARMS alert field.
Condition -- Maps source fields to ARMS alert fields only when values meet specified conditions.
Mapping table -- Maps severity levels from the alert source to ARMS severity levels. Use this method only for the
severityfield.
ARMS alert fields
| Field | Description |
|---|---|
| alertname | Custom alert name. |
| severity | Alert severity level. Must use the Direct mapping method. |
| message | Alert description, used as alert notification content. Maximum length: 15,000 characters. |
| value | Sample metric value. |
| imageUrl | URL of a Grafana metrics line chart. |
| check | Alert check item, such as CPU, JVM, Application Crash, or Deployment. |
| source | Alert source. |
| class | Type of the object that triggers the alert event, such as host. |
| service | Source service, such as Login Service. |
| startat | Timestamp for the event start time. |
| endat | Timestamp for the event end time. |
| generatorUrl | URL of the event details page. |
Configure event deduplication
Event deduplication merges multiple events that share the same value for a specified field into a single alert notification, reducing noise.
Deduplication applies only to uncleared events.
In the Event Deduplication section on the Integration Details page, select the fields to use for deduplication.
Click Deduplication Test to preview the grouping results.
NoteThe deduplication test runs against the 10 most recent data records uploaded in the Event Mapping section.
Click Save.
View alert event details
In the left-side navigation pane, choose Alert Management > Alert Event History.
Click an alert event name to view its details. For more information, see View historical alert events.
Manage integrations
On the Alert Integration tab (Alert Management > Integrations), manage your integrations with the following operations:
View details -- Click the integration row to open the Integration Details page.
Update key -- Choose More > Update Key in the Actions column, and then click OK.
ImportantAfter you update the key, update the
api_urlvalue in thenagios-alert.pyscript and restart Nagios. See Step 2: Configure Nagios to forward alerts.Edit -- Click Edit in the Actions column to modify the integration on the Integration Details page, and then click Save.
Enable or disable -- Click Enable or Disable in the Actions column.
Delete -- Click Delete in the Actions column, and then click OK.
Add an event processing flow -- Click Add Event Processing Flow in the Actions column. For more information, see Work with event processing flows.
Create a notification policy -- Choose More > Create Notification Policy in the Actions column. For more information, see Create and manage a notification policy.
What to do next
After you create a notification policy, ARMS generates alerts and sends notifications for incoming alert events based on that policy. For more information, see Create and manage a notification policy.
To review sent alerts, go to the Alert Sending History page. For more information, see View historical alerts.