This topic describes how to integrate alerts that are generated in Cloud Monitor into the Alert Management sub-service of Application Real-Time Monitoring Service (ARMS).
Background information
You can use webhooks to integrate alerts that are generated in Cloud Monitor into the Alert Management sub-service of ARMS. After you integrate alerts from different systems into Alert Management, you can use Alert Management to handle the alerts in a centralized manner. If you do not integrate the alerts into Alert Management, the systems handle the alerts based on their processing capabilities.
You can use one of the following methods to integrate alerts that are generated in Cloud Monitor into the Alert Management sub-service of ARMS:
Integrate all alerts that are generated for a specified service monitored by Cloud Monitor into the Alert Management sub-service of ARMS. For more information, see Create an integration and integrate Cloud Monitor alerts into ARMS.
Integrate the specified alert rules of Cloud Monitor into the Alert Management sub-service of ARMS. For more information, see Integrate specified alert rules of Cloud Monitor.
Create an integration and integrate Cloud Monitor alerts into ARMS
Log on to the ARMS console. In the left-side navigation pane, choose .
On the Alert Integration tab, click CloudMonitor.
In the dialog box that appears, enter the name and description of the integration and configure the automatic recovery time of alert events.
NoteIf an alert event is not triggered again within the specified period of time, the alert event is automatically cleared.
The All Services section of Services with Alert Events Enabled displays all the services whose alerts can be integrated within your Alibaba Cloud account. Select the services whose alerts you want to integrate, click the
 icon, and then click Save. Note
This configuration enables ARMS to traverse all alert rules that are configured for the selected services and automatically change the request URLs of all rules to
https://alerts.aliyuncs.com/api/v1/cm/callback/{{token}}.{{token}}specifies the key that is automatically created when you create an integration.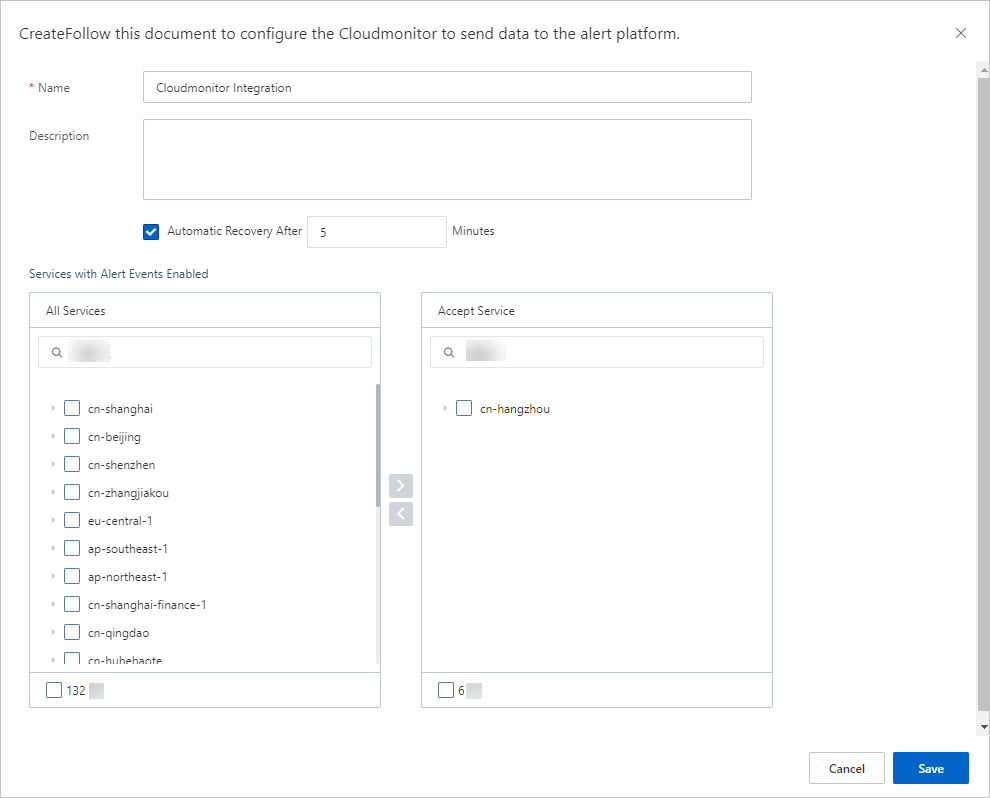
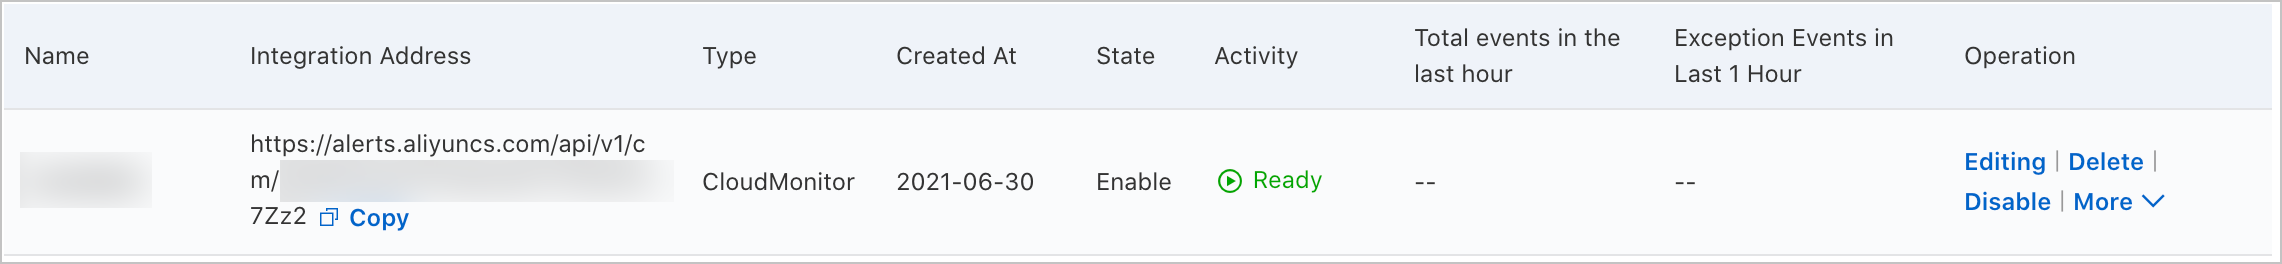
After you complete the preceding operations, you can view the integration that you created on the Alert Integration tab.
Integrate specified alert rules of Cloud Monitor
You can integrate specified alert rules into only existing Cloud Monitor integrations.
On the Alert Integration tab of the Integrations page, find the Cloud Monitor integration into which you want to integrate specified alert rules and copy the URL of the integration.
Log on to the Cloud Monitor console.
In the left-side navigation pane, choose .
On the Alert Rules page, find the alert rule that you want to modify and click Modify in the Actions column.
In the Create Alert Rule panel, enter the integration URL in the Alert Callback field of the Advanced Settings section.
Click OK.
Modify the integration
Alert Management provides field mappings between Grafana alert sources and ARMS alert events. You can also add or modify the mappings between fields on the Edit Integration page.
On the Alert Integration tab, find the integration that you want to manage and click Edit in the Actions column.
In the Event Mapping section, click Send Test Data.
In the Send Test Data dialog box, enter the alert content of a third-party alert source in the JSON format and click Send.
NoteIf the message Uploaded. No events are generated. Configure mappings based on the original data. appears, the fields of the alert source are not mapped to the fields of ARMS alert events. The data that is sent is displayed in the left-side box. This allows you to select the source fields when you configure mappings.
If the message Uploaded. appears, the alert content is reported to the Alert Event History page. For more information, see View historical alert events.
In the Send Test Data dialog box, click Disable.
In the left part of the Event Mapping section, click the data records for which you want to configure mappings to view the details.
In the right part of the Event Mapping section, configure field mappings between the alert source and ARMS.
Optional:In the Select Root Node section, specify whether to enable batch processing.
If an array node exists in the alert data, you can specify the array node as the root node. The data that belongs to the root node is processed in batches.
After you select Use Batch Processing, select the array node to be batch processed as the root node.
NoteIf multiple array nodes exist in the alert data, you can select only one of the array nodes for batch processing.
In the Map Source Fields to Target Fields section, map the fields of the alert source to the alert fields of ARMS.
Click the mapping icon to change the method for field mapping.
Direct: The specified field of the alert source is directly mapped to the specified alert field of ARMS.
Series: You can use delimiters to concatenate multiple fields of the alert source into one field, and then map this field to the specified alert field of ARMS. Only special characters can be used as delimiters.
Conditional: The specified alert source fields are mapped to the ARMS alert fields only when the field values meet the specified conditions.
Mapping table: The alert source severity is mapped to the ARMS alert severity. The mapping table contains only the severity field.
The following table describes the alert fields of ARMS.
Alert field
Description
alertname
The name of the custom alert.
severity
The severity level of the alert. You must configure mappings for this field. The mapping method must be set to Direct.
message
The description of the alert. The description is used as the content of the alert message. The description cannot exceed 15,000 characters in length.
value
The sample value of a metric.
imageUrl
The URL of the line chart that contains Grafana metrics. The URL is used to map the line chart.
check
The check item of the alert. Examples: CPU, JVM, Application Crash, and Deployment.
source
The source of the alert.
class
The type of the object that triggers the alert event, for example, host.
service
The source service of the alert. Example: Login Service.
startat
The timestamp that represents the start time of the event.
endat
The timestamp that represents the end time of the event.
generatorUrl
The URL of the event details.
Configure field deduplication for alert events.
To reduce duplicate data, the system uses relevant fields as the basis for deduplication. ARMS Alert Management allows you to preview the deduplication grouping results of historical event data that is displayed in the Event Mapping section. You can change the fields to be deduplicated.
NoteYou can configure deduplication only for events that are not cleared.
In the Event Deduplication section on the Integration Details page, select the fields that are used for deduplication.
If multiple events have the same value for a specified field, the events are merged into one alert notification.
Click Deduplication Test to preview the alert group after deduplication.
NoteThe deduplication test takes effect only on the latest 10 data records that are uploaded in the left part of the Event Mapping section.
After you configure the settings, click Save.
View the details about an alert event
In the left-side navigation pane of the ARMS console, choose .
On the Alert Event History page, click the name of the alert event to view the event details. For more information, see View historical alert events.
Add service alerts
If you want to add service alerts to an existing Cloud Monitor integration, you can perform the following steps:
On the Integrations page of the ARMS console, find the Cloud Monitor integration to which you want to add alerts and click More in the Actions column. In the list that appears, click Select a product.
In the dialog box that appears, select the Cloud Monitor whose alerts you want to add, click the
icon, and then click Save.
Manage the integration
In the left-side navigation pane, choose . On the Alert Integration tab, you can perform the following operations on the integrations that you created:
View the details of an integration: Find the integration and then click the row. On the Integration Details page, view the integration details.
Update a key: Find the integration and then choose in the Actions column. In the message that appears, click OK.
ImportantAfter you update the key, add alerts of the services monitored by Cloud Monitor to the integration again. For more information, see Add service alerts.
Modify an integration: Find the integration and then click Edit in the Actions column. On the Integration Details page, modify the integration information and then click Save.
Enable or disable an integration: Find the integration and then click Disable or Enable in the Actions column.
Delete an integration: Find the integration and then click Delete in the Actions column. In the message that appears, click OK.
Add an event processing flow to an integration: Find the integration and click Add Event Processing Flow in the Actions column. For more information, see Work with event processing flows.
Create a notification policy: Find the integration for which you want to create a notification policy, and click More in the Actions column. In the list that appears, click Create Notification Policy. For more information, see Create and manage a notification policy.
What to do next
After you create a notification policy, the system generates alerts and sends alert notifications for reported alert events based on the notification policy that you created. For more information, see Create and manage a notification policy. On the Alert Sending History page, you can view the alerts that are generated based on the configured notification policy. For more information, see View historical alerts.