After viewing the SQL basic information, you can go to the SQL details page by clicking the SQL text. The SQL details page displays the SQL text, optimization suggestions, sampling details, diagnostic details, sampling history, execution history, and execution plans of an SQL statement. The displayed information varies based on the diagnostic situation of the specific SQL statement.
SQL text
In the SQL Text section, you can view the complete SQL text. By selecting Table Structure, you can view the schema of the corresponding table.

Optimization suggestions
This section is not displayed if no optimization suggestion is provided.
In the Optimization Suggestions section, you can view all errors of the SQL statement within the diagnostics time range and corresponding optimization suggestions. Currently, the system provides two types of optimization suggestions:
Plan recommendation The system analyzes the execution plans for the SQL statement within the last week and recommends the one that significantly outperforms others (local plans or distributed plans) in terms of CPU time. If an execution plan is recommended, we recommend that you analyze the differences between the recommended execution plan and the existing execution plan. If the recommended execution plan does not contain DDL operations for changes, you can bind it. After you bind the recommended execution plan, check the optimization effects. If the execution is not optimized, perform a rollback.
Plan recommendation rules: A candidate plan is recommended based on the CPU time of the latest plan. When the CPU time of the latest plan is short, a candidate plan is recommended only when its CPU time is significantly shorter than that of the latest plan. When the CPU time of the latest plan is long, a candidate plan is recommended as long as its CPU time is slightly shorter than that of the latest plan.
CPU time of the latest plan
CPU time of the candidate plan
[0, 1) ms
The CPU time of the candidate plan is 1/10 of that of the latest plan.
[1, 10) ms
The CPU time of the candidate plan is 1/5 of that of the latest plan.
[10, 100) ms
The CPU time of the candidate plan is 1/2 of that of the latest plan.
[100, 1000) ms
The CPU time of the candidate plan is 2/3 of that of the latest plan.
[1000, ∞) ms
The CPU time of the candidate plan is 5/6 of that of the latest plan.
Index recommendation
The specific rules for index recommendation are as follows:
The equality query columns are arranged in the front and combined in any order.
If range queries are performed, the range query column with the best selectivity is arranged after the equality query columns.
If no range query is performed, the sorting column is arranged after the equality query columns when the sorting elimination condition is met.
Other columns in the predicate are arranged after the index. In this case, the index is a half-width index.
Other columns in the SELECT statement are arranged after the index to construct a covering index.
If the covering index contains eight or fewer columns, the covering index is recommended. Otherwise, the half-width index is recommended.
An index is recommended only when the CPU time exceeds 10 ms or the response time exceeds 20 ms.

SQL diagnostic details
This section is not displayed if no diagnostic details are available.
In the SQL Diagnostic Details section, you can view the number of occurrences of the same issue within the diagnostic time range, as well as the latest diagnostic details, including the time range, number of executions, CPU time, and last execution time. Click the triangle arrow to further view the diagnostics basis and troubleshooting suggestions.
SQL sampling details
Sampling details are displayed only when a SQL statement is classified as SlowSQL.
In the SQL Sampling Details section, you can view the sampling details of the current SQL statement. You can click the gear icon to specify the columns to be displayed. Click Export to download the list of SQL sampling details.
Aggregated SQL details
The details of an aggregated SQL statement are displayed only on its details page.
In the Aggregated SQL Details section, you can view all relevant SQL information. Click Manage Columns to set the columns to be displayed and adjust the order of the columns. Click + to view the last error and the error summary information during the statistical period.

Physical execution plan
On the Physical Execution Plan tab, the displays are different between non-aggregated SQL and aggregated SQL statements.
Physical execution plan for non-aggregated SQL statements
Expand Plan Hash to view the details of the corresponding physical execution plan.
On the execution plan details page:
View the specific application process of operators in the execution steps, the server execution plan, and the SQL details of the generated plan. For a basic introduction to operators, see Introduction to SQL execution plans.

Hovering over the object name in the execution plan allows you to view the table structure or DDL index information, etc.
If the object is a table, you can view the table structure.
If the object is an index, you can view DDL index information, etc.
Click Custom Time in the upper right corner and select Last Hour or Last 12 Hours from the drop-down list to quickly filter the query time period. You can also customize the query time period. Currently, only the physical execution plans for the last 15 days can be queried.
Click Binding History in Last 30 Days to view the binding records of the physical execution plan for the last 30 days.
Click Refresh Plan Cache to clear the execution plan cache for this SQL statement in the tenant. The next time this SQL statement is executed, a new execution plan will be generated.
Click Bind to forcefully execute the SQL statement according to this execution plan. If the execution plan is bound to an SQL statement, it will be displayed as Bound.

Physical execution plan for aggregated SQL statements
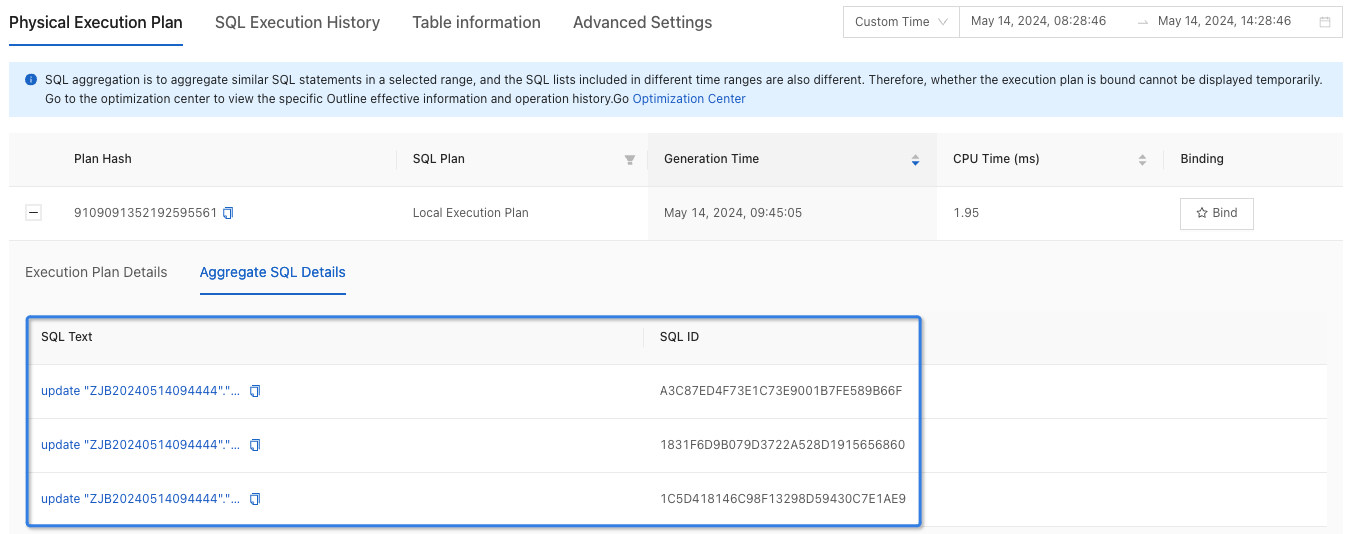
SQL aggregation is used to aggregate similar SQL statements within a specified time range. The list of included SQL statements varies depending on the specified time range. Therefore, the display of whether the execution plan is bound cannot be shown at present. Please go to the Optimization Center to view the details about active outlines and optimization records.
Expand Plan Hash to view the details of the corresponding physical execution plan and aggregate SQL details.
On the Execution Plan Details tab:
View the specific application process of operators in the execution steps , the server execution plan, and the SQL details of the generated plan. For a basic introduction to operators, see Introduction to SQL execution plans.
Hovering over the object name in the execution plan allows you to view the table structure or DDL index information, etc.
If the object is a table, you can view the table structure.
If the object is an index, you can view DDL index information, etc.
On the Aggregate SQL Details tab, view the list of aggregate SQLs, including SQL Text and SQL ID.

Click Custom Time in the upper right corner and select Last Hour or Last 12 Hours from the drop-down list to quickly filter the query time period. You can also customize the query time period. Currently, only the physical execution plans for the last 15 days can be queried.
Click Bind to forcefully execute the SQL statement according to this execution plan. If the execution plan is bound to an SQL statement, it will be displayed as Bound.
SQL execution history
On the SQL Execution History tab, the displays are different between non-aggregated SQL and aggregated SQL statements.
Execution history of non-aggregated SQL statements
You can view the execution history and statistical charts of an SQL statement in the last hour, last 12 hours, or a custom time range.
SQL Execution History: You can view the execution history of the current SQL statement.
Click All Nodes and select the target node from the drop-down list.
Click Custom Time and select Last Hour or Last 12 Hours from the drop-down list to quickly filter the query time period. You can also customize the query time period, but note the following limitations:
Only supports viewing SQL execution history for the last 15 days.
Minimum Range Limit:
For data within 3 days: The selected time range must be at least 1 minute.
For data from 3 to 7 days: The selected time range must be at least 5 minutes.
For data beyond 7 days: The selected time range must be at least 20 minutes.
Click Manage Columns in the upper-right corner and select the fields that you want to frequently view.
Click Export to download the execution history of the SQL statement.

SQL Execution Time: You can click a category on the right to view the corresponding execution time.

Total Executions: You can click Total Executions and select the target data from the drop-down list.

Execution history of aggregated SQL statements
You can view the execution history and statistical charts of an SQL statement in the last hour, last 12 hours, or a custom time range.
SQL Execution History: You can view the execution history of the current SQL statement. Click Manage Columns in the upper-right corner, select the information that needs to be frequently viewed, and click Export to download the list of execution history.

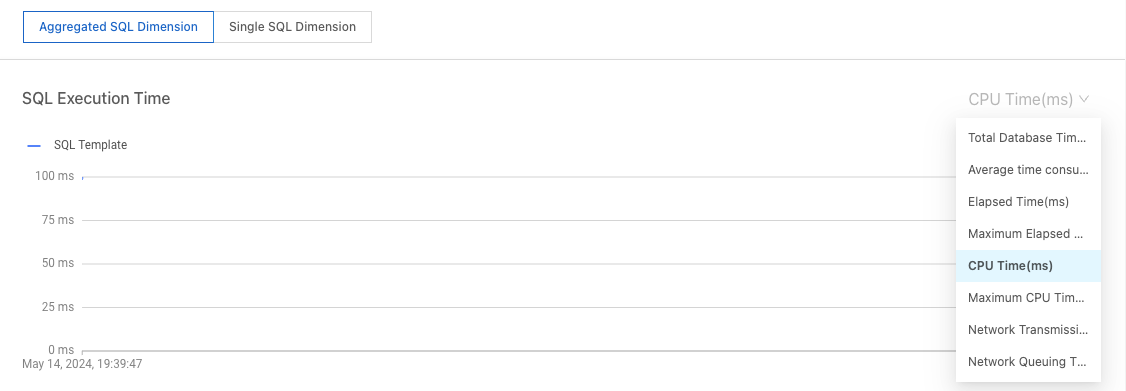
You can view the statistical charts of an aggregated SQL statement in the aggregated SQL dimension or single SQL dimension. In the aggregated SQL dimension, the SQL Execution Time - CPU Time chart and the Total Executions chart are displayed by default.
The aggregated SQL dimension collects the overall data of associated SQL statements.
SQL Execution Time: You can select Total Database Time, Average Time Consumption, Elapsed Time, etc. from the drop-down list to view the statistics.

Total Executions: You can click Total Executions and select the target data from the drop-down list.

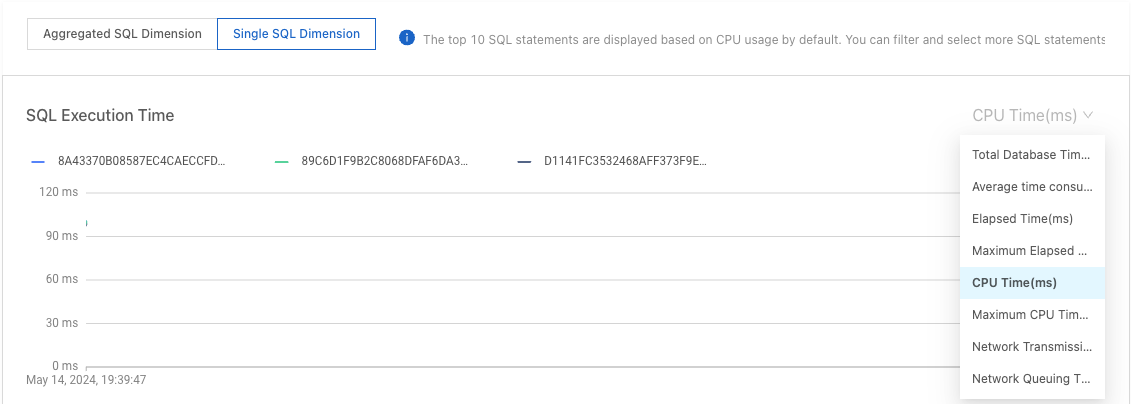
In the single SQL dimension, the top 10 SQL statements sorted by CPU utilization are displayed by default. You can filter and select more SQL statements.
SQL Execution Time: You can select Total Database Time, Average time consumption, Elapsed Time, etc. from the drop-down list to view the statistics. You can also search for SQL statements by SQL ID and view the information about a specific SQL statement.

Total Executions: You can click Total Executions and select the target data from the drop-down list. You can also search for SQL statements by SQL ID and view the information about a specific SQL statement.

Table information
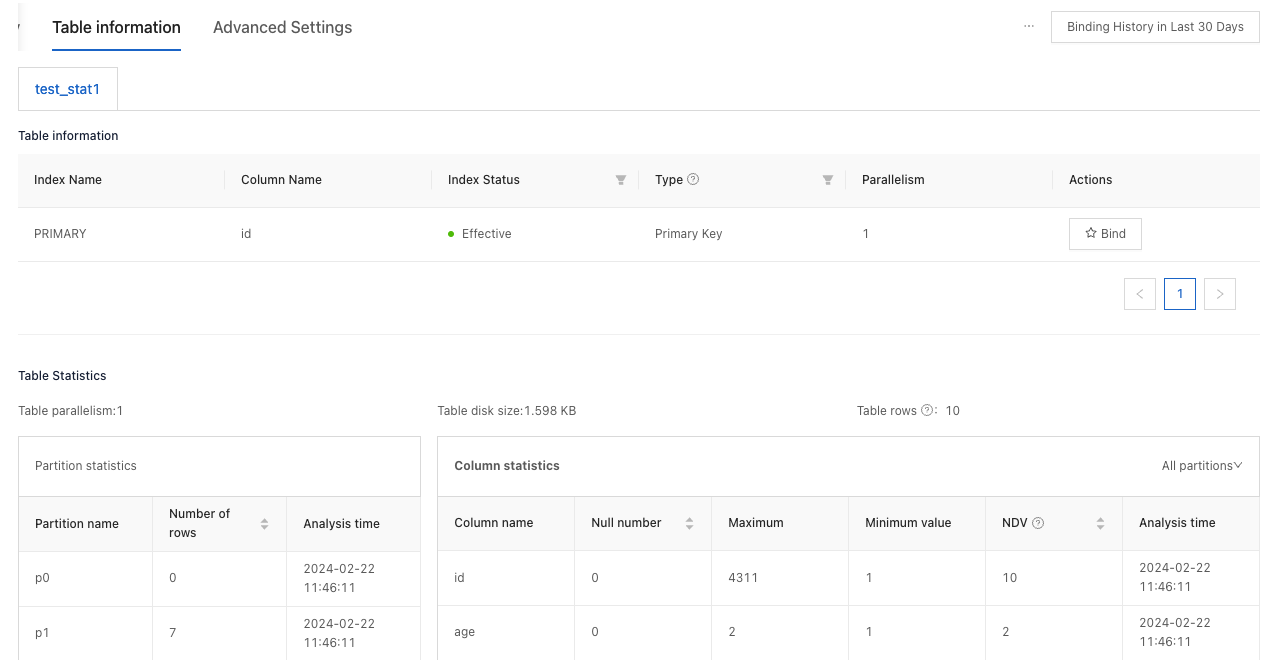
On the Table Information tab, you can view and bind indexes. If an index is bound to an SQL statement, Bound is displayed. You can also view table statistics on this tab.

Advanced settings
Throttling setting
In the Throttling Setting section, click Set Throttling.
Enter the Maximum Concurrent Requests and click OK.
In the pop-up dialog box, click OK.

Keyword throttling setting
In the Keyword Throttling Settings section, click Set Keyword Throttling.
In the refreshed page, click Set below Throttling Keywords.
In the Set Throttling Keywords pop-up window, enter the throttling keywords in the input box and then click OK.
NoteYou do not need to set all keywords; only set those as needed. When inputting values that are strings with spaces, enclose the strings in double quotes or single quotes.
Set the Maximum Concurrency of Keywords and click OK.
NoteThe maximum concurrency of keywords takes effect independently.
In the pop-up dialog box, click OK.
Outline setting
In the Outline Setting section, click Set Outline.
Enter the Outline and click OK.
In the pop-up dialog box, click OK.