With the capacity diagnostics feature, you can obtain the resource usage and trends of clusters, tenants, databases, tables, and indexes in real time, and quickly identify potential capacity risks. This enables you to take timely actions such as capacity expansion to ensure stable system operation.
Procedure
Log on to the ApsaraDB for OceanBase console.
In the left-side navigation pane, choose Autonomy Service > Diagnostics Center.
In the Instance Details section, click the name of the target instance.
The system automatically redirects to the diagnostics center.
In the left-side navigation pane, click Capacity Diagnostics.
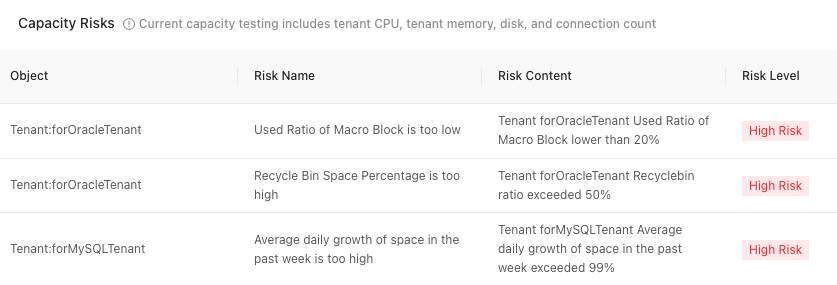
On the Capacity Center page, view the capacity risks of the cluster.

In the Capacity Usage Overview section, view the usage of CPU, memory, storage, and log disk.
NoteCurrently, only ApsaraDB for OceanBase V4.x supports displaying the log disk usage.

Click View Capacity Forecast. In the dialog box that appears on the right, you can view the current disk usage and the estimated remaining days of use.
Click View Usage Trends. In the dialog box that appears on the right, view the disk usage in the last 5 minutes, half an hour, 1 hour, 6 hours, or a custom time period.
In the Tenant Usage Details section, view the capacity usage details of tenants within the last seven days, including the CPU usage, memory usage, storage usage, and number of connections. Risk metrics will be marked in red. If the Recycle Bin Space Percentage exceeds 30%, you can click Go to Recycle Bin, which will take you to the tenant's recycle bin page for recycle bin space management.

In the Tenant section, view the capacity of tenants.
After you select a tenant, you can filter the data of the tenant by database or data table.
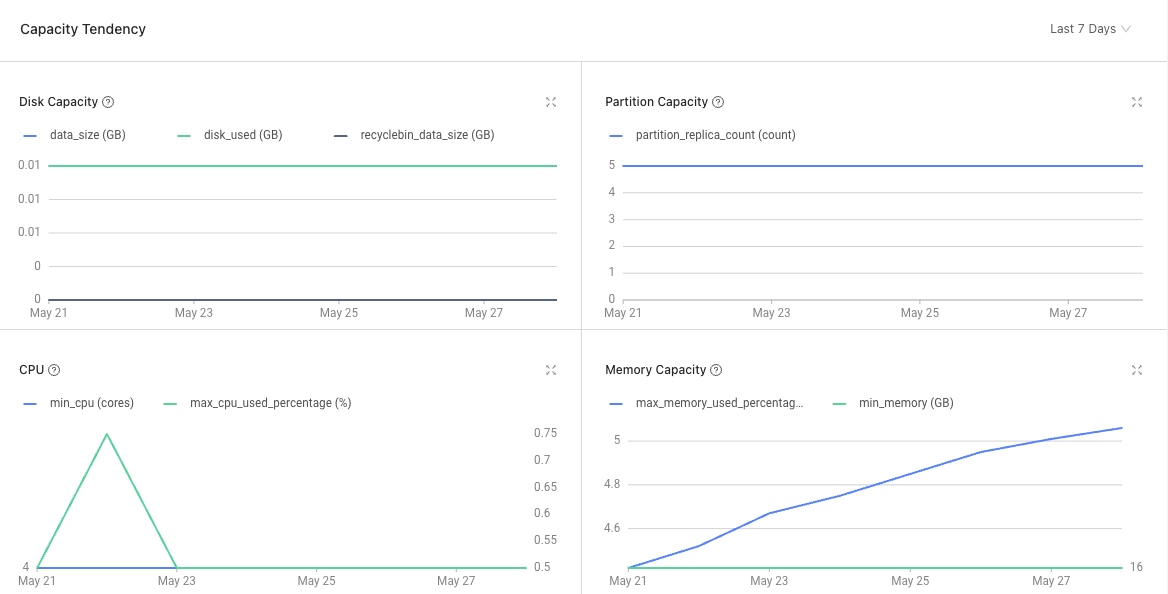
 You can view the trends of CPU usage, memory usage, disk usage, and number of partition replicas over time. You can view the status of a specified tenant, database, or data table within the last 7 days, 14 days, 30 days, or a custom time period.
You can view the top 10 databases with the highest disk usage on the right side. You can click the triangle icon in front of a database to view the sizes of disk space occupied by data and indexes in the database.

Click Details or a database name to view details about the distribution of table data in the database. You can view the information about each table in the following columns: Table Name, Number of Rows, Disk Usage, Data Size, Macro Block Usage Ratio, Number of Partitions, and Auto-increment Column Usage Rate.

View the capacity of the cluster.
If you select All Tenants, you cannot filter the data by database or data table. Instead, you can view the storage usage, number of partition replicas, CPU usage, and memory usage of different tenants in the cluster in charts.
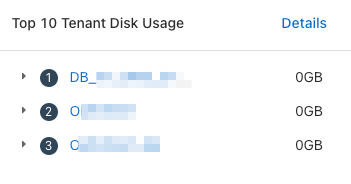
You can view the top 10 tenants with the highest disk usage on the right side. You can click the triangle icon in front of a tenant to view sizes of disk space occupied by data and indexes in the tenant.
Click Details or a tenant name to view details about the distribution of table data in different databases in the tenant. You can view the information about each table in the following columns: Table Name, Number of Rows, Disk Usage, Data Size, Macro Block Usage Ratio, Number of Partitions, and Auto-increment Column Usage Rate.
NoteCurrently, ApsaraDB for OceanBase V4.x does not support obtaining the number of rows in a table.
The minimum granularity for displaying data is 0.01 GB. Data with a size less than 0.01 GB is displayed as 0 GB in size.