Every service in an Alibaba Cloud Service Mesh (ASM) mesh runs an Envoy sidecar proxy that exposes traffic metrics. If you run a self-managed Prometheus instance, you can scrape these metrics directly and visualize them in Grafana -- giving you full control over retention, alerting rules, and dashboard customization without depending on a managed monitoring service.
This guide walks through the configuration using the open source ack-prometheus-operator Helm chart from Container Service for Kubernetes (ACK). If your Prometheus instance was deployed differently, skip the Helm-specific steps and add the scrape configuration directly to your Prometheus config file. For scrape configuration syntax, see prometheus_scrape_config.
How it works
Each Envoy sidecar proxy exposes Istio and Envoy metrics at localhost:15090/stats/prometheus. By adding a Prometheus scrape job that uses Kubernetes service discovery to find pods and filters on the Envoy metrics port, Prometheus automatically collects traffic metrics -- request counts, latencies, and error rates -- from every sidecar in the mesh.
Prerequisites
Before you begin, make sure that you have:
An ACK cluster. For more information, see Create an ACK managed cluster
An ASM instance. For more information, see Create an ASM instance
A Prometheus instance and a Grafana instance deployed in the ACK cluster. For more information, see Use open source Prometheus for monitoring
Add the Envoy scrape configuration
Configure Prometheus to scrape Envoy sidecar metrics from all mesh pods.
Option A: Update ack-prometheus-operator through Helm
Use this option if Prometheus was deployed with the ack-prometheus-operator Helm chart.
Log on to the ACK console. In the left navigation pane, click Clusters.
On the Clusters page, find the cluster and click its name. In the left-side navigation pane, choose Applications > Helm.
On the Helm page, find ack-prometheus-operator and click Update in the Actions column.
In the Update Release panel, locate the
additionalScrapeConfigsfield in the YAML editor.Tip: Press Ctrl+F to search for
additionalScrapeConfigsin the YAML.Replace the
additionalScrapeConfigsvalue with the following scrape configuration, then click OK.
Option B: Edit the Prometheus configuration directly
If Prometheus was not deployed with ack-prometheus-operator, add the following job directly under scrape_configs in your Prometheus configuration file. Omit the additionalScrapeConfigs wrapper -- that key is specific to the Prometheus Operator.
Scrape configuration
additionalScrapeConfigs:
# Scrape config for envoy stats
- job_name: 'envoy-stats'
  metrics_path: /stats/prometheus
  kubernetes_sd_configs:
  - role: pod
  relabel_configs:
  - source_labels: [__meta_kubernetes_pod_container_port_name]
    action: keep
    regex: '.*-envoy-prom'
  - source_labels: [__address__, __meta_kubernetes_pod_annotation_prometheus_io_port]
    action: replace
    regex: ([^:]+)(?::\d+)?;(\d+)
    replacement: $1:15090
    target_label: __address__
  - action: labeldrop
    regex: __meta_kubernetes_pod_label_(.+)
  - source_labels: [__meta_kubernetes_namespace]
    action: replace
    target_label: namespace
  - source_labels: [__meta_kubernetes_pod_name]
    action: replace
    target_label: pod_name
The following table explains each relabel rule:
| Rule | Purpose |
|---|---|
kubernetes_sd_configs: role: pod | Discovers all pods through Kubernetes service discovery |
keep on port name .*-envoy-prom | Filters to only Envoy sidecar containers |
replace on __address__ | Rewrites the target to port 15090, where Envoy exposes metrics |
labeldrop on pod labels | Drops high-cardinality Kubernetes pod labels to reduce storage |
replace on namespace and pod_name | Preserves namespace and pod name as metric labels |
Note: This scrape job collects data plane (Envoy sidecar) metrics only. It does not scrape ASM control plane metrics.
Generate monitoring data
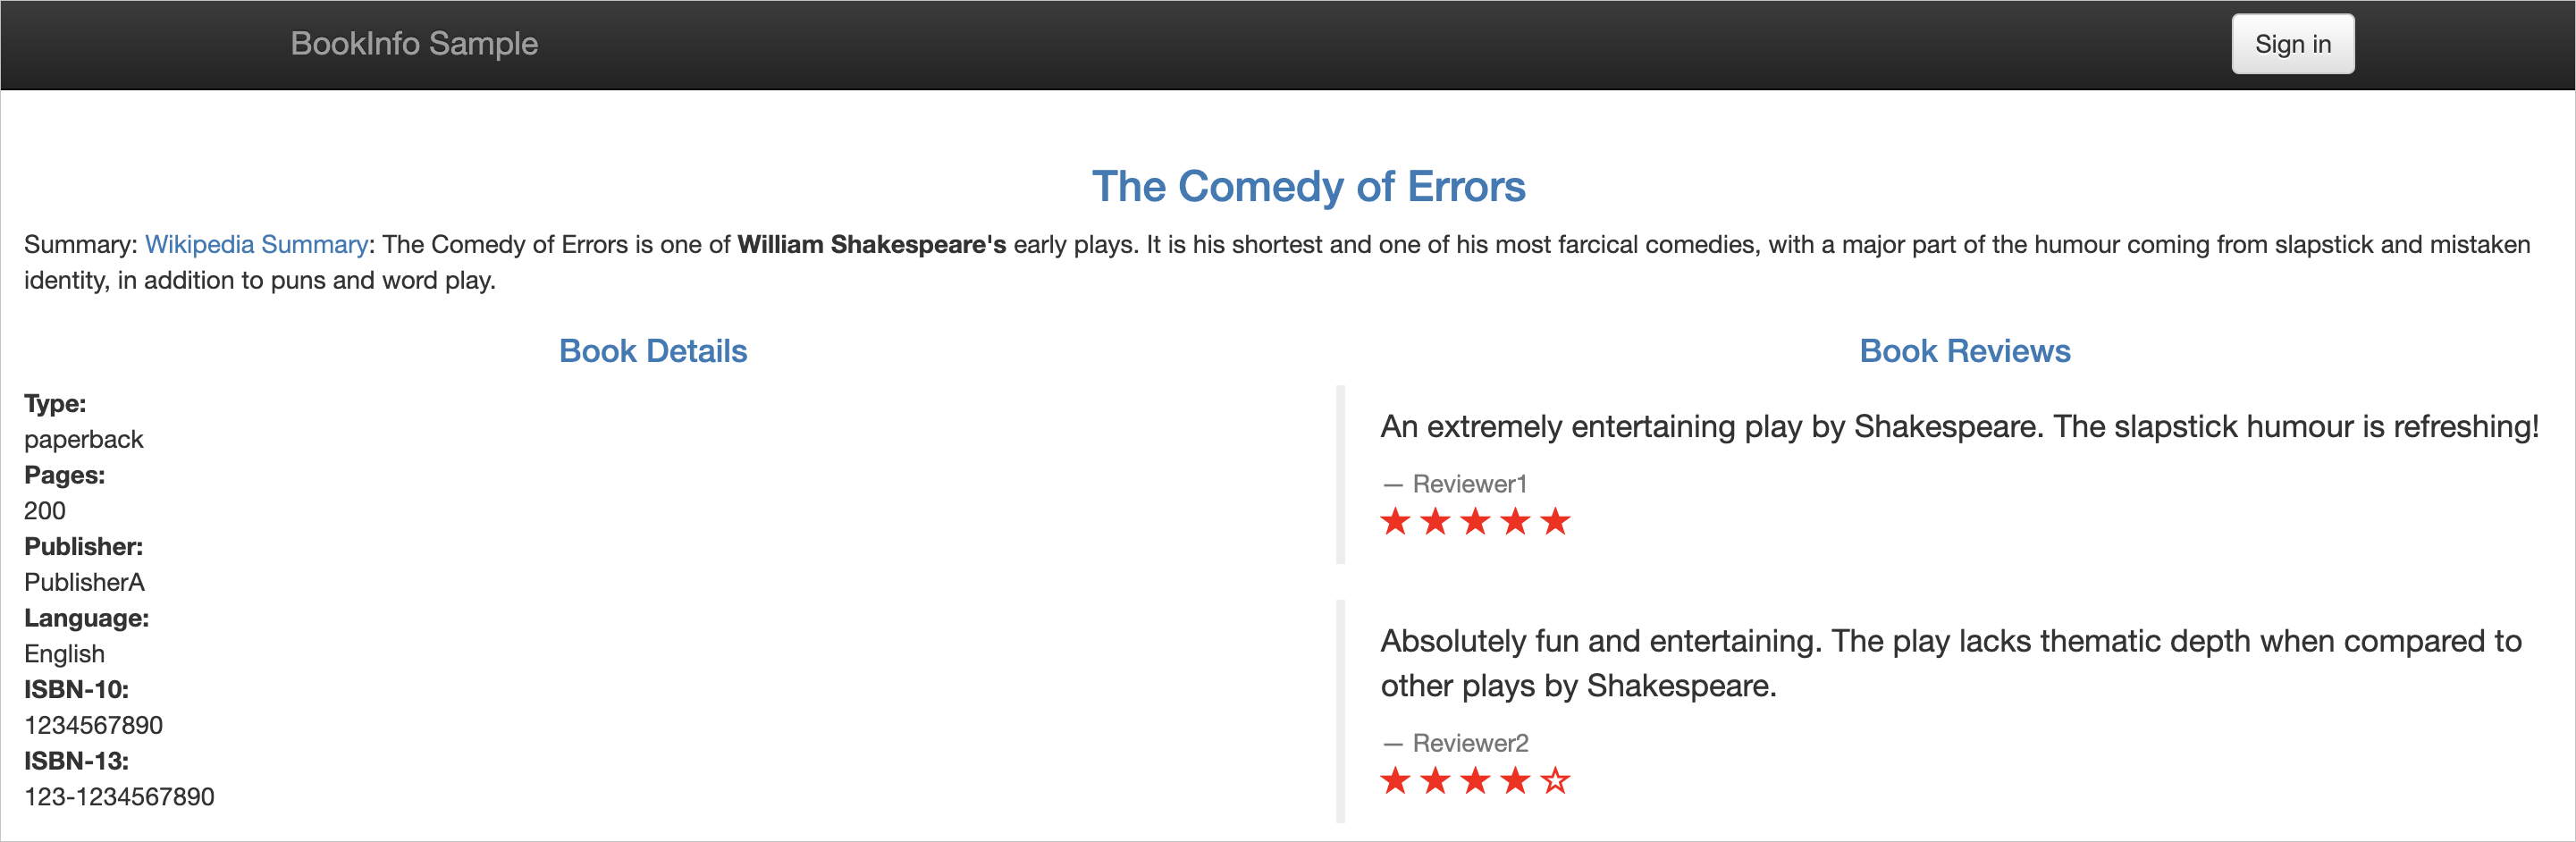
Send traffic to services in the mesh to generate Envoy metrics. This example uses the Bookinfo sample application. For setup instructions, see Getting started.
Open the Productpage page of the Bookinfo application in a browser.
Refresh the page several times to generate request traffic.
Verify metrics collection
After generating traffic, verify that Envoy sidecar metrics reach Prometheus.
Check Envoy proxy metrics
Run the following commands to query a sidecar directly and verify that it exposes Istio metrics:
details=$(kubectl get pod -l app=details -o jsonpath={.items..metadata.name})
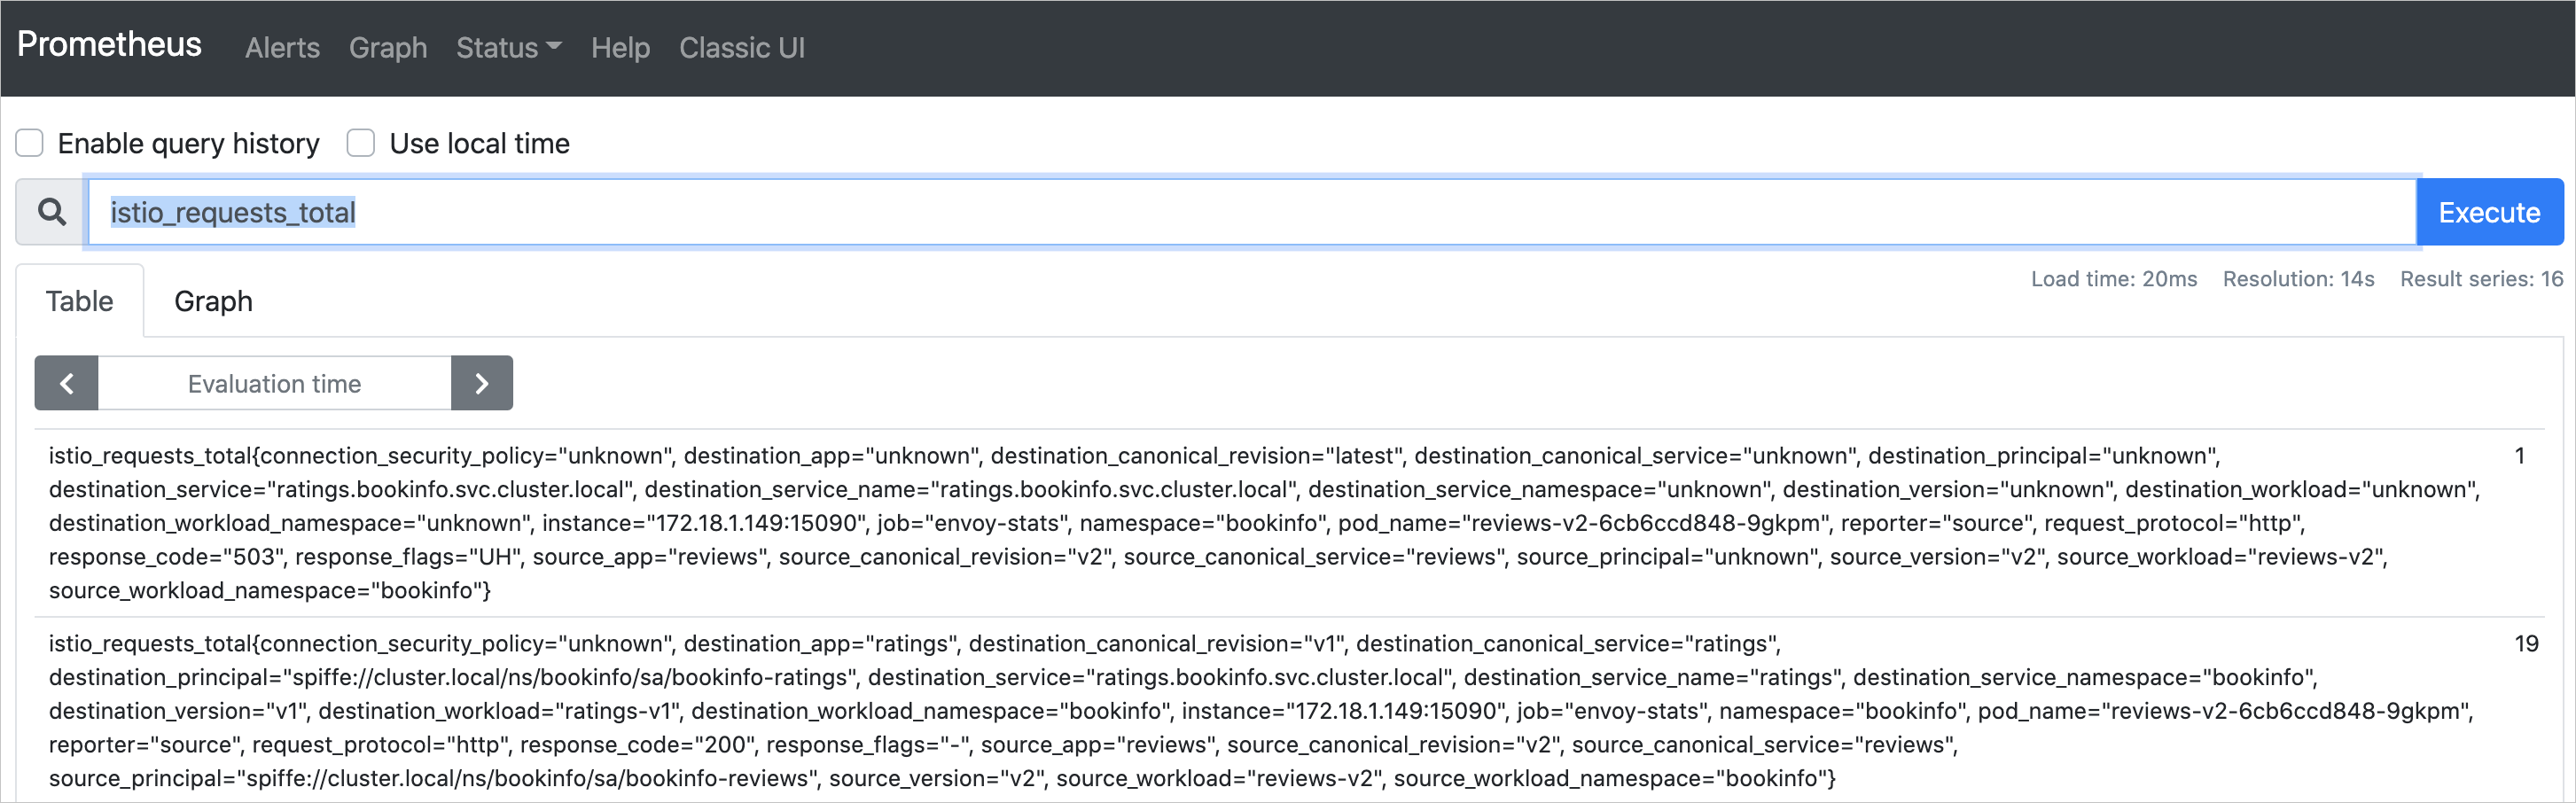
kubectl exec $details -c istio-proxy -- curl -s localhost:15090/stats/prometheus | grep istioIf the output contains metric lines such as istio_requests_total, the Envoy proxy is collecting metrics correctly. An empty output means the proxy is not exposing metrics -- check that sidecar injection is working and that the application has received traffic.
Query metrics in Prometheus
Log on to the ACK console. In the left navigation pane, click Clusters.
On the Clusters page, find the cluster and click its name. In the left navigation pane, choose Network > Services.
On the Services page, find the Prometheus service and click its IP address in the External IP column.
In the Prometheus web UI, enter
istio_requests_totalin the query box and click Execute. If the query returns results, Prometheus is successfully scraping Envoy sidecar metrics.
Visualize metrics in Grafana
Log on to the ACK console. In the left navigation pane, click Clusters.
On the Clusters page, find the cluster and click its name. In the left navigation pane, choose Network > Services.
On the Services page, find the Grafana service and click its IP address in the External IP column.
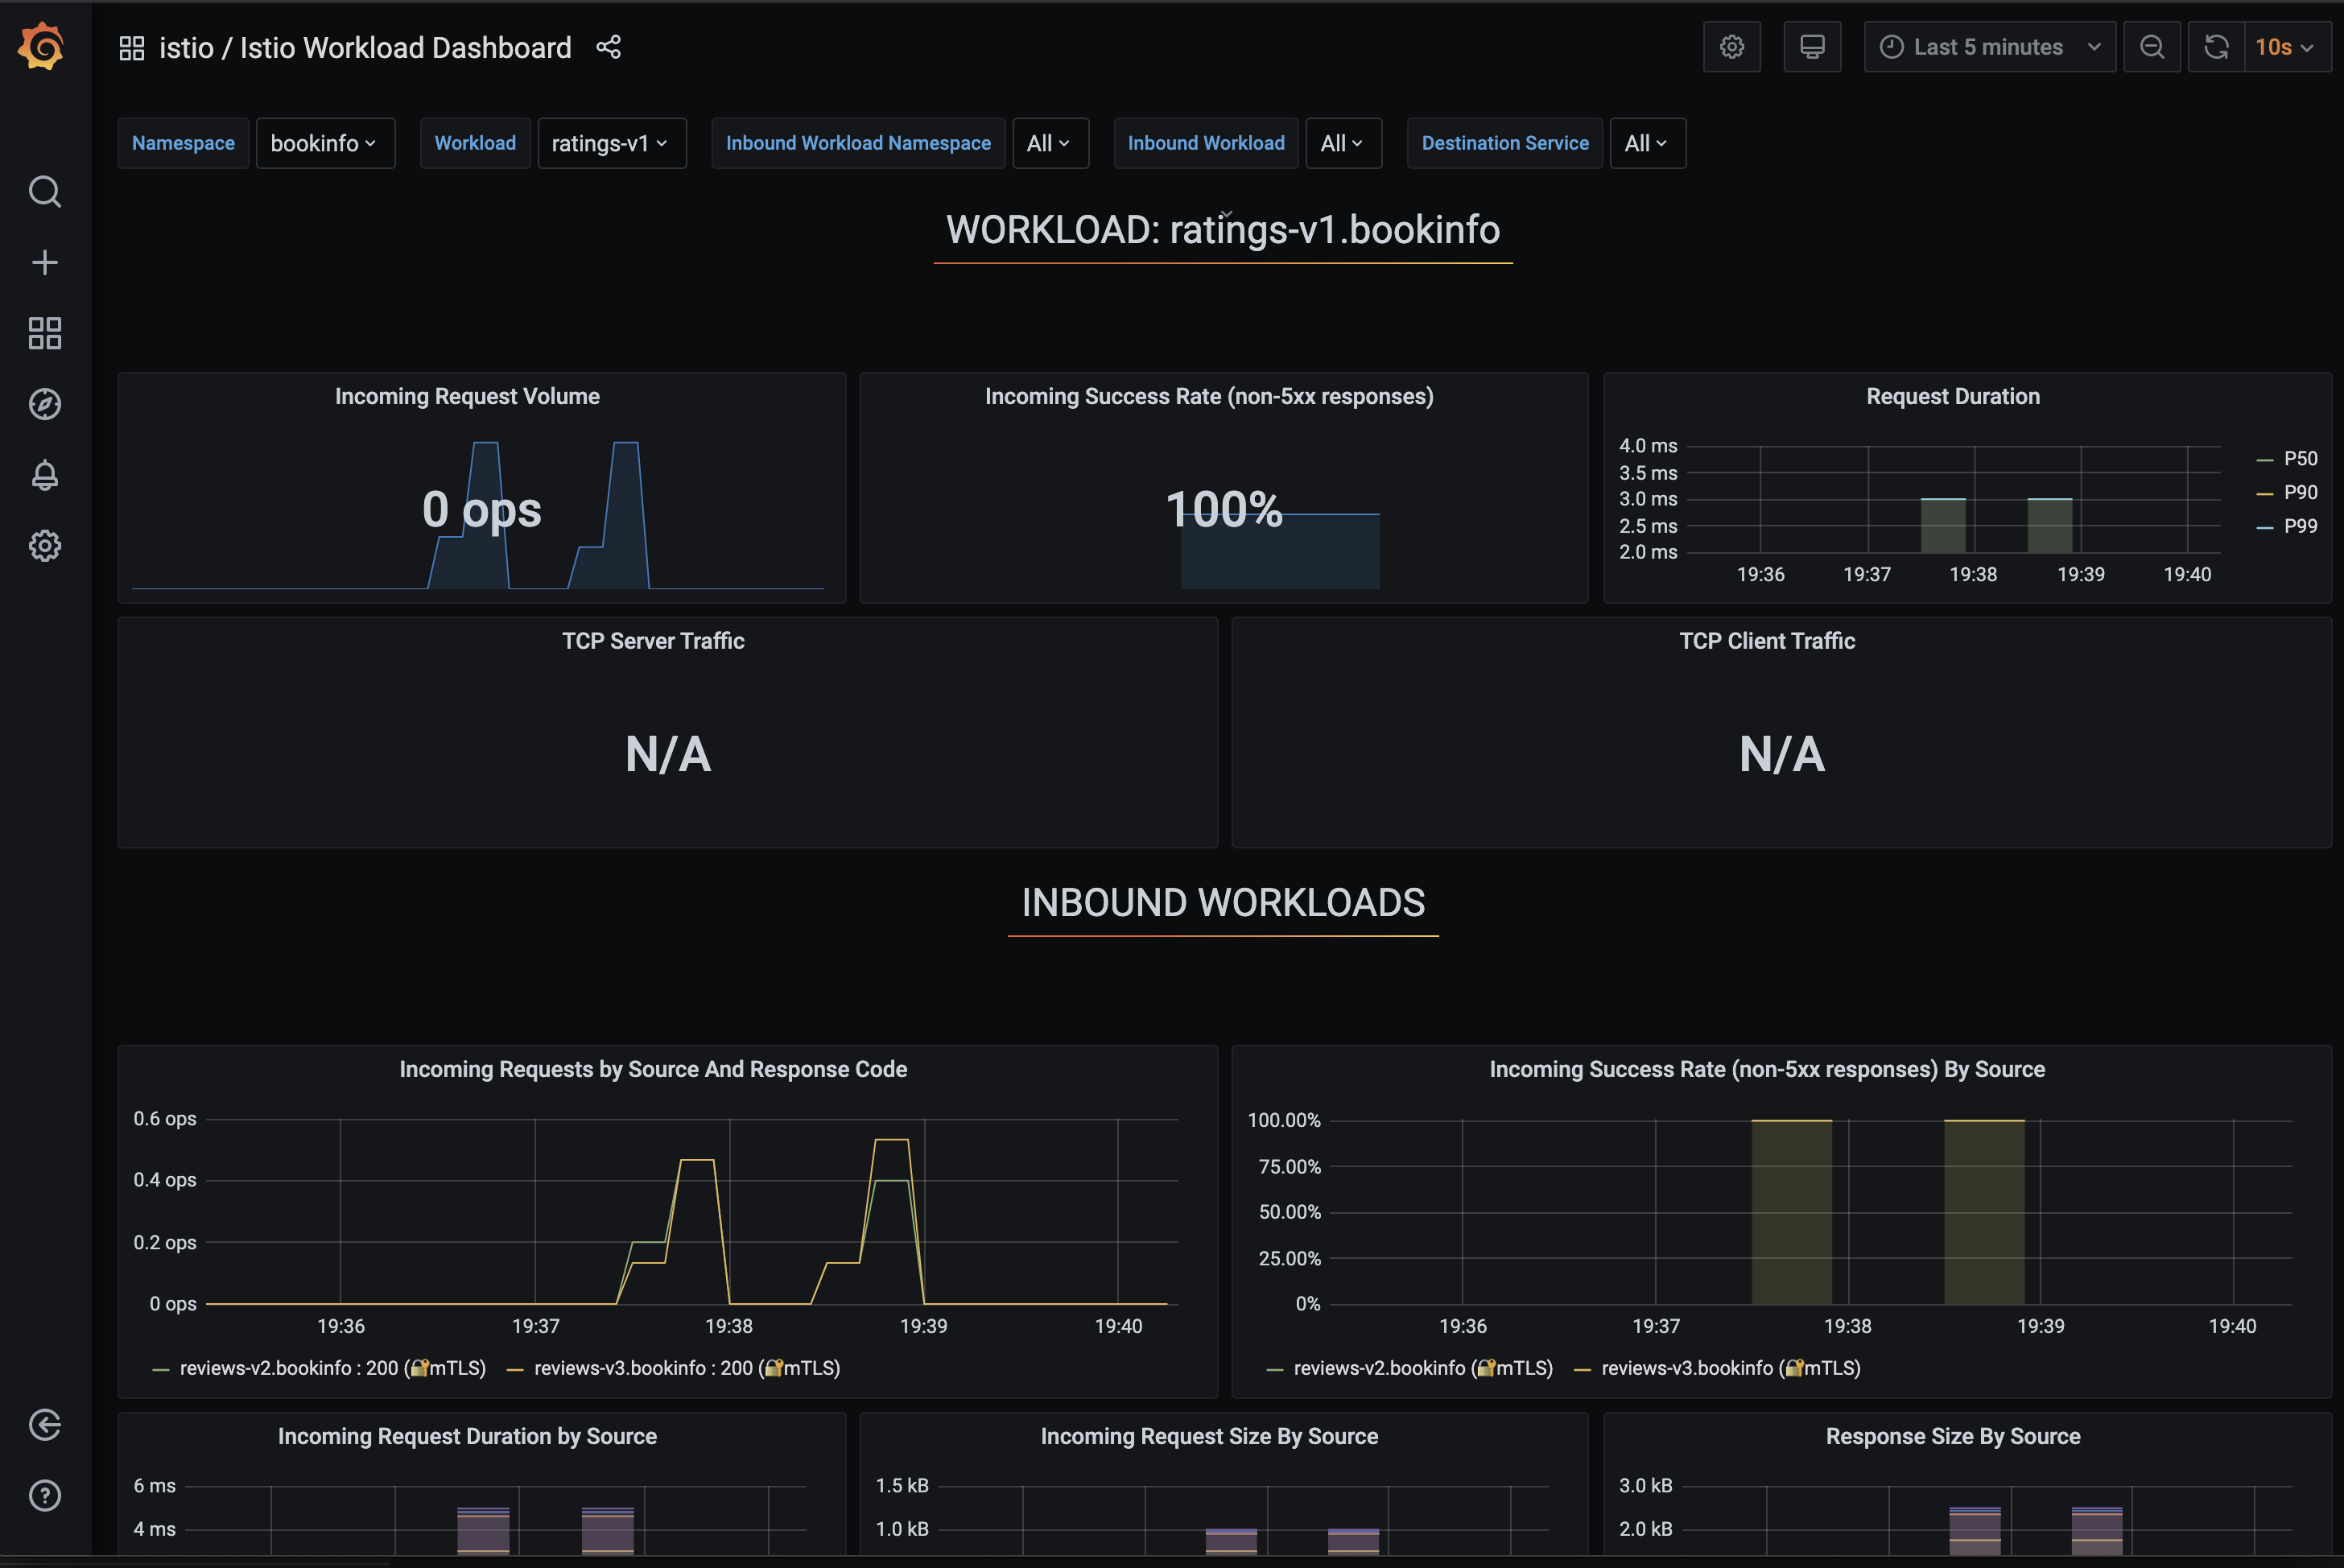
In the Grafana UI, select Istio Workload Dashboard from the dashboard selector in the upper-left corner.
What's next
Getting started with ASM: Deploy the Bookinfo sample application to generate test workload traffic.