Text logs are a basic log type. This topic describes how to use Logtail to collect logs, query and analyze logs, visualize query and analysis results, and configure alerts for exception logs. In the following example, Logtail is used to collect the text logs of an Alibaba Cloud Elastic Compute Service (ECS) instance.
Limit
By default, Logtail only collects incremental logs. If a log file is not updated after a Logtail configuration is delivered and applied to your server, it will not be collected. To collect historical logs, refer to Import historical logs from log files.
Prerequisites
An ECS instance is available.
Simple Log Service is activated.
Background information
In the following example, Logtail is used to collect logs based on the /var/log/nginx/access.log text file on the ECS instance. The text file includes only one sample log.
The following sample code provides the sample log in the /var/log/nginx/access.log text file:
10.0.*.1 - - [20/Mar/2023:12:00:03 +0000] "POST /login HTTP/1.1" 302 0 "http://example.com/login.html" "Mozilla/5.0 (X11; Linux x86_64) AppleWebKit/537.36 (KHTML, like Gecko) Chrome/100.0.4896.88 Safari/537.36" The sample log is used in this topic to describe how to use Simple Log Service. If you want to collect logs from your own log file, you must store the file in a custom directory on the ECS instance.
Solution overview

In this topic, you can learn how to perform the following operations:
Create a project and a logstore. A project is used to manage resources. A logstore is used to store logs.
Install Logtail and create a Logtail configuration to collect logs to the logstore for storage.
Query and analyze the collected logs in the Simple Log Service console.
Convert the query and analysis results to charts on a dashboard.
Configure alert rules to monitor logs and generate alerts for the logs.
Clean up resources that you no longer use to prevent unnecessary fees.
1. Create a project and a logstore
1.1 Create a project
Log on to the Simple Log Service console.
In the Projects section, click Create Project. In the Create Project panel, select the region to which the ECS instance belongs from the Region drop-down list and configure the Project Name parameter. Retain the default values for other parameters. The region that you select must be the same as the region where the ECS instance resides.

1.2 Create a logstore
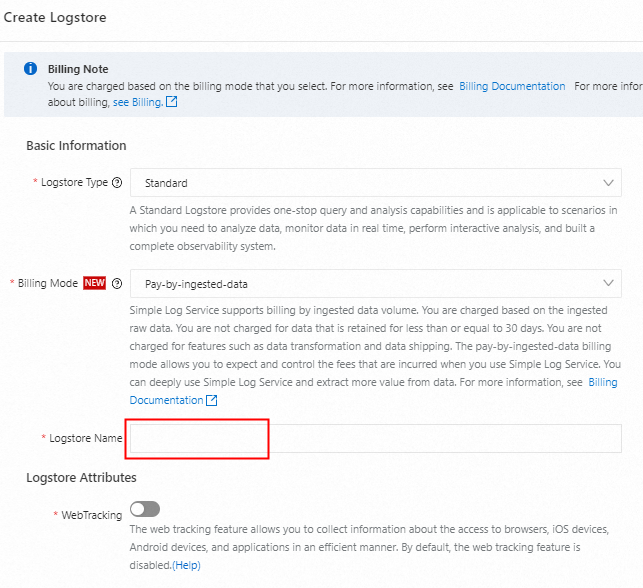
After creating the project, you are prompted to create a logstore. In the Create Logstore panel, configure the Logstore Name parameter. Retain the default values for other parameters. Then click OK.

2. Configure Logtail configuration-related settings
You can create a Logtail configuration to install Logtail on the ECS instance and use Logtail to collect logs. Logs are collected to the created logstore in Simple Log Service.
2.1 Select a log collection method
In the Created dialog box, click Data Collection Wizard.

On the Self-managed Open Source/Commercial Software tab of the Quick Data Import dialog box, find Single Line - Text Logs and click Integrate Now.

2.2 Create a machine group
In the Machine Group Configurations step of the Import Data wizard, set Scenario to Servers and Installation Environment to ECS. Then, click Create Machine Group. In the Create Machine Group panel, select the ECS instance that are in the same region as your Simple Log Service project and click Install and Create Machine Group.
 Note
NoteYour ECS instance must be in the same region as your Simple Log Service project. If your ECS instance is in a different region or if you are using a self-managed server, you can collect logs by following the instructions provided in Manually install Logtail to collect text logs from servers.
If Success is displayed in the Logtail Installation Status column, Logtail is installed on the ECS instance. If the installation fails, click Recreate Installation Task. Reselect the ECS instance that resides in the same region as your Simple Log Service project and install Logtail again.

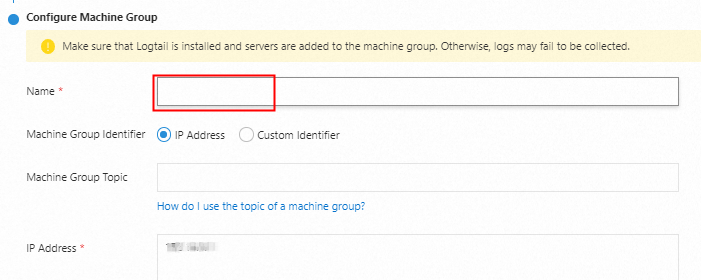
After Logtail is installed, configure the Name parameter and click OK. You do not need to configure the IP Address parameter because the system automatically assigns an IP address.

Check the heartbeat status of the machine group. Approximately 2 minutes are required to create a machine group. If the machine group is not created, the heartbeat status of the machine group is FAIL. After 2 minutes, click Automatic Retry to refresh the heartbeat status of the machine group until the heartbeat status changes to OK. For more information about how to troubleshoot the issue that the heartbeat status of a machine group is FAIL, see How do I troubleshoot an error that is related to a Logtail machine group in a host environment?

2.3 Create a Logtail configuration
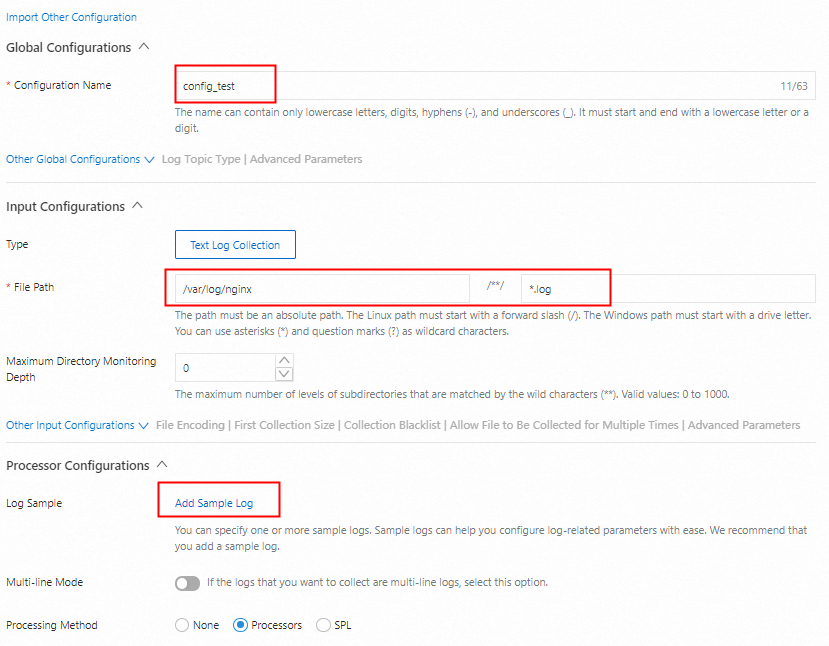
Create a Logtail configuration based on the following figure. Configure the Configuration Name parameter, set the File Path parameter to /var/log/nginx/**/*.log, and then add the sample log that is provided in the Background information section of this topic. Then click Next.
By default, one log file can match only one Logtail configuration for collection. If you want to use multiple Logtail configurations to collect logs from the same log file path, see How do I collect multiple copies of logs in a file?.
2.4 Configure the settings for data query and analysis
Approximately 1 minute is required to create a Logtail configuration. If you can preview data after Automatic Refresh is complete, the Logtail configuration is created. Then click Next. The Logtail configuration-related settings are complete. Then, Logtail collects single-line logs to Simple Log Service in simple mode based on the Logtail configuration. You can also parse the collected logs in other modes. For more information, see Create a Logtail configuration.
3. Query and analyze logs
In the End step of the Import Data wizard, click Query Log. Then, you are navigated to the query and analysis page of the created logstore. An error message may appear because indexes are not created. After you close the error message page and wait for 1 minute, you can view the logs that are collected from the /var/log/nginx/access.log file.
In the search box, enter an arbitrary character, such as HTTP, specify a query time range, and then click Search & Analyze. You can obtain the logs that contain the arbitrary character. You can add multiple logs to the /var/log/nginx/access.log text file to query logs. The following figure shows the query and analysis results that are obtained after you repeatedly add the sample log provided in the "Background information" section of this topic to the /var/log/nginx/access.log text file. You can use indexes and statement syntax to query and analyze logs. For more information about how to effectively use the query and analysis features, see Index-based query and analysis.
4. Visualize data on a dashboard
In the left-side navigation pane, choose Dashboard > Dashboards and click Add Dashboard.

In the Add to New Dashboard dialog box, select a layout mode for the dashboard. By default, the Layout Mode parameter is set to Grid Layout. Configure the Dashboard Name parameter. Then, click OK.

On the dashboard, click Add Chart.

On the Search & Analysis tab in the lower-left corner of the Edit Chart page, select Logstore(SQL) from the drop-down list, select the logstore that you want to manage from the drop-down list, and then enter
select count(*) as pvin the search box to query the number of logs and rename the count field to pv. In this example, click Single Value Chart Pro in the Chart Types section on the right side of the Edit Chart page. Then, click Apply in the upper part of the Edit Chart page to view the configuration effects. The following figure shows the configuration results of the chart. If the data visualization results meet your expectations, click OK in the upper-right corner of the Edit Chart page. Then, click Save in the upper-right corner of the dashboard page. You can create multiple types of charts on a dashboard. You can filter data on a dashboard and connect a dashboard to external visualization tools. For more information, see Overview of visualization.
5. Monitor and configure alerts for logs
In the left-side navigation pane, click Alerts. On the Alert Rules tab of the Alert Center page, click Create Alert.

In the Create Alert panel, click Create in the Query Statistics section to configure the query rule settings.

Select the created logstore from the Logstore drop-down list, replace the
*|SELECT *default statement in the Query field with*, and then click Preview based on the following figure. The logs that you want to query are displayed. Click Confirm to save the settings. The settings are used to query the logs of the created logstore that are generated within the previous 15 minutes.NoteThe
*statement is used to query all logs. The*|SELECT *statement is used to query and analyze all logs. Before you can analyze logs, you must configure indexes for log fields and turn on Enable Analytics for the fields. In this example, no field indexes are created. To analyze logs, see Create indexes.
Click OK to the save the alert rule. The alert rule is created to query all logs that are generated every 15 minutes. If the number of logs is greater than 1, an alert whose severity is Medium is triggered.

Click the created alert rule. The Alert History section displays information about the alerts triggered by the alert rule. The number of logs displayed on a dashboard is 5, which matches the trigger condition in the created alert rule. However, no alerts are triggered. After you add the sample log provided in the "Background information" section of this topic to the
/var/log/nginx/access.logtext log twice, the number of logs displayed on the dashboard is 7 and an alert is triggered. The Check Frequency parameter is set to Fixed Interval 15 Minutes and the Time Range parameter on the Advanced Settings tab in the Query Statistics dialog box is set to 15 Minutes(Relative). In this case, an alert is triggered only if the number of incremental logs meets the trigger condition. To resolve the issue, you can modify the query time range specified by the Check Frequency or Time Range parameter. For more information about the alerting feature, see Alerting and Configure an alert rule in Simple Log Service.
6. Delete the project and the logstore
After you perform the preceding operations, you can use Simple Log Service in actual business scenarios. You can delete or retain the created resources based on your business requirements. However, if you retain the resources, you are charged for the resources. If a logstore exists, you are charged for active shards regardless of whether the logstore is used. If you no longer use the created resources, you can manually delete the resources. For more information about the billing, see Billing overview.
In the project page, find the logstore that you want to delete, delete the Logtail configurations in the logstore, and then delete the logstore.

Alternatively, find the project that you want to delete in the project list and click Delete in the Actions column to delete all resources of the project.

Extension scenarios
Collect other types of logs.
Collect text logs from an ACK cluster in DaemonSet mode and Collect standard output from an Alibaba Cloud ACK cluster - old version (deploy Logtail in DaemonSet mode)
Collect text logs from a self-managed cluster in DaemonSet mode and Collect stdout and stderr from a self-managed cluster in DaemonSet mode (old version)
After you become familiar with Simple Log Service features, you can configure triggers to trigger function execution based on logs and function compute. For more information, see Configure event triggers for Alibaba Cloud services and Simple Log Service triggers.
What to do next
Create a dashboard to view real-time data analysis results.
Use the data transformation feature to transform, cleanse, and filter log data.
FAQs
Why is the display time in Simple Log Service inconsistent with the original log time after collecting logs?
The display time in Simple Log Service may be inconsistent with the original log time after collecting logs because the service generates its own timestamps by default. To ensure that the time in Simple Log Service matches the original log time, you need to configure the Time parsing plug-in.
Am I charged if I only create projects and logstores?
By default, shard resources are reserved when you create a logstore. You are charged for active shards. For more information, see Why am I charged for active shards?
What do I do if logs fail to be collected?
When you use Logtail to collect logs, logs may fail to be collected due to Logtail heartbeat failures, collection errors, or invalid Logtail configurations. For more information, see What do I do if errors occur when I use Logtail to collect logs?
What do I do if I can query logs but cannot analyze logs on the query and analysis page of a logstore?
If you want to analyze logs, you must configure indexes for log fields and turn on Enable Analytics for the fields. For more information, see Create indexes.
How do I deactivate Simple Log Service and stop billing?
After Simple Log Service is activated, you cannot deactivate it. If you no longer require Simple Log Service, you can delete all projects. For more information, see Stop billing.