This topic describes common issues and solutions you may encounter when using the node auto scaling feature.
Index
Category | Subcategory | Link |
Scaling behavior of node auto scaling | ||
Does cluster-autoscaler support CustomResourceDefinitions (CRDs)? | ||
Custom scaling behavior | ||
The cluster-autoscaler add-on related | ||
Known limitations
Inability to perfectly predict available node resources
The available resources on a newly provisioned node may not precisely match the instance type's specifications. This is because the underlying OS and system daemons on the Elastic Compute Service (ECS) instance consume resources. For details, see Why is the memory size different from the instance type specification after I purchase an instance?
Due to this overhead, the resource estimates used by cluster-autoscaler may be slightly higher than the actual allocatable resources on a new node. While this discrepancy is usually small, it's important to be aware of the following when configuring your pod resource requests:
Request less than the full instance capacity. The total requested resources, including CPU, memory, and disk, must be less than the instance type specifications. As a general guideline, we recommend that a pod's total resource requests do not exceed 70% of the node's capacity.
Account for non-Kubernetes or static pods. When determining if a node has sufficient resources, cluster-autoscaler only considers the resource requests of Kubernetes pods (including pending pods and DaemonSet pods). If you run static pods that are not managed as DaemonSets, you must manually account for and reserve resources for them.
Test large pods in advance. If a pod requests a large amount of resources, for example, more than 70% of a node's resources, you must test and confirm in advance that the pod can be scheduled to a node of the same instance type.
Limited scheduling policies
The cluster-autoscaler add-on supports only a limited set of scheduling policies to determine whether an unschedulable pod can be scheduled to a node pool where Auto Scaling is enabled. For details, see What scheduling policies does cluster-autoscaler use to determine whether an unschedulable pod can be scheduled to a node pool where auto scaling is enabled?
Only the resource type policies are supported
When using ResourcePolicy to customize the priority of elastic resources, only policies of the resource type are supported. For details, see Customize elastic resource priority scheduling.
apiVersion: scheduling.alibabacloud.com/v1alpha1
kind: ResourcePolicy
metadata:
  name: nginx
  namespace: default
spec:
  selector:
    app: nginx
  units:
  - resource: ecs
  - resource: eci
Scale out a specific instance type in multi-type node pools is not supported
If your node pool is configured with multiple instance types, you cannot direct the cluster-autoscaler to provision a specific instance type during a scale-out operation.
Instead, the cluster-autoscaler models the capacity of the entire node pool based on the smallest available instance type (i.e., the one with the least amount of resources like CPU and memory). For details on this calculation, see If a scaling group is configured with multiple instance types, how does the autoscaler calculate the group's capacity for scaling decisions?
Pods with zone-specific constraints may fail to trigger scale-outs in multi-zone node pools
If your node pool spans multiple availability zones, a pod with a dependency on a specific zone may not trigger a scale-out. This can occur if the pod requires a specific zone due to:
A persistent volume claim (PVC) that is bound to a volume located in that specific zone.
A
nodeSelector,nodeAffinity, or other scheduling rule that targets the zone.
In these cases, the cluster-autoscaler might fail to provision a new node in the required availability zone. For more such cases, see Why does the node auto scaling add-on fail to create nodes?
Storage constraints
The autoscaler is not aware of specific storage constraints that a pod may have. This includes requirements such as:
Needing to run in a specific Availability Zone to access a persistent volume (PV).
Requiring a node that supports a specific disk type (such as ESSD).
Solution: Configure a dedicated node pool
If your application has such storage dependencies, configure a dedicated node pool for it before enabling Auto Scaling on that pool.
By presetting the Availability Zone, instance type, and disk type in the node pool's configuration, you ensure that any newly provisioned nodes will meet the pod's storage mounting requirements. This prevents scheduling failures and pod startup errors caused by resource mismatches.
Additionally, ensure that your pods do not reference a PVC that is stuck in a Terminating state. A pod that cannot schedule because its PVC is terminating will continuously fail to schedule. This can mislead the cluster-autoscaler into making incorrect scaling decisions, such as attempting to evict the pod or scaling the cluster unnecessarily.
Scale-out behavior
What scheduling policies does cluster-autoscaler use to determine whether an unschedulable pod can be scheduled to a node pool where auto scaling is enabled?
The cluster-autoscaler uses the following scheduling policies to make this determination:
PodFitsResources
GeneralPredicates
PodToleratesNodeTaints
MaxGCEPDVolumeCount
NoDiskConflict
CheckNodeCondition
CheckNodeDiskPressure
CheckNodeMemoryPressure
CheckNodePIDPressure
CheckVolumeBinding
MaxAzureDiskVolumeCount
MaxEBSVolumeCount
ready
NoVolumeZoneConflict
What resources can cluster-autoscaler simulate during its scheduling analysis?
The cluster-autoscaler supports the simulation and evaluation of the following resource types:
cpu
memory
sigma/eni
ephemeral-storage
aliyun.com/gpu-mem (shared GPUs only)
nvidia.com/gpu
If you need to scale based on other resource types, see How do I configure custom resources for a node pool with Auto Scaling enabled?
Why does the node auto scaling add-on fail to create nodes?
This issue can be caused by several common scenarios. Review the following possibilities to diagnose the problem:
The node pool is not configured with Auto Scaling
Node auto scaling works only for node pools with Auto Scaling configured. Ensure that the cluster-level auto scaling feature is enabled and the scaling mode for the node pool is set to Auto. For details, see Enable node auto scaling.
Pod resource requests exceed the allocatable capacity of available instance types
The instance types in the scaling group cannot meet the pod's resource requests. The advertised specifications of an ECS instance represent its total capacity. However, a portion of these resources is always reserved by ACK to ensure the stable operation of the OS kernel, system services, and essential Kubernetes daemons (such as the kubelet, kube-proxy, Terway, and the container runtime).
This reservation creates a critical difference between the node's total capacity and its allocatable resources—the amount of CPU, memory, and storage that is actually available for pods.
The standard cluster-autoscaler makes its scaling decisions using the resource reservation policy from Kubernetes versions 1.28 and earlier.
To use the more accurate reservation policy from newer Kubernetes versions, we recommend switching to node instant scaling, which has the new algorithm built-in. Alternatively, you can manually define custom resources reservations in your node pool configuration.
For details about resources consumed by the system, see Why does a purchased instance have a memory size that is different from the memory size defined in the instance type?
For details about resources consumed by add-ons, see Resource reservation policy.
By default, system add-ons are installed on nodes. The resources requested by a pod must be less than the instance specifications.
A pod's zone-specific constraints are preventing scale-out
If a pod has a scheduling dependency on a specific availability zone (such as due to a PVC that is bound to a zonal volume, or a node affinity rule), the cluster-autoscaler may not be able to provision a new node in that specific zone, especially within a multi-zone node pool.
The required permissions have not been granted
The cluster-autoscaler requires specific permissions to manage cluster resources. These permissions are cluster-scoped and must be granted on a per-cluster basis.
Ensure you have completed all the authorization steps as described in the Enable node auto scaling for the cluster.
The autoscaler has been temporarily paused due to unhealthy nodes
The autoscaler includes a safety mechanism (dampening) to prevent repeated failures. If it provisions nodes that subsequently fail to join the cluster or remain in a
NotReadystate for an extended period, it will temporarily pause further scaling operations.Resolve the issues with the unhealthy nodes. Scaling will resume automatically once the condition is cleared.
The cluster has zero worker nodes
The cluster-autoscaler itself runs as a pod within the cluster. If there are no worker nodes, the autoscaler pod cannot run and therefore cannot provision new nodes.
Configure your node pools with a minimum of two nodes to ensure high availability for core cluster add-ons. If your use case requires scaling out from zero nodes or scaling down to zero nodes, use the node instant scaling feature.
If a scaling group is configured with multiple instance types, how does the autoscaler calculate the group's capacity for scaling decisions?
For a scaling group configured with multiple instance types, the cluster-autoscaler models the capacity of the entire group based on the minimum value for each resource dimension (such as CPU and memory) found across all configured instance types.
For example, consider a scaling group configured with two instance types:
Instance type A: 4 vCPU, 32 GiB memory
Instance type B: 8 vCPU, 16 GiB memory
To determine the baseline for this group, the autoscaler calculates the minimums for each resource:
Minimum CPU: min(4, 8) = 4 vCPU
Minimum memory: min(32, 16) = 16 GiB
As a result, the autoscaler will treat this entire scaling group as if it can only provision nodes with 4 vCPU and 16 GiB of memory.
Therefore, if a pending pod requests more than 4 vCPU or more than 16 GiB of memory, the autoscaler will not trigger a scale-out for this group, even though one of the instance types (8 vCPU, 16 GiB) could theoretically satisfy the CPU request.
If you are using a multi-instance-type configuration and also need to account for resource reservations, see Why does the node auto scaling add-on fail to create nodes?
If multiple node pools with Auto Scaling enabled are available, how does the cluster-autoscaler choose which one to scale out?
When a pod is unschedulable, the cluster-autoscaler runs a simulation to determine which, if any, of the auto scaled node pools could accommodate the pod. This simulation evaluates each node pool based on its configuration, including labels, taints, and available instance types.
A node pool is considered a candidate for scale-out if the simulation shows that a new node from that pool would allow the pod to be scheduled.
If multiple node pools meet this condition, the node auto scaling defaults to the least-waste expansion strategy. This strategy selects the node pool that would have the least amount of unused resources (CPU and memory) left over after the new pod is scheduled.
How do I configure custom resources for a node pool with Auto Scaling enabled?
Configure ECS tags with a specific prefix for a node pool with Auto Scaling enabled. This allows the cluster-autoscaler to identify the custom resources available in the node pool or the exact values of specified resources.
k8s.io/cluster-autoscaler/node-template/resource/{resource_name}:{resource_size}Example:
k8s.io/cluster-autoscaler/node-template/resource/hugepages-1Gi:2GiWhy am I unable to enable Auto Scaling for a node pool?
Enabling Auto Scaling for a node pool may fail for one of the following reasons:
It is the default node pool
The node auto scaling feature cannot be enabled on the cluster's default node pool.
The node pool contains manually added nodes
Auto Scaling cannot be enabled on a node pool that already contains manually added nodes. To resolve this, you can either remove the manually added nodes first or, preferably, create a new, dedicated node pool with Auto Scaling enabled from the start.
The node pool contains subscription-based instances
The node auto scaling feature does not support nodes that are billed on a subscription basis. It is only compatible with pay-as-you-go instances.
Scale-in behavior
Why does cluster-autoscaler fail to scale in a node?
The cluster-autoscaler may be prevented from scaling in a node for several reasons. Check if any of the following cases apply:
The node's pods exceed the utilization threshold
The node will not be considered for scale-in if the total resource requests of the pods running on it are higher than the configured scale-in threshold.
The node is running
kube-systempodsBy default, cluster-autoscaler will not remove nodes that are running pods from the
kube-systemnamespace.A pod has restrictive scheduling constraints
The node cannot be scaled in if it is running a pod with a strict scheduling constraint (such as a
nodeSelectoror a strongnodeAffinity) that prevents it from being rescheduled onto any other available node in the cluster.A pod is protected by a PodDisruptionBudget (PDB)
The node cannot be scaled down if it is running a pod that is part of a workload protected by a PDB, and evicting that pod would violate the PDB's
minAvailableormaxUnavailablesetting.
See cluster-autoscaler for more frequently asked questions and answers.
How do I enable or disable eviction for a specific DaemonSet?
The cluster-autoscaler decides whether to evict DaemonSet pods based on the Evict DaemonSet Pods configuration. This configuration is cluster-wide and applies to all DaemonSet pods in the cluster. For more information, see Step 1: Enable node auto scaling for the cluster.
However, you can override this global setting on a per-DaemonSet basis by adding an annotation to its pods.
To explicitly enable eviction for a specific DaemonSet's pods, add the following annotation:
"cluster-autoscaler.kubernetes.io/enable-ds-eviction": "true"To explicitly disable eviction for a specific DaemonSet's pods, add the following annotation:
"cluster-autoscaler.kubernetes.io/enable-ds-eviction": "false"
If Evict DaemonSet Pods is disabled, the
enable-ds-eviction: "true"annotation will only take effect forDaemonSetpods on non-empty nodes. To enable eviction ofDaemonSetpods from empty nodes, you must first enable the global DaemonSet eviction setting.These annotations must be applied to the
DaemonSetpods themselves (typically by adding them to the pod template in theDaemonSetmanifest), not to theDaemonSetobject itself.These annotations have no effect on pods that are not part of a
DaemonSet.By default, cluster-autoscaler evicts
DaemonSetpods in a non-blocking manner. This means it will proceed to the next step without waiting for theDaemonSetpod's eviction to complete. If you need the cluster-autoscaler to wait for a specificDaemonSetpod to be fully evicted before proceeding with the scale-in, add the annotation"cluster-autoscaler.kubernetes.io/wait-until-evicted": "true"to the pod in addition to theenable-ds-evictionannotation.
What types of pods can prevent the cluster-autoscaler from removing a node?
The cluster-autoscaler might be blocked from removing a node if it contains pods not created by a native Kubernetes controller (such as a Deployment, ReplicaSet, Job, or StatefulSet), or if pods on the node cannot be safely terminated or migrated.
For a comprehensive list of all conditions that can block a node scale-in, see What types of pods can prevent CA from removing a node?
Extension support
Does cluster-autoscaler support CustomResourceDefinitions (CRDs)?
No, cluster-autoscaler currently supports only standard Kubernetes objects and does not support Kubernetes CRDs.
Pod-basis scaling behavior control
How can I configure a scale-out delay for a specific pod?
You can control this behavior by adding the cluster-autoscaler.kubernetes.io/pod-scale-up-delay annotation to the pod.
The cluster-autoscaler will only consider the pod for a scale-out if it remains unschedulable after this delay period has passed. This gives the native Kubernetes scheduler extra time to try to place the pod on existing nodes before a scale-up is triggered.
Annotation example: "cluster-autoscaler.kubernetes.io/pod-scale-up-delay": "600s".
How can I use pod annotations to control cluster-autoscaler scale-in behavior?
Use the pod annotation cluster-autoscaler.kubernetes.io/safe-to-evict to explicitly tell the cluster-autoscaler whether a particular pod can be safely evicted to allow for a node scale-in.
To prevent a node from being scaled in, add the annotation
"cluster-autoscaler.kubernetes.io/safe-to-evict": "false"to a pod running on the node. The presence of this pod will block the node from being terminated by the autoscaler..To allow a node to be scaled in, add the annotation
"cluster-autoscaler.kubernetes.io/safe-to-evict": "true"to a pod. This explicitly marks the pod as safe to evict during a scale-in operation.
Node-basis scaling behavior control
How do I prevent cluster-autoscaler from scaling in a specific node?
To prevent a target node from being scaled in by the cluster-autoscaler, add the annotation "cluster-autoscaler.kubernetes.io/scale-down-disabled": "true" to it.
To add this annotation, run the following kubectl command, replacing <nodename> with the name of your target node:
kubectl annotate node <nodename> cluster-autoscaler.kubernetes.io/scale-down-disabled=trueThe cluster-autoscaler add-on related
How do I upgrade cluster-autoscaler to the latest version?
For clusters with Auto Scaling enabled, upgrade the cluster-autoscaler as follows:
Log on to the ACK console. In the left navigation pane, click Clusters.
On the Clusters page, find the cluster to manage and click its name. In the left navigation pane, choose .
Click Edit to the right of Node Scaling. In the panel that appears, click OK to upgrade the add-on to the latest version.
What actions trigger an automatic update of cluster-autoscaler?
To ensure that the configuration of cluster-autoscaler is up-to-date and its version remains compatible with your cluster, the following actions will trigger an automatic update or reconciliation:
Modifying the auto scaling configuration.
Creating, deleting, or updating a node pool where Auto Scaling is enabled.
Successfully upgrading the cluster's Kubernetes version.
Why is node scaling not working on my ACK managed cluster even though the required role authorization is complete?
Possible cause
This issue can occur if the required token (addon.aliyuncsmanagedautoscalerrole.token) is missing from a Secret within the kube-system namespace. By default, ACK uses the cluster's Worker Role to enable autos caling capabilities, and this token is essential for authenticating those operations.
Solution
The solution is to re-apply the required policy to the cluster's Worker Role by using the authorization wizard in the ACK console.
On the Clusters page, find the cluster to manage and click its name. In the left navigation pane, choose .
On the Node Pools page, click Enable to the right of Node Scaling.
Follow the on-screen instructions to authorize the
KubernetesWorkerRoleand attach theAliyunCSManagedAutoScalerRolePolicysystem policy.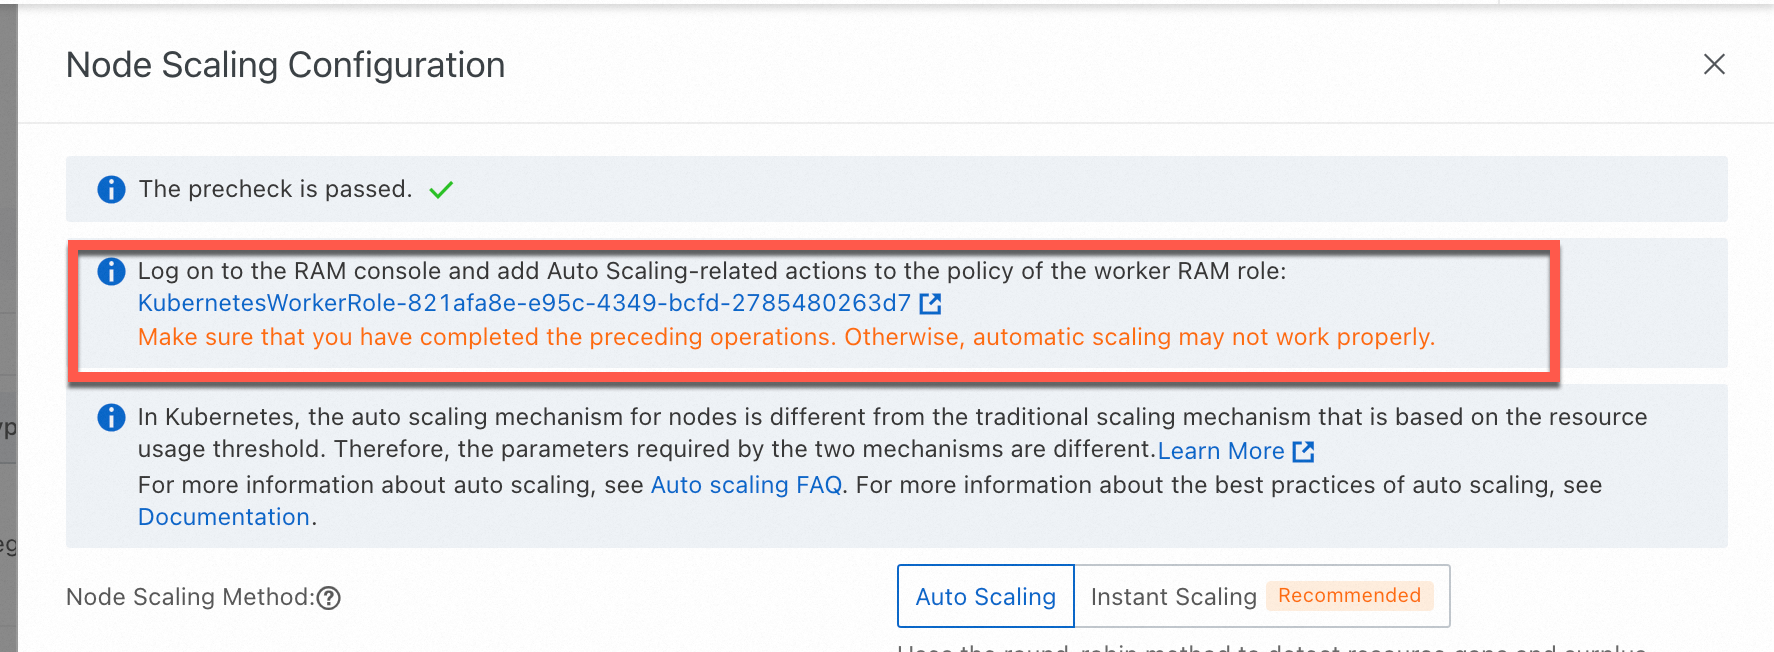
Manually restart the
cluster-autoscalerDeployment (node auto scaling) or theack-goatscalerDeployment (node instant scaling) in thekube-systemnamespace for the permissions to take effect immediately.