Simple Log Service provides two methods for deploying Logtail to collect Kubernetes logs: DaemonSet and Sidecar. For details on the differences between them, see Install Logtail to collect logs from a Kubernetes cluster. This topic explains how to deploy Logtail using Sidecar mode to collect text logs from a Kubernetes cluster.
Prerequisites
Procedure
This topic uses an ACK managed cluster as an example to describe the steps for collecting text logs in Sidecar mode:
Inject a Logtail container into an application pod: Each pod runs a Logtail container to collect logs from all containers in the current pod. Log collection from each pod is isolated.
Create a machine group with a custom identifier: Create a machine group for each pod. Simple Log Service manages all containers that need to collect logs through Logtail by using machine groups.
Create a Logtail configuration: After a Logtail configuration is created, Logtail collects incremental logs based on the Logtail configuration, then processes and uploads the collected logs to the created logstore.
Query and analyze logs: View log data in the logstore.
Step 1: Inject a Logtail container into an application pod
The login method differs between self-managed clusters and ACK clusters, but all other steps are the same.
Log on to the Container Service for Kubernetes console. In the left-side navigation pane, click Clusters, click More in the Actions column of the target cluster, then click Manage ACK clusters.

Add the following to your existing application container YAML:
If you do not have an existing application container or you want to test the procedure, this topic also provides a YAML example: Simply modify the ALIYUN_LOGTAIL_USER_ID in the example to your Alibaba Cloud account ID, and ensure that the region
${region_id}in ALIYUN_LOGTAIL_CONFIG is the same as the region of your Simple Log Service project. For the value, see Supported regions and replace it.Run
kubectl apply -fto apply the configuration.Run
kubectl describe podto obtain the following information, which indicates that the Logtail container is successfully injected.
Step 2: Create a machine group with a custom identifier
The ${your_machine_group_user_defined_id} in the YAML is a custom identifier. In this example, the value is nginx-log-sidecar.
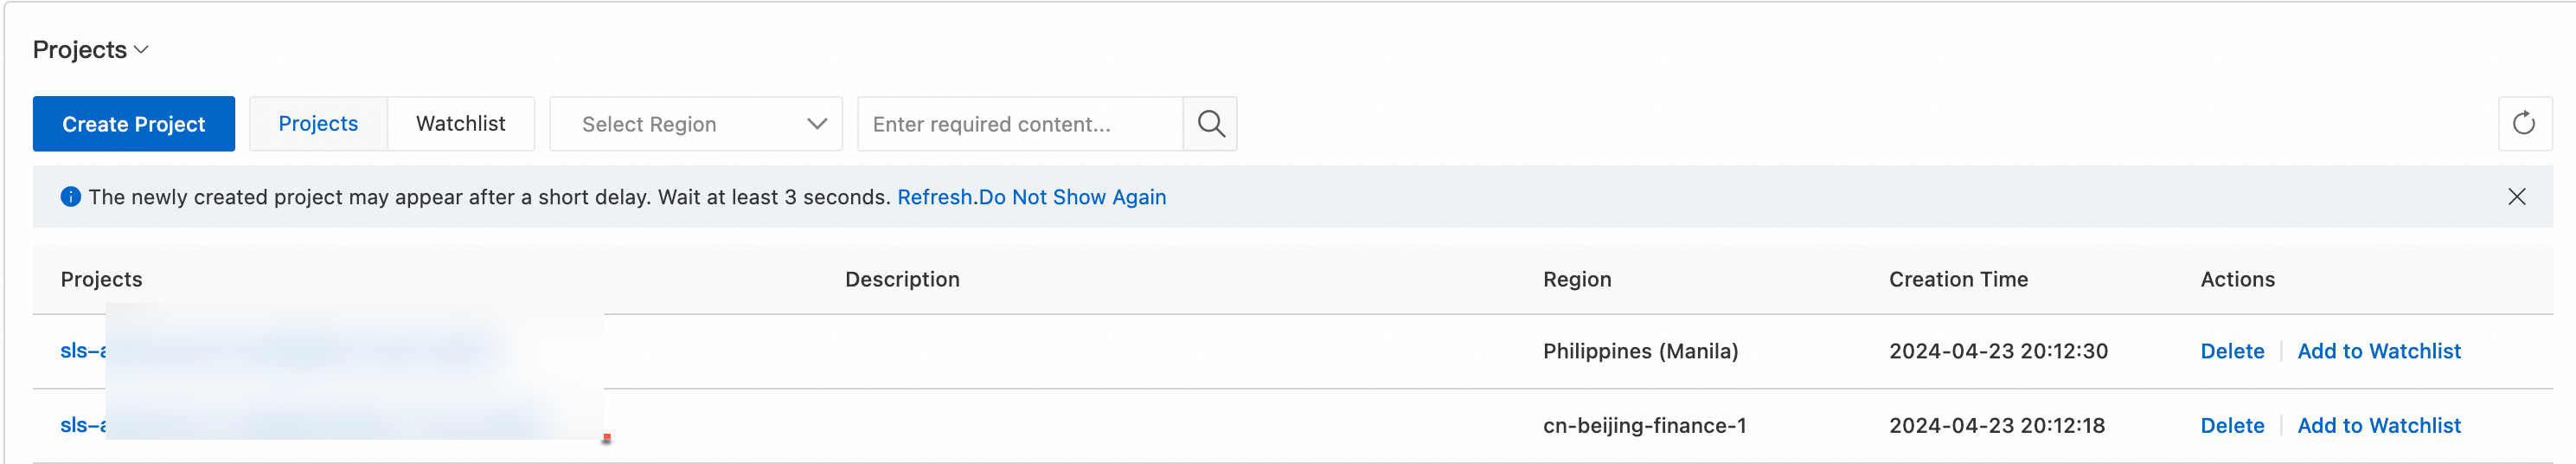
Log on to the Simple Log Service console. In the Projects section, click the one you want.
In the navigation pane on the left, choose . In the Machine Groups list, choose
 > Create Machine Group.
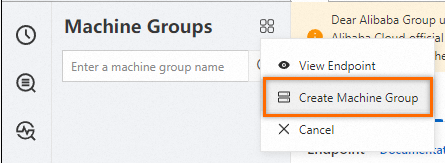
In the Create Machine Group panel, enter the following information and click OK.
Parameter
Description
Name
The name of the machine group must meet the following requirements:
Contains only lowercase letters, digits, hyphens (-), and underscores (_).
Starts and ends with a lowercase letter or a digit.
Is 2 to 128 characters in length.
ImportantAfter you create a machine group, you cannot change its name. Proceed with caution.
Machine Group Identifier
Select Custom Identifier.
Machine Group Topic
Optional. The topic is used to identify the logs generated by different servers.
Custom Identifier
Enter the custom identifier configured in Step 1, such as
nginx-log-sidecar.
Step 3: Create a Logtail configuration
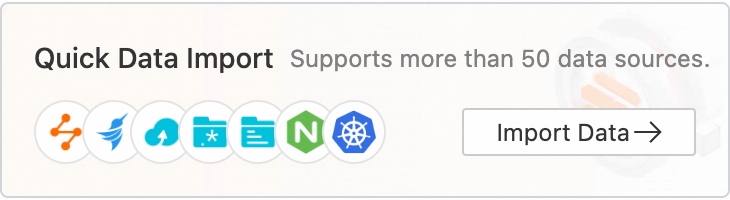
Log on to the Simple Log Service console.
In the Quick Data Import section, click Import Data. In the Import Data dialog box, click the Kubernetes - File card.
Select the target project and logstore, and click Next.
On the Machine Group Configurations page, perform the following operations. For information about machine groups, see Machine groups.
Set Scenario to Kubernetes Clusters and Deployment Method to Sidecar.
Make sure that the target machine group appears in the Applied Server Groups list, then click Next. The machine group is the one created in Step 2.
If the heartbeat status of the machine group is FAIL or no machine information exists, click Automatic Retry. If the status is still FAIL, check whether the region in ALIYUN_LOGTAIL_CONFIG in the YAML is the same as the region of the project.
If the issue persists, see How do I troubleshoot an error that is related to a Logtail machine group in a host environment?
Create a Logtail configuration and click Next. Simple Log Service starts to collect logs.
NoteIt takes about 3 minutes to create a Logtail configuration.
This section describes only the required configurations. For information about all configurations, see Logtail configurations.
Global Configurations
Configuration Name: The name of the Logtail configuration. The name must be unique in the project to which the Logtail configuration belongs. After it is created, you cannot change its name.

Input Configurations
Logtail Deployment Mode: Select Sidecar.
File Path: The directory name and file name can be in a full path or a path that contains wildcard characters. Wildcard characters include asterisks (*) and question marks (?). In this example, the directory value is the
${dir_containing_your_files}in the YAML./apsara/nuwa/**/*.logindicates files with the .log extension in the/apsara/nuwafolder (including its recursive subdirectories).

Processor Configurations
Log Sample: You can enter multiple logs. We recommend entering log samples to help configure processing parameters and reduce complexity.
Multi-line Mode: In this example, multi-line logs are collected. Enable this feature.
Type: Select Custom.
Processing Method If Splitting Fails: Select Retain Single Line.
Regex to Match First Line: Specify a regular expression and click Validate, or click Generate and Automatically Generate.
Processing Method: Select None. For more information, see Overview of Logtail plug-ins for data processing.
Create indexes and preview data, then click Next. By default, Full-text Index is enabled for Simple Log Service. You can also manually create field indexes based on the collected logs, or click Automatic Index Generation to automatically generate field indexes. For more information, see Create indexes.
To query all fields in logs, use full-text indexes. To query specific ones, use field indexes to reduce index traffic. For field analysis (SELECT statement), create field indexes.
Step 4: Query and analyze logs
In the Projects section of the Simple Log Service console, click the project that you want to manage to go to its details page.
Find the logstore that you want to manage, move the pointer over the logstore, click the
 icon, then select Search & Analysis to view the logs of your Kubernetes cluster.
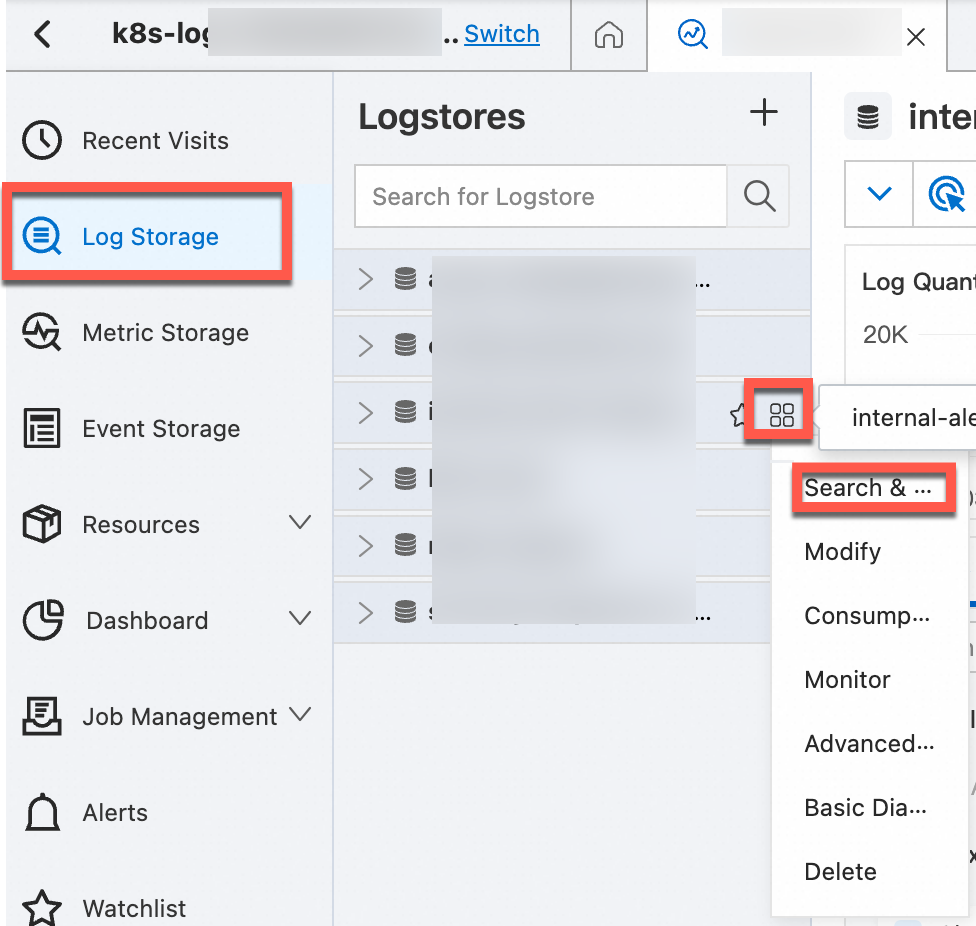
K8s log fields
The following table describes the default fields that are included in each container text log in Kubernetes.
Field | Description |
__tag__:__hostname__ | The name of the container host. |
__tag__:__path__ | The log file path in the container. |
__tag__:_container_ip_ | The IP address of the container. |
__tag__:_image_name_ | The name of the image used by the container. Note If there are multiple images with the same hash but different names or tags, the collection configuration will select one name based on the hash for collection. It cannot ensure that the selected name matches the one defined in the YAML file. |
__tag__:_pod_name_ | The name of the pod. |
__tag__:_namespace_ | The namespace to which the pod belongs. |
__tag__:_pod_uid_ | The unique identifier (UID) of the pod. |
References
With the visualization feature of Simple Log Service, you can aggregate and get an overview of your log data. For more information, see Create a dashboard.
Use the alert feature in Simple Log Service to receive automatic notifications about abnormalities in your logs. For more information, see Configure an alert rule in Simple Log Service.
Simple Log Service only collects incremental logs. To gather historical log files, see Import historical logs from log files.
For troubleshooting container log collection, consider the following:
Verify if there are error messages in the console. For more information, see Logtail diagnostics.
If the console shows no error messages, investigate the heartbeat of a machine group, Logtail configuration, and related issues. For more information, see What do I do if errors occur when I collect logs from containers?