This topic provides answers to frequently asked questions (FAQs) about Kibana for Alibaba Cloud Elasticsearch.
Logon and authentication
How do I log on to the Kibana console? What are the username and password?
To log on to the Kibana console, see Log on to the Kibana console. The default username for the Kibana console is elastic. The password is the one that you set when you created the Alibaba Cloud Elasticsearch instance. If you forget the password, see Reset the access password of an instance.
What is the elastic account and its password used for?
The elastic account is the default administrator account for your Alibaba Cloud Elasticsearch cluster, granting full cluster management permissions. Its password is required for authentication when you access the cluster via:
APIs or SDKs.
The Kibana console.
How can I better manage permissions and security in the Kibana console?
To effectively manage permissions and enhance security within your Alibaba Cloud Elasticsearch cluster and Kibana, follow these best practices:
Avoid using the
elasticaccount for daily operations: Theelasticaccount is a superuser with full administrative privileges. Using it for routine tasks (including search services) is a significant security risk, as a leaked password could compromise your entire cluster.Create dedicated users with granular roles: Instead of relying on
elastic, create specific users and assign them only the necessary roles and permissions. This adheres to the principle of least privilege.For detailed instructions on configuring users, roles, and permissions, see: Use the RBAC mechanism provided by Elasticsearch X-Pack to implement access control.
Exercise caution when resetting the
elasticpassword: If you are using theelasticaccount for any ongoing services (which is not recommended), resetting its password will immediately cause authentication failures and service disruptions until the new password is updated everywhere.
When I use the elastic account to create a user in the Kibana console, the message "You do not have permission to manage users" appears. How do I fix this?
The following figure shows the error message.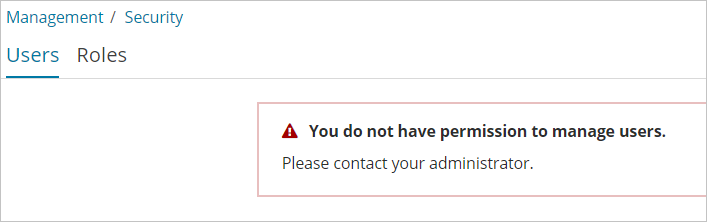
Troubleshoot the issue as follows:
In the Kibana console, run the
GET _licensecommand to check if the certificate has expired.Run the
GET /_cat/indices?vcommand to check if multiple system indexes .security-* exist in the cluster. If they do, it indicates that you have performed a full index migration or synchronization. Fix this issue by deleting the earlier versions of the .security-* indexes.
Access and connectivity
Can I access services on the public network from the Kibana console?
No.
Your Elasticsearch cluster and its Kibana console are deployed within a VPC for security and isolation. This design means it can only communicate with other services that are also located within that same VPC.
The public network whitelist feature, conversely, is for allowing external clients (from the public internet) to securely access your Kibana console. It does not enable your Elasticsearch cluster or Kibana to initiate connections outbound to public network services.
I cannot access Dev Tools in Kibana. How do I fix this?
Check if the Kibana node specifications are 1 vCPU and 2 GiB. These specifications are unstable and suitable only for testing, not for production environments. Upgrade the specifications as soon as possible. For more information, see Upgrade a cluster.
After I perform an operation, I can no longer access Kibana, but I can still access Elasticsearch. How do I fix this?
Restart the Kibana node. On the Basic Information page of the Elasticsearch cluster, in the Node Visualization section, move the mouse pointer over the status light of the Kibana Node and click Restart.
Why is the IP address resolved from the private domain name of a Kibana V7.16 instance not in my VPC?
To prevent Kibana from restarting when the HTTPS certificate is replaced, the deployment architecture of Kibana V7.16 and some V7.10 clusters has been adjusted. A Layer 7 agent service is added to the Kibana service. Therefore, the IP address resolved from the private domain name is the IP address of the Layer 7 agent service. This adjustment does not affect the security or normal use of Kibana and has passed the security review by the relevant Alibaba Cloud teams. It is safe to use.
I cannot access Kibana through an Nginx agent. How do I troubleshoot this?
If you are using an Nginx proxy to access Kibana over a private or public network and are experiencing access issues, systematically troubleshoot by checking network connectivity, Nginx configuration, and authentication settings.
Verify network connectivity.
IP address whitelist: Confirm that the IP address of your Nginx server (or the originating client's IP if Nginx is further proxied) is added to the appropriate Kibana whitelist. For more information, see Connect to a cluster through Kibana.
Security group rules (for cloud-native new control (v3) clusters): If your Elasticsearch cluster uses the cloud-native new control (v3) architecture and you are accessing Kibana from within the VPC, check associated security group rules:
Kibana's security group: For inbound rules, ensure that traffic from the Nginx server's IP address to the Kibana port (typically 5601) is explicitly allowed. Outbound rules generally do not require specific configuration here.
Nginx server's security group: For outbound rules, ensure that traffic from the Nginx server to the Kibana service's IP address and port (e.g., 5601) is allowed.
NoteConfigure the settings based on your network environment and the actual port.
Review Nginx proxy configuration.
Incorrect Nginx configurations are a frequent cause of Kibana access failures.
proxy_passdirective: Verify that theproxy_passdirective in your Nginx configuration file points to the correct Kibana service endpoint, protocol (httporhttps), and port number (e.g.,http://<Kibana_Endpoint>:5601).Hostrequest header: Kibana may fail to correctly identify the request source if theHostrequest header is modified by Nginx (e.g., usingproxy_set_header Host XXX). Resolve this in one of the following ways:Method 1: Comment out or delete the
proxy_set_header Hostconfiguration.Method 2: If you want to retain the
Hostconfiguration, set Host to the original domain name of Kibana.
For a sample configuration file, see Nginx configuration file.
Adjust the Kibana authentication method.
If you use a cloud-native architecture instance and access Kibana over a private network through an agent, you must use only a username and password for authentication. For more information, see Connect to a cluster through Kibana.
Apply changes and restart the Nginx agent.
Test Nginx configuration syntax:
sudo nginx -tReload Nginx service:
sudo nginx -s reload
Why can't I access Kibana using a custom domain name through a CNAME record?
For Alibaba Cloud Elasticsearch clusters with cloud-native new control (v3) architecture type, you cannot access the Kibana service using a custom domain name through a CNAME record. To use a custom domain name to access Kibana, see Access Kibana through an Nginx agent.
You can go to the Basic Information page of the instance to view the Control Architecture Type of the instance.
Configuration
The Modify Configuration button for Kibana is grayed out, and I cannot modify the Kibana allowlist.
If the ES instance is not in the Normal state, the Modify Configuration button for Kibana may be grayed out. You can wait for the instance status to return to Normal, or investigate the cause of the abnormal status.
Does Kibana support custom plugins?
No, it does not. For Kibana versions earlier than 7.0, only the default plugins provided in the console are supported. Kibana V7.0 and later do not support any plugins.
Which Kibana versions support language modification?
Currently, only Kibana V6.7.0 and later support language modification. The Kibana console supports English and Chinese. You can change the setting to use Kibana in your preferred language. For more information, see Configure the language of the Kibana console.
How do I install Kibana plugins?
The timestamp used for filtering in the Discover interface does not match the timestamp stored in the Elasticsearch document. Why?
The timestamp (@timestamp) used on the Discover page of Kibana is in UTC by default, while the timestamp stored in the Elasticsearch document is in the local time. Therefore, the two timestamps may be different. To resolve this issue, you can use one of the following solutions:
For new data: You can modify the time zone setting in Kibana. To do this, modify
dateFormat:tzon the Advanced Settings page in Kibana.For historical data: You can use the Reindex API to reindex previously stored data and modify the timestamps.
Errors and startup
Kibana fails to start and reports the "Kibana server is not ready yet" error during logon. How do I fix this?
Possible cause | Solution |
Multiple Kibana system indexes exist or the data structure has changed. | Delete the indexes that start with Warning After you delete the |
The | Run the |
The Elasticsearch cluster load is too high. | Go to cluster monitoring to troubleshoot the issue. The possible causes and solutions are as follows:
|
High Kibana load. | If the error persists after you troubleshoot the issue using the preceding methods, the issue might be related to the Kibana load. Restart the Kibana node or upgrade the Kibana node specifications in the console. For more information, see Restart a cluster or node and Upgrade a cluster. Important Kibana nodes with 1 vCPU and 2 GiB specifications are not suitable for production environments. Upgrade them as soon as possible. |
Kibana reports the "Maximum call stack size exceeded" error. How do I fix this?
Cause
This error indicates that the instance status is abnormal. High heap memory overhead can cause insufficient heap memory, which in turn causes Kibana requests to time out.
Solution
Reduce the bulk write size or upgrade the cluster.
Data and export
How do I view shard and index information in the Kibana console?
Run the
GET _nodes/statscommand to view index information.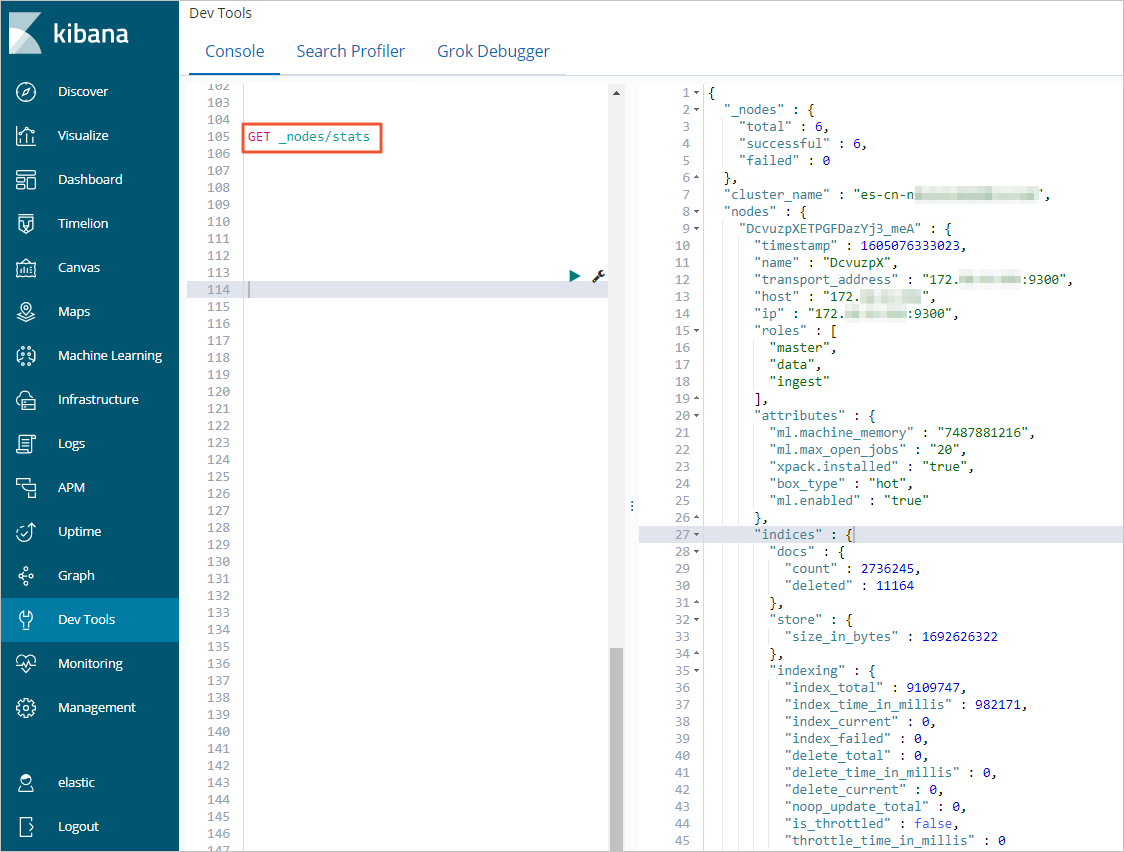
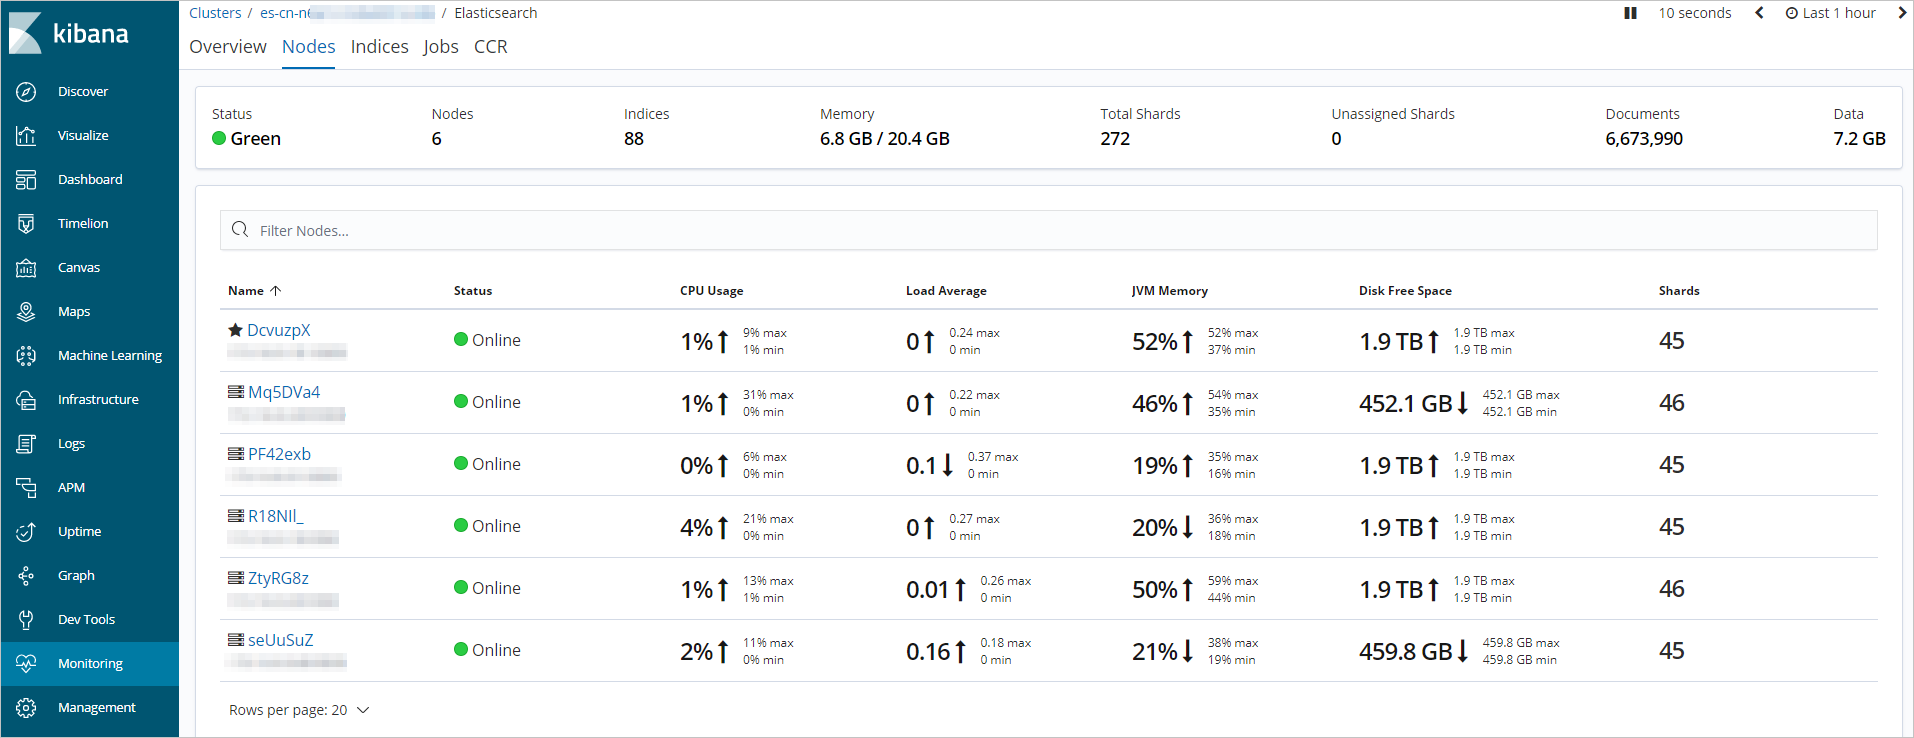
On the Monitoring page, the shard status of indexes on a node is displayed, including heap memory usage, as shown in the following figure.
When I export log data in CSV format from Kibana, can I set the data volume?
When you export a CSV file from Kibana, the default size is 10,485,760 bytes (10 MB). Data that exceeds this limit is truncated. This setting is intended to prevent large exports from causing performance and storage issues. For cluster health and stability, this parameter can no longer be modified. Export the file in batches.
I'm experiencing a Kibana logon error, but I need to access Kibana to purge data. What should I do?
If you cannot log on to Kibana but need to perform data purging, you can directly use the Elasticsearch API with curl commands. This allows you to manage your cluster without relying on the Kibana interface. For more information, see Use a curl command to access and manage an Alibaba Cloud Elasticsearch cluster.
Query all indexes in the cluster
curl -u elastic:<yourEsPassword> -XGET 'http://es-cn-7pp2auqzk0023****.public.elasticsearch.aliyuncs.com:9200/_cat/indices?v'Purge data
curl -u elastic:<yourEsPassword> -XDELETE 'http://es-cn-7pp2auqzk0023****.public.elasticsearch.aliyuncs.com:9200/<yourIndex>'