Alibaba Cloud Elasticsearch allows you to configure monitoring indexes for a cluster.
After you configure monitoring indexes for an Elasticsearch cluster, you can view
the monitoring log data of the cluster. The configuration helps reduce the disk space
occupied by the log data and ensure the normal running of the cluster. This topic
describes how to configure monitoring indexes for an Elasticsearch cluster.
Background information
By default, the X-Pack monitoring component collects monitoring data from an Elasticsearch
cluster at intervals of 10 seconds and saves the data to the indexes whose names start
with .monitoring-* in the cluster. The .monitoring-es-6-* and .monitoring-kibana-6-* indexes are used to store monitoring data. The two types of indexes are rolled over
every day. The name of a .monitoring-es-6-* index ends with the date when the monitoring data is saved.
A .monitoring-es-6-* index stores information about the cluster status, cluster statistics, node statistics,
and index statistics. Such indexes consume a large amount of disk space.
Procedure
- Log on to the Kibana console of your Elasticsearch cluster and go to the homepage
of the Kibana console as prompted.
For more information about how to log on to the Kibana console, see Log on to the Kibana console.
Note In this example, an Elasticsearch V6.7.0 cluster is used. Operations on clusters of
other versions may differ. The actual operations in the console prevail.
- In the left-side navigation pane, click Monitoring.
- In the Elasticsearch section, click Indices.
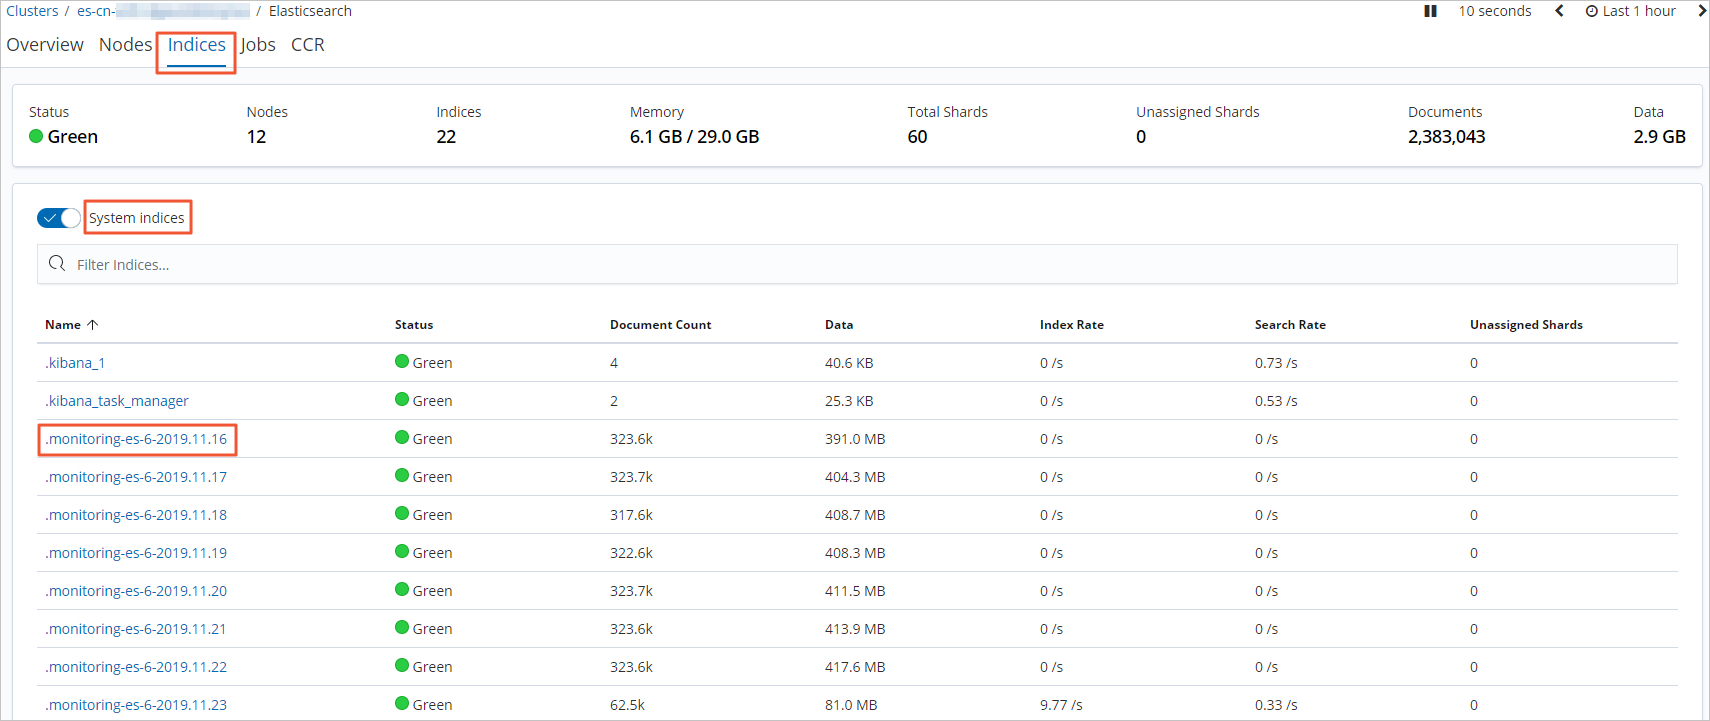
- On the Indices tab, turn on System indices to query the disk space that is occupied by monitoring indexes.
- In the left-side navigation pane, click Dev Tools.
- On the Console tab, configure monitoring indexes.
By default, the system monitoring indexes whose names start with
.monitoring-es-* are generated by Elasticsearch at 08:00 UTC+8 and store monitoring data generated
over the last seven days. The system monitoring indexes occupy the storage space of
an Elasticsearch cluster. The size of the system monitoring indexes is related to
the number of indexes (including system indexes) and the number of nodes in the Elasticsearch
cluster. You can use one or both of the following methods to reduce the disk space
consumed by the indexes that store the monitoring data:
- Specify the index retention duration.
PUT _cluster/settings
{"persistent": {"xpack.monitoring.history.duration":"1d"}}
You can specify the index retention duration based on your business requirements.
The minimum retention duration is one day.
- Specify the indexes that you want to monitor.
Call the related API operation to specify the indexes that you want to monitor or
the indexes that do not need to be monitored. This helps reduce the disk space occupied
by the
.monitoring-es-6-* indexes. The following code shows how to prohibit the monitoring of system indexes.
PUT _cluster/settings
{"persistent": {"xpack.monitoring.collection.indices": "*,-.*"}}
Note The excluded indexes are not displayed on the Monitoring page in the Kibana console. However, these indexes are listed in the index list that
is obtained by calling the GET _cat/indices operation. The status of the indexes is also displayed in the index list. The indexes
can be in the open or close state.

