By Ji Jiayu, nicknamed Qingyu at Alibaba.
The operation of analyzing server logs is one of the very first and crucial steps for any company interested in creating its own big data analytics solution. However, before such a solution can be created, a company typically will typically have to overcome one or more of the following obstacles:
In this article, we're going to look at how you can overcome the second obstacles by implementing a massively parallel processing database solution with Alibaba Cloud AnalyticDB. With this solution, your company will no longer need to confront the uncertainty of how to set up Hadoop. Moreover, with the support of Alibaba Cloud, you can ultimately also overcome the other major challenges listed above.
But, with all that said, you may still be curious. Why exactly can this solution replace Hadoop, and why should I consider using it? Well, to answer this question, let's explore why exactly Hadoop exists, what its used for, and how we can replicate it with Alibaba Cloud's solution.
Ultimately, Hadoop exists because it can help solve the scaling problems found with traditional databases. The performance of traditional single-node relational databases can only be improved by scaling up, which means increasing the CPU, memory, or swapping hard disks. And doing so in later phases of development, a 5% improvement in computing capability can cost 10 times more than in the early phases. Hadoop can help to reduce these costs if implemented when you created your databases. Hadoop works as a distributed solution. It can scale out through using a shared-nothing (SN) architecture. In this architecture, the performance of Hadoop increases linearly when nodes with the same performance are added, which critically means that the input will be proportional to the output.
However, relational databases are not well suited to non- or semi-structured data. They store data in rows and columns, and therefore data cannot be inserted in JSON or XML format. Fortunately, Hadoop has the advantage that it can interpret these data formats, and it can do so by compiling specific input readers, which in turn allows it to process both structured and unstructured data, making Hadoop a highly convenient solution. However, even if you do choose to use Hadoop in your systems, for improved processing performance, it's recommended that you only use structured data, and don't use unstructured data.
Anyway, getting back to our solution, all of this tells us that, if a relational database with a shared-nothing architecture can be used to structure imported data in advance, then a big data analytics solution can indeed be performed in a massively parallel processing database, as I have proposed.
Alibaba Cloud AnalyticDB is a database management system that is well suited for this type of scenario. By implementing this solution with Alibaba Cloud, you will not only bypass the hassle involved in setting up Hadoop, but you'll also have the chance to take advantage of the several other solutions Alibaba Cloud has to offer in its large portfolio of big data and analytics products and services.
Before we begin with the tutorial outlined in this article, let's first look at some of the major components required in our solution. Note that you'll also need a valid Alibaba Cloud account to complete the steps described in this tutorial.
| Nginx | This is a reverse proxy for load balancing. It serves as the ingress for all network traffic and can record all user behaviors. Therefore, its logs can provide the most comprehensive analytics data source. |
| Logstash | This is a log collection tool that can pre-process collected data and format the data by using configuration files. |
| Datahub | This is a data pipeline that is used to publish and subscribe to data. Data in Datahub can be directly exported to common data storage services like Alibaba Cloud MaxCompute, Object Storage Service (OSS), and AnalyticDB. |
| AnalyticDB for MySQL | This is a data warehouse that can process petabytes of data and that features the competitive advantages of high concurrency and low latency. It uses a massively parallel processing architecture and is fully compatible with the MySQL protocol. |
In this section, I'll go through the steps needed to set up our solution using Alibaba Cloud AnalyticDB.
First, before anything else, you'll want to install Nginx. To do that, first, in CentOS, run the following command to install Nginx:
yum install nginxAfter Nginx is installed, the information shown below will appear.
已安装:
  nginx.x86_64 1:1.12.2-3.el7

作为依赖被安装:
  nginx-all-modules.noarch 1:1.12.2-3.el7              nginx-mod-http-geoip.x86_64 1:1.12.2-3.el7     nginx-mod-http-image-filter.x86_64 1:1.12.2-3.el7     nginx-mod-http-perl.x86_64 1:1.12.2-3.el7
  nginx-mod-http-xslt-filter.x86_64 1:1.12.2-3.el7     nginx-mod-mail.x86_64 1:1.12.2-3.el7           nginx-mod-stream.x86_64 1:1.12.2-3.el7

完毕!
Now, you'll need to define the log format of Nginx. In this example, we wanted to collect statistics on unique visitors (UV) to a website and the response time of each request. So, therefore, to do this, we needed to add $request_time and $http_cookie. The default date format of Nginx is 07/Jul/2019:03:02:59, which is not very suitable for the queries we will use in subsequent analysis, so we changed the date format to 2019-07-11T16:32:09.
Next, you'll want to find /etc/nginx/nginx.conf, open the file with Vim, and change the log_format value as follows:
log_format  main  '$remote_addr - [$time_iso8601] "$request" '
                  '$status $body_bytes_sent $request_time "$http_referer" '
                  '"$http_user_agent" "$http_x_forwarded_for" "$http_cookie"' ;
Then, run the following command to restart Nginx so that the configuration takes effect:
service nginx restartCheck the logs in /var/log/nginx/access.log. You will find that the log format is as follows:
119.35.6.17 - [2019-07-14T16:39:17+08:00] "GET / HTTP/1.1" 304 0 0.000 "-" "Mozilla/5.0 (Macintosh; Intel Mac OS X 10_14_5) AppleWebKit/537.36 (KHTML, like Gecko) Chrome/75.0.3770.100 Safari/537.36" "-" "-"By default, the home page of Nginx does not record cookies, so it's recommended that you implement a logon system for an extra level of security.
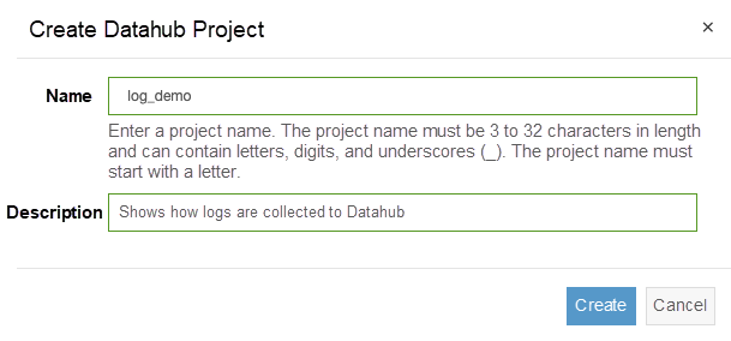
The address for the Datahub console is https://datahub.console.aliyun.com/datahub . To deploy Datahub, the first thing you'll want to do is create a project named log_demo, as shown below:
Next, you'll need to access the log_demo project and create a topic named topic_nginx_log. Your screen should look like the one shown below:
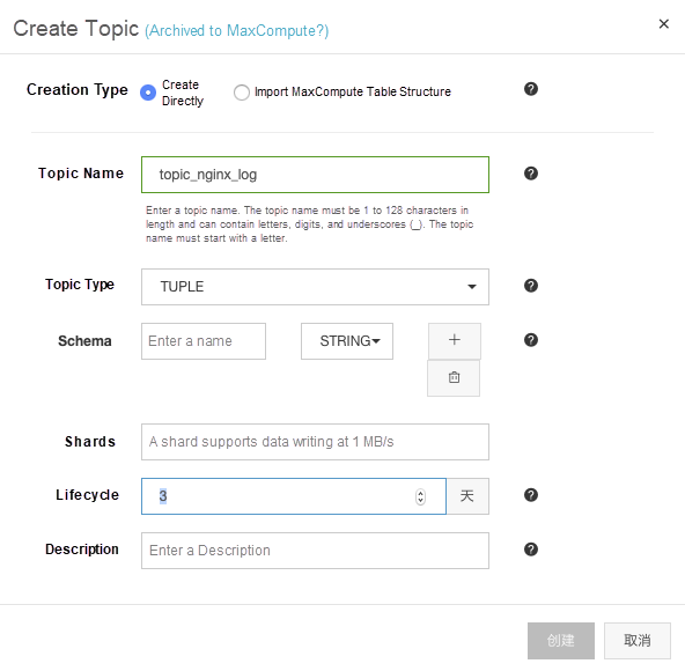
Now set Topic Type to TUPLE, which is organized with a schema that is used to facilitate subsequent viewing and processing requests. The definition of the schema is strongly correlated to the fields that are obtained from logs. Given this, you'll need to ensure that the schema is free of errors when you created it. Otherwise, errors may occur when recording the logs.
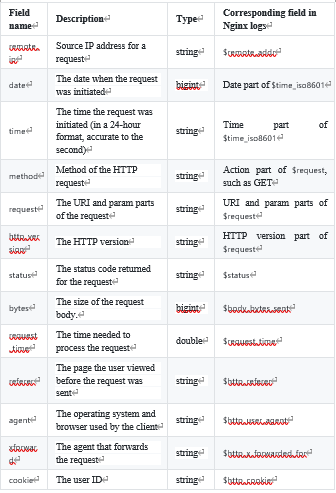
Now, consider the following as a point of reference. Below is a list of field names, along with their descriptions.
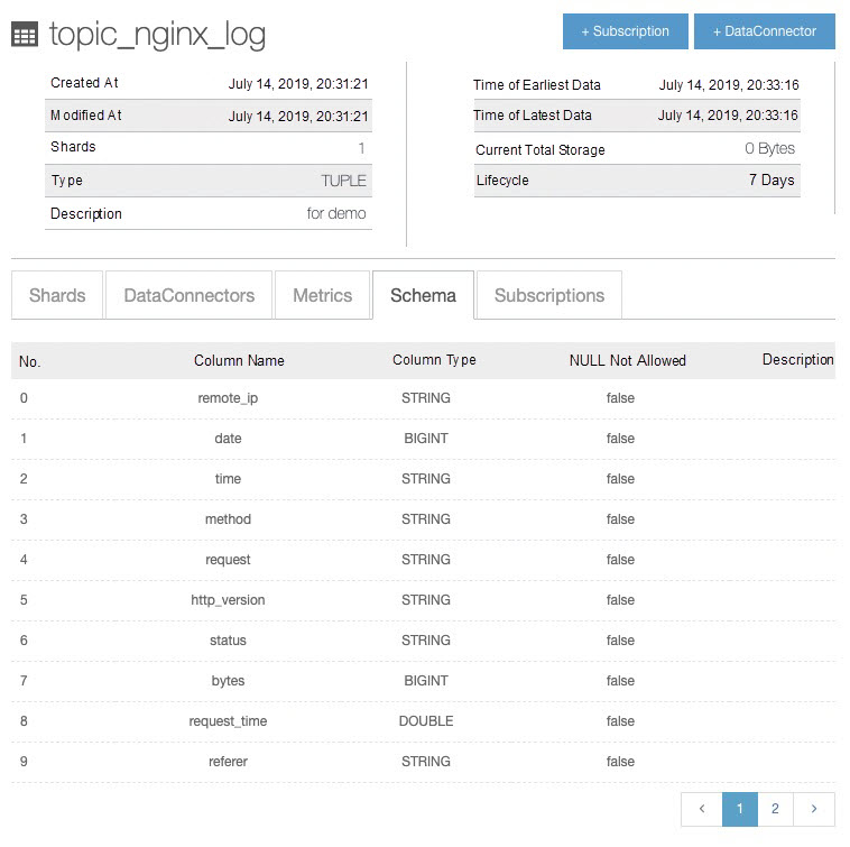
Note also that, after the topic is created, the Schema tab of this topic should look something this:
Before we begin, it's important that you know that the official version of Logstash does not provide a compliance tool for Datahub, so you'll need to download the latest compatible version from the official Datahub website to reduce the cost of intermediate integration.
Now to install logstash, you'll want to return to the console and run the following command to download and decompress Logstash to the destination directory:
##注意,这里的版本号和下载链接可能因为更新缘故有区别,建议到介绍页面去获取最新链接

wget http://aliyun-datahub.oss-cn-hangzhou.aliyuncs.com/tools/logstash-with-datahub-6.4.0.tar.gz?spm=a2c4g.11186623.2.17.60f73452tHbnZQ&file=logstash-with-datahub-6.4.0.tar.gz

tar -zxvf logstash-with-datahub-6.4.0.tar.gz
Then, after Logstash is installed, you'll need to complete two tasks. First, you'll need to process log files when you capture them so that you can process the log files into structured data. Logstash's grok can easily complete this task. Second, Logstash must be told where to capture log files, which is the log storage location in Nginx, and where to synchronize the log files, specifically Datahub.
To enable grok to understand and convert log files, you'll need to add a new format to the grok-pattern file. This file is stored in the Logstash directory that was just downloaded. The path is as follows:
logstash/vendor/bundle/jruby/1.9/gems/logstash-patterns-core-xxx/patterns/grok-patternsUse Vim to open this file and add the new pattern to the end of the file as follows:
DATE_CHS %{YEAR}\-%{MONTHNUM}\-%{MONTHDAY}
NGINXACCESS %{IP:remote_ip} \- \[%{DATE_CHS:date}T%{TIME:time}\+08:00\] "%{WORD:method} %{URIPATHPARAM:request} HTTP/%{NUMBER:http_version}" %{NUMBER:status} %{NUMBER:bytes} %{NUMBER:request_time} %{QS:referer} %{QS:agent} %{QS:xforward} %{QS:cookie}In the Logstash directory, the config sub-directory contains the logstash-sample.conf file. You'll want to open the file and modify it as shown below.
input {
  file {
    path => "/var/log/nginx/access.log" #nginx的日志位置,默认在这里。
    start_position => "beginning" #从什么位置开始读起日志文件,beginning表示从最开始。
  }
}

filter {
  grok {
    match => {"message" => "%{NGINXACCESS}"} #当grok获取到一个消息时,怎么去转换格式
  }
  mutate {
    gsub => [ "date", "-", ""] #因为日期在后面要用作ADB表的二级分区,所以需要把非数字字符去掉
  }
}

output {
   datahub {
        access_id => "<access-key>" #从RAM用户获取access key
        access_key => "<access-secrect>" #从RAM用户获取access secret
        endpoint => "http://dh-cn-shenzhen-int-vpc.aliyuncs.com" #DataHub的endpoint,取决于把project建立在哪个区域
        project_name => "log_demo" #刚刚在DataHub上面创建的项目名称
        topic_name => "topic_nginx_log" #刚刚在DataHub上面创建的Topic名称
        dirty_data_continue => true #脏数据是否继续运行
        dirty_data_file => "/root/dirty_file" #脏数据文件名称,脏数据会被写入到这里
        dirty_data_file_max_size => 1000 #脏数据的文件大小
    }
}
Then, you can start Logstash to verify whether log files are written into Datahub. In the root directory of Logstash, run the following command:
bin/logstash -f config/logstash-sample.confThe following will show up when Logstash has been started.
ending Logstash logs to /root/logstash-with-datahub-6.4.0/logs which is now configured via log4j2.properties
[2019-07-12T13:36:49,946][WARN ][logstash.config.source.multilocal] Ignoring the 'pipelines.yml' file because modules or command line options are specified
[2019-07-12T13:36:51,000][INFO ][logstash.runner          ] Starting Logstash {"logstash.version"=>"6.4.0"}
[2019-07-12T13:36:54,756][INFO ][logstash.pipeline        ] Starting pipeline {:pipeline_id=>"main", "pipeline.workers"=>2, "pipeline.batch.size"=>125, "pipeline.batch.delay"=>50}
[2019-07-12T13:36:55,556][INFO ][logstash.outputs.datahub ] Init datahub success!
[2019-07-12T13:36:56,663][INFO ][logstash.inputs.file     ] No sincedb_path set, generating one based on the "path" setting {:sincedb_path=>"/root/logstash-with-datahub-6.4.0/data/plugins/inputs/file/.sincedb_d883144359d3b4f516b37dba51fab2a2", :path=>["/var/log/nginx/access.log"]}
[2019-07-12T13:36:56,753][INFO ][logstash.pipeline        ] Pipeline started successfully {:pipeline_id=>"main", :thread=>"#<Thread:0x445e23fb run>"}
[2019-07-12T13:36:56,909][INFO ][logstash.agent           ] Pipelines running {:count=>1, :running_pipelines=>[:main], :non_running_pipelines=>[]}
[2019-07-12T13:36:56,969][INFO ][filewatch.observingtail  ] START, creating Discoverer, Watch with file and sincedb collections
[2019-07-12T13:36:57,650][INFO ][logstash.agent           ] Successfully started Logstash API endpoint {:port=>9600}
Now, you can refresh the home page of Nginx. By default, Nginx comes with a static webpage. You can open this webpage by accessing port 80. When a log is generated, Logstash will immediately display the log information. An Example is shown below.
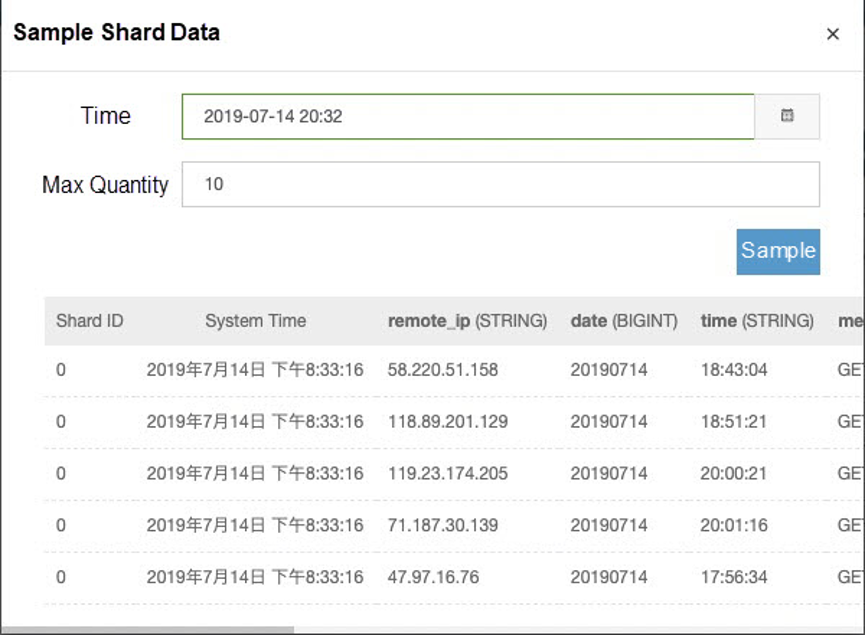
[2019-07-12T13:36:58,740][INFO ][logstash.outputs.datahub ] [2010]Put data to datahub success, total 10The sample data in Datahub is shown below.
Configuring your AnalyticDB database setup is relatively simple. Granted, setting these configurations to best meet your needs requires a bit of knowledge about several related concepts. I'll cover these core concepts in this section.
For the quick run down of how you can start to setting up things, you'll first want to follow these steps. Log on to the AnalyticDB console, then when you're there, you'll want to create a cluster named nginx_logging. An AnalyticDB database with the same name will be created. After your AnalyticDB database is created, the cluster name, instead of the database name, is shown in the console.
Note that it takes some time for a new cluster to be initiated, so you may have to wait several minutes. After it is completed, you can click Log On to Database in the console to access Data Management (DMS) and create a database for storing log files.
Before we precede any further, let's cover two of the several core concepts involved with Alibaba Cloud AnalyticDB.
Understanding the concept of partitions is crucial to improving the performance of a massively parallel processing database like AnalyticDB. Such a database can be scaled linearly as long as the data is distributed evenly, which in turn means that more hard disks can be utilized to improve the overall I/O performance involved in processing queries. Now, for AnalyticDB, the evenness of how data is distribution depends largely on the column that is used as a partition.
Now when it comes to configure the partition, it's not recommended that you use a column with skewed data, such as the date or gender column. And, it's not a good idea to use a column that contains several null values. In the example given in this tutorial, the Remote_ip column is the most suitable column to serve as a partition.
So what are Subparititions? How should you configure them? Well, subpartitions are just second-level partitions. Therefore, using subpartitions is in many ways similar to using multiple partitions, thereby dividing a table into multiple tables. Using subpartitions can be helpful as doing so can improve the performance of table-wide queries. When setting your specific configurations, you can set the number of subpartitions. When the number of subpartitions exceeds the number you set, AnalyticDB will automatically delete the oldest subpartition clearing historical data and keeping with the numbr you set.
In this example shown below, the date column is used to as a subpartition, which makes it easier to set the data retention time. If you want to retain the log data of the past 30 days, you'll simply need to set the number of subpartitions to 30. Note that the data in a subpartition column must be of the integer type, such as bigint or long. So, not all columns can serve as a subpartition.
The SQL statement for creating an Nginx table is shown below.
CREATE TABLE nginx_logging.nginx(
  remote_ip varchar NOT NULL COMMENT '',
  date bigint NOT NULL COMMENT '',
  time varchar NOT NULL COMMENT '',
  method varchar NOT NULL COMMENT '',
  request varchar COMMENT '',
  http_version varchar COMMENT '',
  status varchar COMMENT '',
  bytes bigint COMMENT '',
  request_time double COMMENT '',
  referer varchar COMMENT '',
  agent varchar COMMENT '',
  xforward varchar COMMENT '',
  cookie varchar COMMENT '',
  PRIMARY KEY (remote_ip,date,time)
)
PARTITION BY HASH KEY (remote_ip) PARTITION NUM 128 -- remote_ip作为一级分区
SUBPARTITION BY LIST KEY (date) -- date作为二级分区
SUBPARTITION OPTIONS (available_partition_num = 30) -- 二级分区30个,代表保留30天的数据
TABLEGROUP logs
OPTIONS (UPDATETYPE='realtime') -- 由于要被DataHub更新,所以一定要选择是realtime的表
COMMENT ''''
Note that AnalyticDB, by default, is accessed through public or classic networks connection. If you'd like to have private connection using virtual private cloud, you'll need to configure the IP address of your virtual private cloud to enable AnalyticDB to work with it. Alternatively, given that AnalyticDB is completely compatible with the MySQL protocol, you can also use a public IP address to log on to AnalyticDB from a local server.
In this tutorial, Datahub accesses AnalyticDB through a classic network connection.
Now, return to the topic named topic_nginx_log we created previously. The +DataConnector button is available in the upper-right corner. You need to enter the following information related to your AnalyticDB database:
Host: # IP address of the classic network that connects the ADB cluster
Port: # Port number of the classic network that connects the ADB cluster
Database: nginx_logging # Name entered when the ADB cluster is created, which is also the name of the ADB cluster
Table: nginx # Name of the table that was created
Username: <access-key> # AccessKey ID of the RAM user
Password: <access-secret> # AccessKey secret of the RAM user
Mode: replace into # In the case of a primary key conflicts, records will be overwritten.
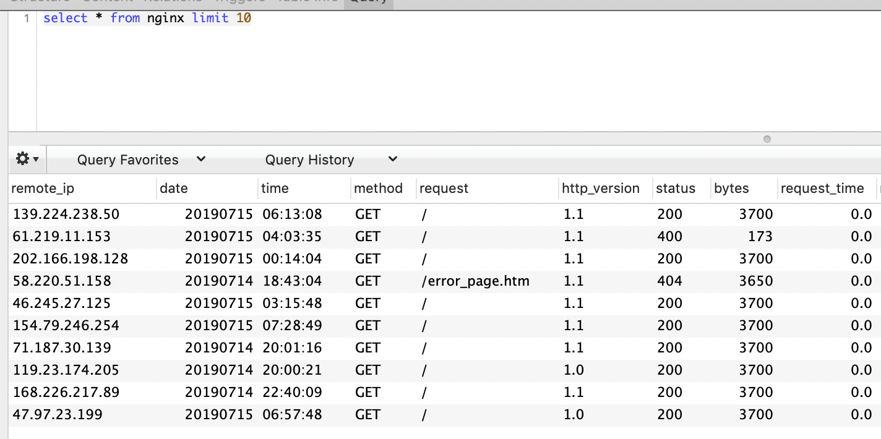
After this configuration is complete, you'll be able to find the relevant information under DataConnectors. If the data records are available in Datahub, the data records can also be found when the Nginx table is queried in AnalyticDB.
If you have followed the steps described in this tutorial, you have created a massively parallel processing database system that does not require you to set up Hadoop. Stayed tuned for more helpful to tutorials from Alibaba Cloud.
What Is a Chatbot Really Thinking When You're Talking with It

2,593 posts | 793 followers
FollowApsaraDB - February 29, 2024
ApsaraDB - February 18, 2025
Alibaba Clouder - July 7, 2020
ApsaraDB - February 20, 2021
ApsaraDB - August 12, 2020
ApsaraDB - October 20, 2020

2,593 posts | 793 followers
Follow Simple Log Service
An all-in-one service for log-type data
Learn More E-MapReduce Service
A Big Data service that uses Apache Hadoop and Spark to process and analyze data
Learn More ApsaraDB for HBase
ApsaraDB for HBase is a NoSQL database engine that is highly optimized and 100% compatible with the community edition of HBase.
Learn More DataV
DataV
A powerful and accessible data visualization tool
Learn MoreMore Posts by Alibaba Clouder