Network jitters are difficult to handle as they occur infrequently and are often short-lived. In fact, it is only in extreme cases that a jitter may last as long as 100 milliseconds. Many user-side service applications demand high timeliness and therefore are highly sensitive to even a latency of hundreds of milliseconds. This article illustrates how multiple teams co-handle a jitter issue. I hope this in-depth analysis can provide insights to help you tackle similar cases in the future.
For a better understanding of the jitter issue, let's take a look at some of the symptoms of network jitter. In this article, we will consider a scenario in which a user's application log registers latency of hundreds of milliseconds, and sometimes a latency as long as one to two seconds, along with frequent jitters. Such factors not only dramatically affect services which require a high level of timeliness but also hamper a user's confidence for migrating data to the cloud.
Through the initial analysis at the application layer, the user suspects that the issue arises from the virtual network environment. However, as the first step, it is critical to further abstract, simplify the problem. Since we don't have a clear understanding of user-side applications, and are unaware of the specific meanings and recording methods of application logs.
In this case, we must examine the symptoms through using standard system components, such as running ping. Therefore, as the first step, you'll want to write a script to ping two devices within an internal network, and record the latency of each ping in a file. The reason to ping two devices is that it allows setting the ping interval to hundreds of milliseconds, which helps explain the problem effectively.
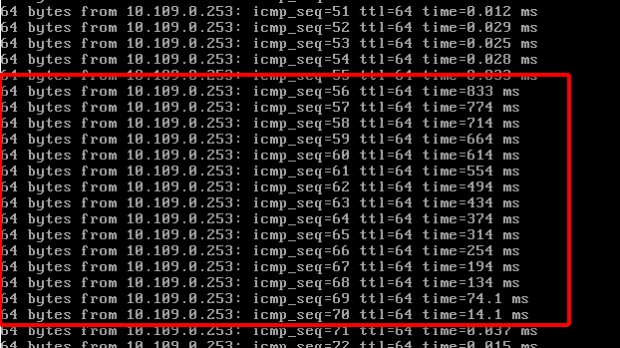
The mutual ping test identifies a latency of more than hundreds of milliseconds. Now, to rule out the possibility of the physical network impact, ping the gateway from a single device to identify a similar latency.

At first glance, the above test results show the concentrated latencies of hundreds of milliseconds. However, careful observation further shows that each of such instances of latency always appear during consecutive ping attempts as well as ranks in descending order.
So, you may wonder then, what does this mean? Read on to find out more.
The above ping test simplifies the problem to the ping gateway latency. However, it is crucial to understand the specific meaning of such regular test results.
First, it implies that no packet loss has occurred, and the system sends and responds to all the Internet Control Message Protocol (ICMP) requests. However, the descending order indicates that although the system doesn't immediately process all the responses it receives within the abnormal period, it all of a sudden starts to process all of the pending responses after 800 milliseconds. Consequently, we assume that the system stops processing network packets before 800 milliseconds.
The next question to address then is what stops the system from processing network packets.
The answer lies in disrupting interruptions. Hardware interruptions form the first and foremost step for the system to process network packets. Disabling interruptions prevents the CPU from executing the software interruptions and system interruptions. In such case, you cannot interrupt any commands which in the process of running on the CPU. Kernel snippets facing competitive risks often use this method, as disabling interruptions of such snippets can cause data synchronization failures or even damage to the overall system.
Our kernel team has written a sample driver to verify that you disabled interruptions by recording the failure to trigger the timer function within a specific period.
Another issue to figure out is which snippet of the long kernel code causes this problem.
This analysis involves conducting several little troubleshooting experiments, such as writing a kernel driver to disable interruptions and testing whether further information, such as the stack when disabling interruptions, are retrievable using various kernel tracking methods. Unfortunately, in the case of disabling interruptions, no method is applicable to retrieve the kernel stack in a lightweight way without affecting services.
In all actuality, the principle here is fairly simple. Hardware interruptions take precedence over conventional processes and software interruptions. After hardware interruptions are disabled, tracking methods at the common software layer will fail to work.
This problem lies in the memory resources of a tier-1 system, or, more particularly, the slab usage of the system, which happens to be much higher compared to a normal system.

The above snippet shows that dentry consumes a huge space in slabs. A dentry is an object that represents directories and files in the memory. It serves as a link to an inode. In most cases, high dentry usage means that the system hosts a large number of open files.
Next, we'll need to figure out the relationship between the large number of dentries and disabled interruptions in our specific scenario.
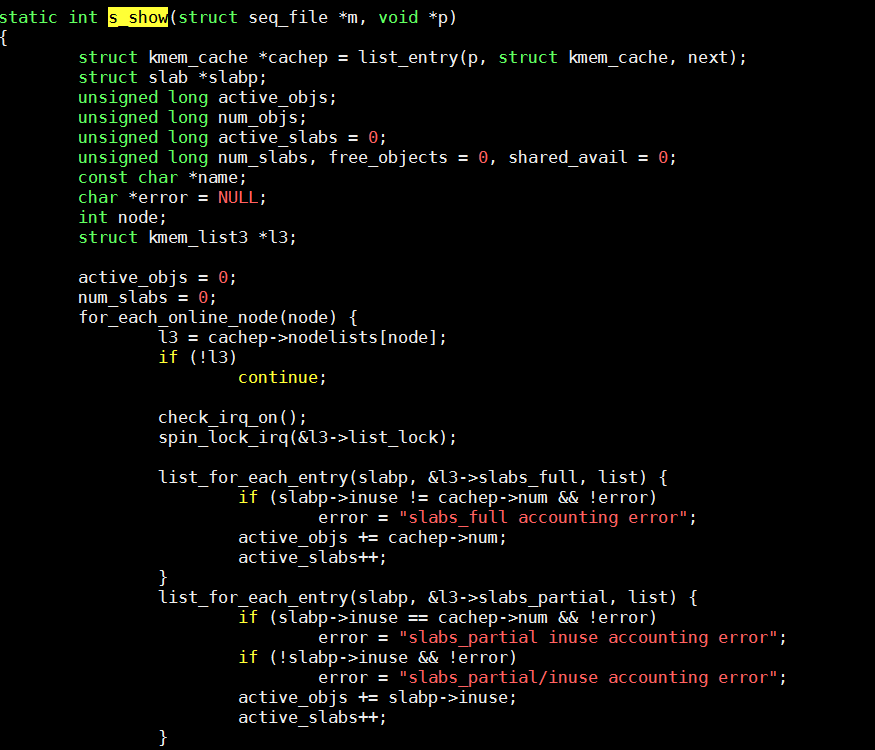
To do this, let's examine the following snippet from kernel 2.6.

This snippet shows the calculation of the total number of slabs. Traversing the linked list and calling the spin_lock_irq function before accessing the linked list helps to obtain the total number of slabs.
Next, the following describes the implementation of this function.
static inline void __spin_lock_irq(spinlock_t *lock){local_irq_disable();
Our result shows that during the statistical collection of slab information, the system disables interruptions, counts slabs by traversing the linked list, and then it enables interruptions again. The duration of the entire interrupt disabling depends on the number of objects in the linked list. If the list contains a large number of objects, the duration of interrupt disabling is also extremely long.
It is also easy to verify this problem. Run cat/proc/slabinfo to retrieve slab information and to call the function above. Then, conduct a ping test and check whether the test result is consistent with the preceding problem. If yes, then you can determine the cause of the problem.
At this point, we have found a way to alleviate the problem temporarily. Dentries exist as a part of the file system cache. In other words, a dentry is an object that the file system caches in the memory as disk stores the actual file information. Even if the cache is dumped, the system regenerates the dentry information later by reading disk files. Therefore, use a method similar to echo 2 > /proc/sys/vm/drop_caches && sync to release the cache, which alleviates the problem.
However, this is far from fully resolving the problem. Instead, we need to figure out the following key issues.
1) Which program repeatedly retrieves slab information to produce an effect similar to that when we ran cat/proc/slabinfo?
2) Why were so many dentries generated?
If you don't know the solutions to these issues, the problem may reoccur at any time in the future. Periodically performing cache dropping is not a sound and reliable solution.
Go ahead and formulate a method for tracking these issues on your own, and we will elaborate on the same later.
By Jiang Ran
OpenAnolis - September 4, 2025
ApsaraDB - October 24, 2024
Alibaba Cloud Native Community - March 14, 2023
Alibaba Cloud Native Community - May 4, 2023
Alibaba Cloud Native Community - December 11, 2023
Alibaba Cloud Native Community - December 20, 2024
 Bastionhost
A unified, efficient, and secure platform that provides cloud-based O&M, access control, and operation audit.
Learn More Managed Service for Grafana
Managed Service for Grafana displays a large amount of data in real time to provide an overview of business and O&M monitoring.
Learn More CEN
CEN
A global network for rapidly building a distributed business system and hybrid cloud to help users create a network with enterprise level-scalability and the communication capabilities of a cloud network
Learn More Alibaba Cloud Linux
Alibaba Cloud Linux is a free-to-use, native operating system that provides a stable, reliable, and high-performance environment for your applications.
Learn More