By Liu Biao and compiled by Maohe
This article is based on a presentation given by Liu Biao, an Apache Flink contributor. It consists of three parts: (1) definition of metrics; (2) how to use metrics; and (3) metrics monitoring practices.
Apache Flink allows collecting metrics internally to better understand the status of jobs and clusters during the development process. It is difficult to monitor the cluster status during runtime to see the speed of the cluster and ascertain whether any exceptions occur. It doesn't allow viewing task logs in real-time, so it's critical to figure out a way to process jobs effectively, especially when jobs are large or innumerable. Apache Flink allows job status monitoring based on metrics.
Metrics are divided into the following types:
1) Counter: If you have ever written MapReduce jobs, you should be familiar with counters. A counter counts the number of data records or megabytes of data, and its value continually increases over time.
2) Gauge: This is the simplest metric, which reflects a value. For example, if you want to monitor the Java heap memory usage, expose one gauge at a time. The current value of the gauge indicates the heap memory usage.
3) Meter: This metric measures throughput and counts the number of events in a unit of time. It is equivalent to calculating the ratio of the number of events to the elapsed time.
4) Histogram: This metric is complex and not commonly used. It is used to calculate the distribution of certain data, such as Quantile, Mean, StdDev, Max, and Min.
In Flink, metrics are organized into groups in a multi-layered structure. A metric is uniquely identified by two elements: a name and the group to which it belongs.
A metric group is divided into TaskManagerMetricGroup and TaskManagerJobMetricGroup. Each job belongs to a group under a task. Tasks are divided into TaskIOMetricGroup and OperatorMetricGroup. I/O statistics and metrics also exist under OperatorMetricGroup. The following figure shows the organizational structure of metrics. Metrics do not affect the system and belong to different groups. Flink allows adding groups to create a layered structure.
•TaskManagerMetricGroup
    •TaskManagerJobMetricGroup
        •TaskMetricGroup
            •TaskIOMetricGroup
            •OperatorMetricGroup
                •${User-defined Group} / ${User-defined Metrics}
                •OperatorIOMetricGroup
•JobManagerMetricGroup
    •JobManagerJobMetricGroup
The JobManagerMetricGroup is simple with fewer layers and assumes the role of master.
Metrics are automatically collected and used to compile statistics. View metrics from an external system and aggregate these metrics.
The system metrics provide details about the cluster status, such as:
•CPU
•Memory
•Threads
•Garbage Collection
•Network
•Classloader
•Cluster
•Availability
•Checkpointing
•StateBackend
•IO
For more information, see: https://ci.apache.org/projects/flink/flink-docs-release-1.8/monitoring/metrics.html#system-metricsIn addition to system metrics, Flink also supports user-defined metrics. The metrics discussed above are all system metrics. You can expose these metrics to monitor your business logic.
User-defined metrics are related to the DataStream API. The context may be required to write user-defined metrics for tables and SQL statements. However, user-defined metrics are written in a way similar to user-defined functions (UDFs).
The DataStream API is inherited from the RichFunction, providing a metrics interface. The getRuntimeContext().getMetricGroup().addGroup(…) method is derived from the RichFunction and provides the entry to user-defined metrics. This method allows you to create user-defined metric groups. To define specific metrics, you must likewise use the getRuntimeContext().getMetricGroup().counter/gauge/meter/histogram(…) method, which provides a constructor to define custom metric types.
Inherited from RichFunction
•Register user-defined Metric Group: getRuntimeContext().getMetricGroup().addGroup(…)
•Register user-defined Metric: getRuntimeContext().getMetricGroup().counter/gauge/meter/histogram(…)The following example illustrates how to use metrics. For example, define a counter and pass in a name. The default counter type is a single counter, which is a built-in implementation in Flink. Perform the inc() operation on the counter and obtain the results directly from the code.
For the meter metrics, Flink provides a built-in implementation called Meterview. A meter requires a time window to measure the interval at which events occur. The occurrence of an event can be registered with the markEvent() method. Then, the getrate() method is used to divide the number of events by the elapsed time.
The gauge metrics are simple, with the current time as the output and System::currentTimeMillis (passed in by using the Lambda expression) as the input. Upon each call, the gauge calls the current system time to perform a calculation.
The histogram metrics are relatively complex and have two code implementations in Flink, one of which is given below. A histogram needs a window size, which is assigned a value upon update.
These metrics are not thread-safe. If you want to use multithreading, add synchronization. For more information, visit the following link.
•Counter processedCount = getRuntimeContext().getMetricGroup().counter("processed_count"); processedCount.inc();
•Meter processRate = getRuntimeContext().getMetricGroup().meter("rate", new MeterView(60));
  processRate.markEvent();
•getRuntimeContext().getMetricGroup().gauge("current_timestamp", System::currentTimeMillis);
•Histogram histogram = getRuntimeContext().getMetricGroup().histogram("histogram", new DescriptiveStatisticsHistogram(1000)); histogram.update(1024);
•https://ci.apache.org/projects/flink/flink-docs-release-1.8/monitoring/metrics.html#metric-typesThere are three ways to obtain metrics: (1) View metrics on the WebUI; (2) Obtain metrics by using a RESTful API; and (3) Obtain metrics by using the metric reporter, which is the main method used in monitoring. RESTful APIs are program-friendly. You may use RESTful APIs to write automated scripts and programs, perform automated O&M and testing, and parse JSON-format responses.
How are metrics obtained in physical architecture?
With a better understanding of metrics and how they work, we can use them more effectively. The WebUI and RESTful APIs pull metrics from each component by periodically querying a central node. The fetched data is not necessarily updated in real-time. The default data update interval is 10s. Therefore, the data updated by the WebUI and RESTful APIs may not be real-time data. In addition, data may be fetched asynchronously. For example, if there are two components, data may be fetched from one component, whereas no data is fetched from the other component due to a timeout error. Fetching is a try-best operation, so the values of metrics may lag, but will be updated eventually.
The red paths in the following figure pass through MetricFetcher and are aggregated by a central node. The metric reporter collects metrics from individual nodes, and these metrics are not aggregated by a central node. These metrics are aggregated by a third-party system, such as the Time Series Database (TSDB). A non-centralized architecture has its own merits and is free of the problems produced by the central node, such as insufficient memory. The metric reporter directly reports raw data, which can be processed with better performance.
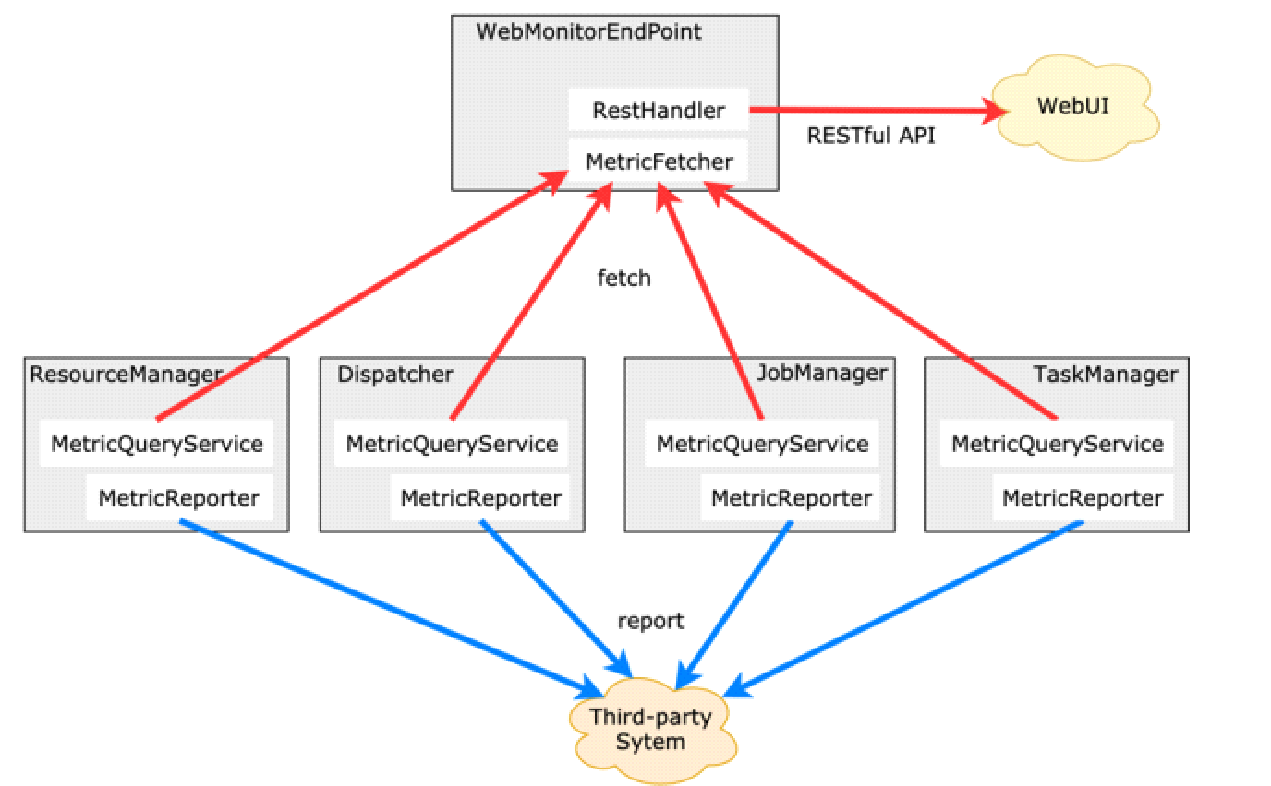
Flink offers many built-in reporters, which serve as references for the selection of an external system model. For example, Java Management Extensions (JMX) is a Java technology instead of third-party technology. InfluxDB, Prometheus, and Simple Logging Facade for Java (SLF4J) support easy debugging and direct logging. You can directly view logs in the provided logger. Flink provides a built-in log system, which generates logs in Flink's framework package. Click the following link to learn more.
•Flink offers many built-in reporters, which can serve as references for the selection of an external system model. For more information, see- https://ci.apache.org/projects/flink/flink-docs-release-1.8/monitoring/metrics.html#reporter.
•Metric Reporter Configuration Example
 metrics.reporters: your_monitor,jmx
 metrics.reporter.jmx.class: org.apache.flink.metrics.jmx.JMXReporter
 metrics.reporter.jmx.port: 1025-10000
 metrics.reporter.your_monitor.class: com.your_company.YourMonitorClass
 metrics.reporter.your_monitor.interval: 10 SECONDS
 metrics.reporter.your_monitor.config.a: your_a_value
 metrics.reporter.your_monitor.config.b: your_b_value
The preceding code shows how to configure metric reporters. Separate the name of the metric reporter with a comma (,). Find the reporter through classname reflection of metrics.reporter.jmx.class. Obtain the configuration of metrics.reporter.jmx.port, which is typically sent through a network by a third-party system. Determine the destination based on the IP address and port number. metrics.reporter.your_monitor.class is required. Define an interval, which is parsed by Flink and define config. as well.
Metrics are often used for automated O&M and performance analysis.
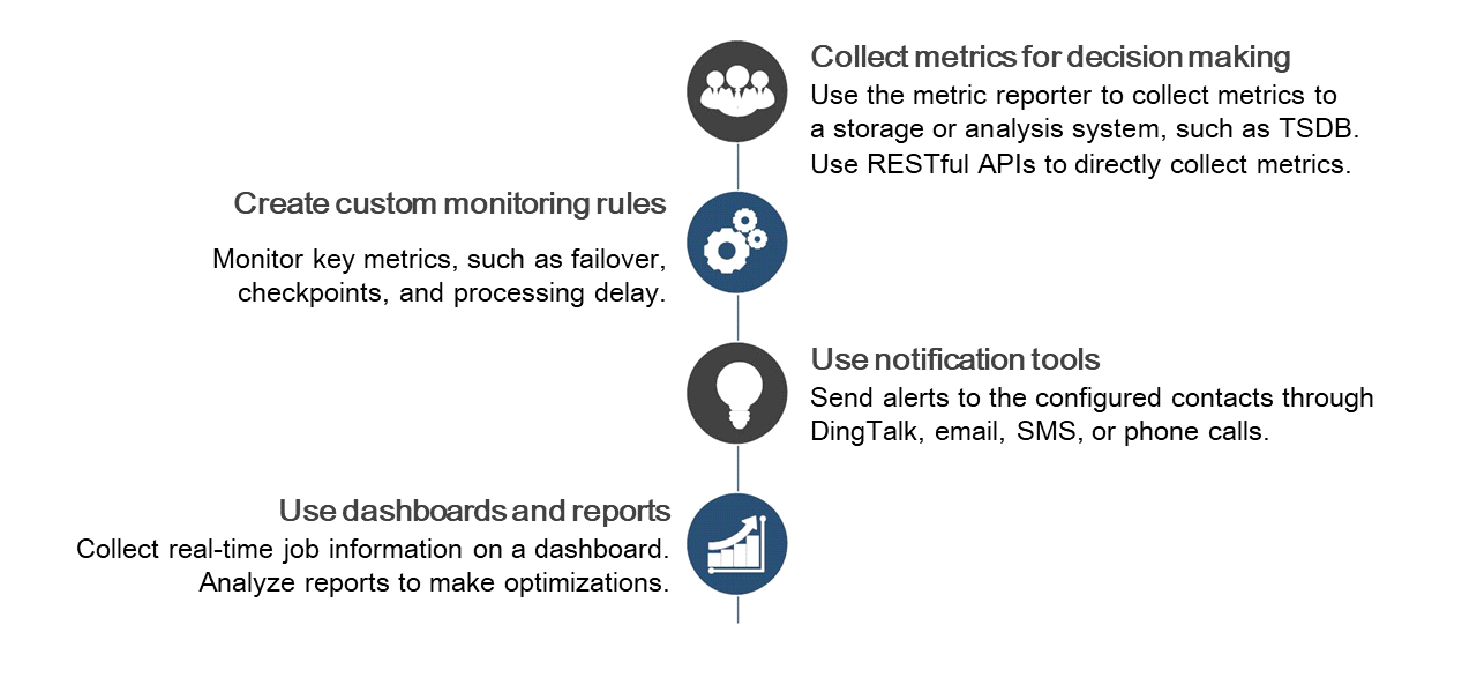
The automated O&M process is as follows:
The following figure shows the performance analysis process.
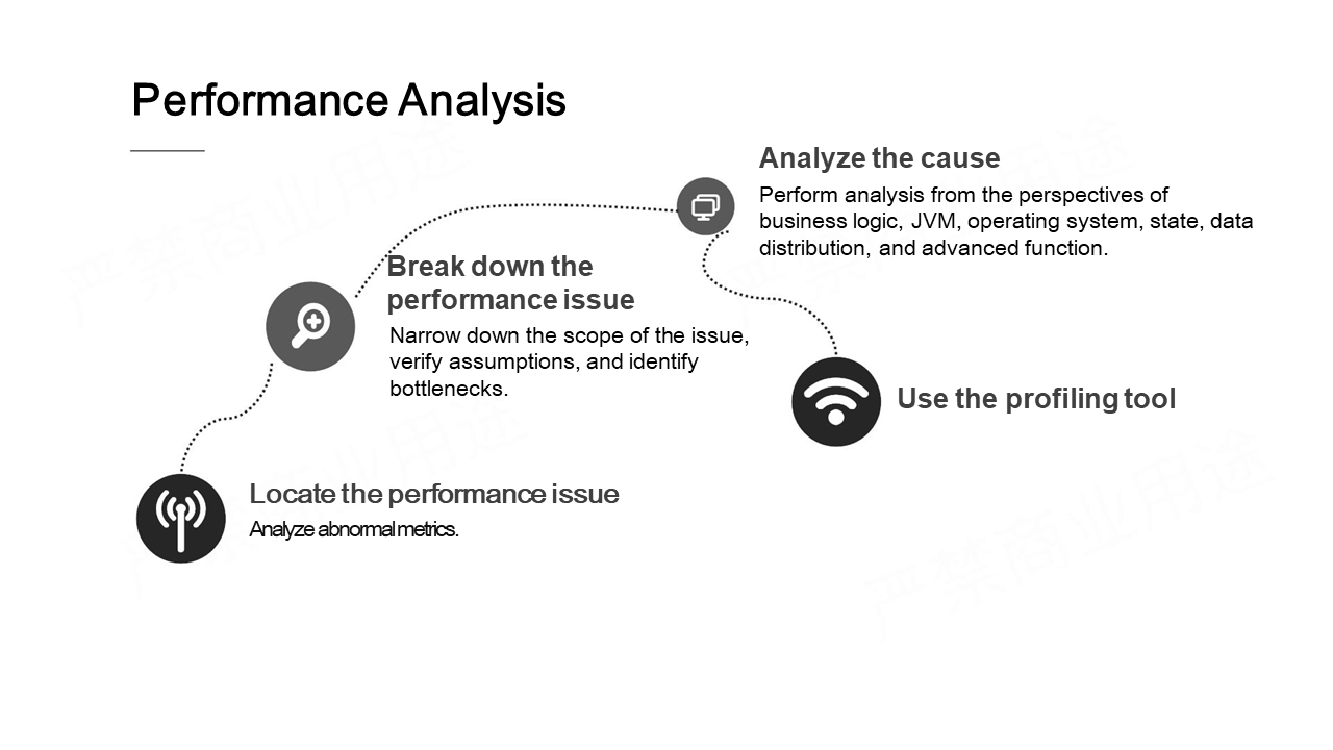
Promptly locate performance issues through a metrics system with monitoring and alert functions and conveniently analyze performance issues on a dashboard. For example, analyze system metrics to narrow down the scope of the issue, verify assumptions, and identify bottlenecks. Then, analyze possible causes from multiple perspectives, such as business logic, JVM, operating system, states, and data distribution. If the root cause still cannot be identified, resort to the profiling tool.
Problems with slow tasks are difficult to solve because they are related to the system framework. Just as a doctor needs to perform a series of examinations on the patient to narrow down the scope of possible conditions and diagnose the disease, we need to perform multiple rounds of analysis on slow tasks to identify the root cause.
If you are unfamiliar with how Flink works and do not understand the system runtime and status, analyze metrics to look into the system's internal workings. Some examples are provided below.
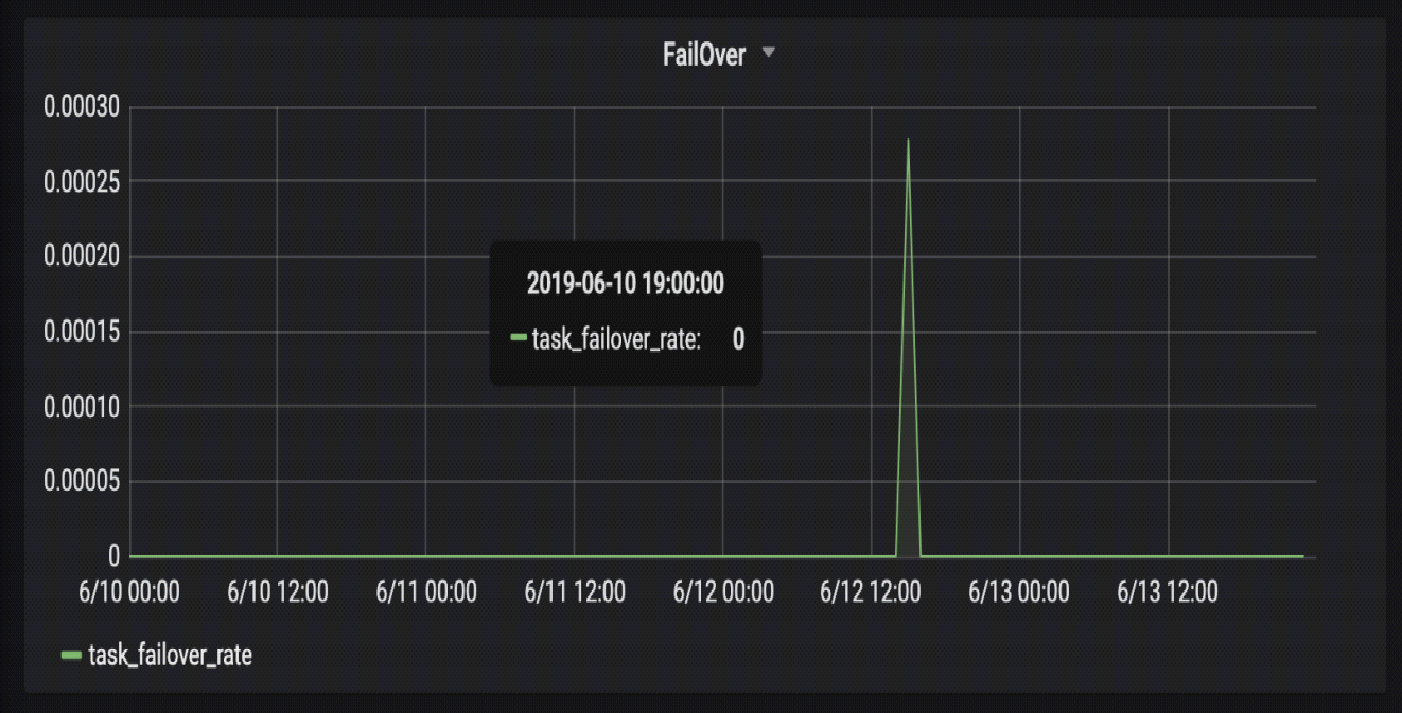
The following figure shows the metric that measures the task failover rate. Only one value is not 0, which indicates a problem.
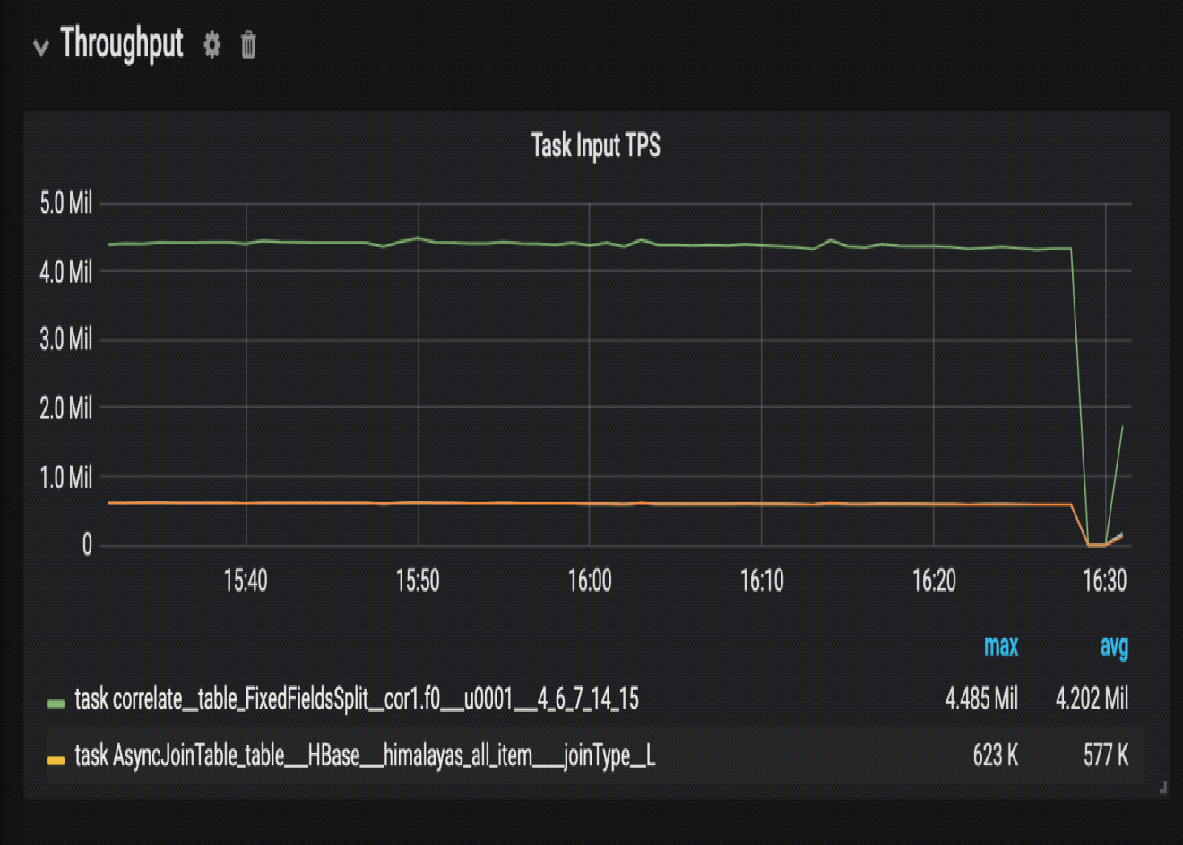
The following figure shows the metric that measures the task input TPS. The metric value suddenly drops from 4 or 5 million to 0, which indicates a problem.
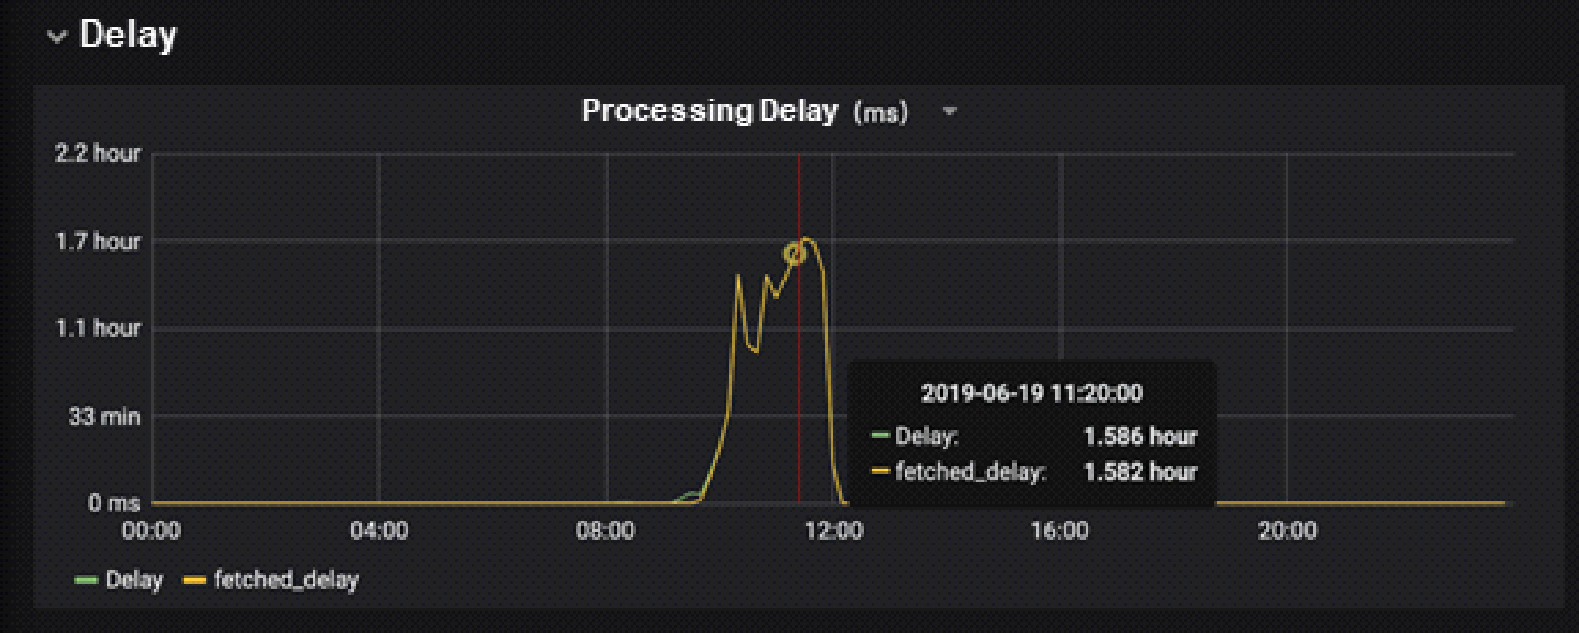
The following figure shows the metric that measures processing delay. Compare the generation time of the processed data with the current time to find that the processed data was actually generated 1 hour ago. This indicates a problem because the processed data should usually have been generated about 1s ago.
As shown by the red box in the following figure, the task processing speed slows down, but we do not know which task has caused the problem. The OUT_Q value rises to 100%, but other metrics are within their normal ranges or even indicate good performance. We can attribute the slow processing problem to the producer-consumer model. The producer's input queue (IN_Q) is full, and so is the consumer's output queue (OUT_Q). The processing speed of Node 4 is very slow and this node cannot promptly process the data generated by Node 1. However, Node 5 is running properly. This indicates the queue between Node 1 and Node 4 is blocked. Now, we can troubleshoot the problem by checking Node 1 and Node 4.

Each of the 500 InBps items has 256 PARALLEL operations, so it is impossible to view all the operations one by one. Therefore, during the aggregation, it is necessary to label the number of concurrent operations to which each index belongs. The aggregate operation divides the concurrent operations by label, allowing us to determine which concurrent operation has an OUT_Q value of 100%. As shown in the following figure, Line 324 and Line 115 show the maximum value. This further narrows down the scope of the problem.

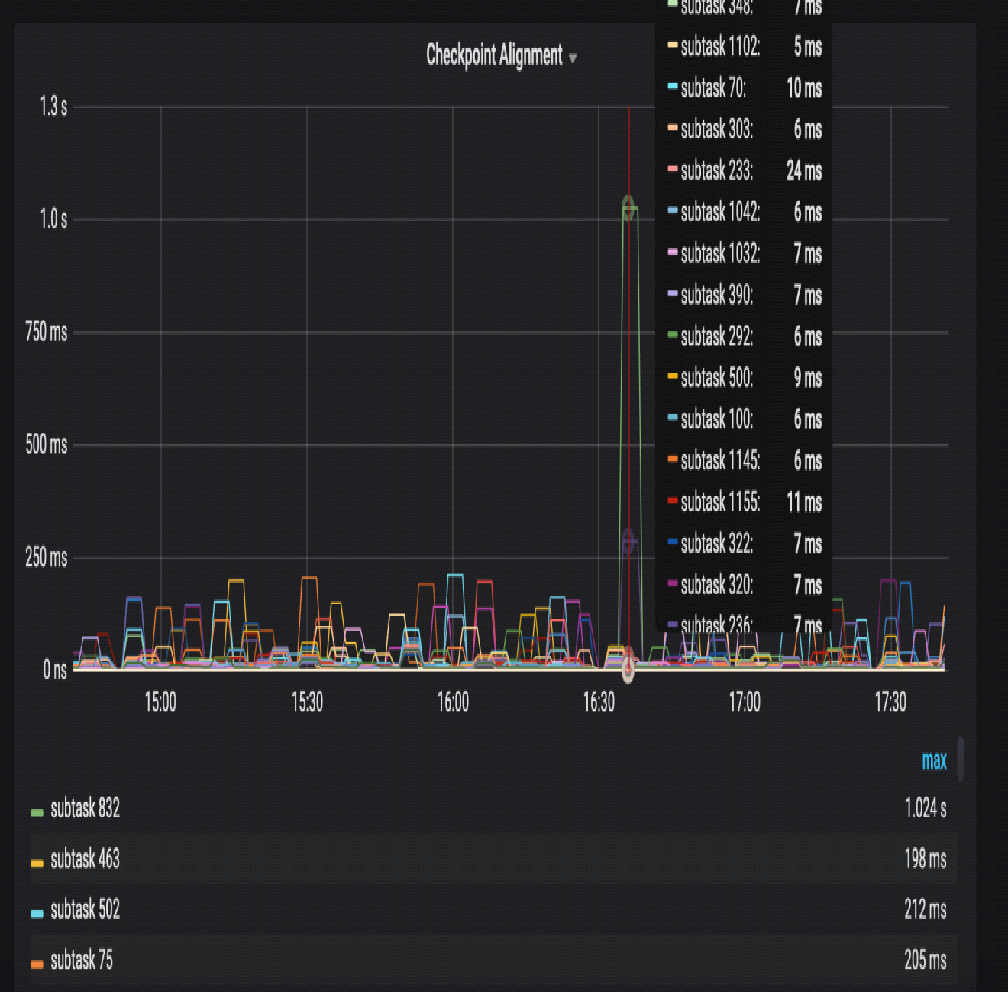
The following figure shows how to narrow down the scope of the problem by using metrics combined with checkpoint alignment. However, this method is rarely used.
This section explains how to analyze the problem of slow task processing.
In the case of slow task processing, we need to analyze the problem in a top-down manner, that is, from the business layer to the underlying system. Many problems can be analyzed from a business perspective. For example, analyzing whether concurrency is within the normal range, the data peaks and valleys, and the data skew. In terms of performance, it's possible to analyze garbage collection, checkpoint alignment, state backend, and system performance, which is measured by CPU utilization, memory usage, swap, disk I/O, throughput, capacity, network I/O, and bandwidth utilization.
Q) Metrics are used for internal system monitoring, So is it possible to use metrics as the output of log analysis in Flink?
Yes, but this is unnecessary since Flink processes the logs of other systems. Sink nodes directly export log analysis results or trigger alerts. Use metrics to collect statistics on the internal system statuses. Thus, the processing results of input data can be a direct output.
Q) Does each reporter have a dedicated thread?
Yes. Flink provides many threads. If a job is directly executed on the TaskManager, you can view the thread details by using the jstack command.
In-depth Analysis of Flink Job Execution: Flink Advanced Tutorials

172 posts | 48 followers
FollowApache Flink Community China - September 16, 2020
Apache Flink Community China - September 16, 2020
Apache Flink Community China - September 16, 2020
Apache Flink Community China - September 16, 2020
Apache Flink Community China - September 16, 2020
Alibaba Cloud Community - May 31, 2024

172 posts | 48 followers
Follow Realtime Compute for Apache Flink
Realtime Compute for Apache Flink offers a highly integrated platform for real-time data processing, which optimizes the computing of Apache Flink.
Learn More Message Queue for Apache Kafka
A fully-managed Apache Kafka service to help you quickly build data pipelines for your big data analytics.
Learn More Super App Solution for Telcos
Alibaba Cloud (in partnership with Whale Cloud) helps telcos build an all-in-one telecommunication and digital lifestyle platform based on DingTalk.
Learn More Media Solution
An array of powerful multimedia services providing massive cloud storage and efficient content delivery for a smooth and rich user experience.
Learn MoreMore Posts by Apache Flink Community
Start building with 50+ products and up to 12 months usage for Elastic Compute Service
Get Started for Free Get Started for Free