By Tonghui
As one of the four major technical directions of the Frontend Committee of Alibaba, the frontend intelligent project created tremendous value during the 2019 Double 11 Shopping Festival. The frontend intelligent project automatically generated 79.34% of the code for Taobao's and Tmall's new modules. During this period, the R&D team experienced a lot of difficulties and had many thoughts on how to solve them. In the series "Intelligently Generate Frontend Code from Design Files," we talk about the technologies and ideas behind the frontend intelligent project.
For a long time, accurately generating UI code from design files has imposed a heavy workload on frontend development engineers. Such work is repetitive and technically simple, but visual designers should put a lot of effort into going through the code and spending a significant amount of time in back-and-forth communication.
We can easily acquire definitive data using the plugins of design tools such as Sketch and Photoshop. Some images' features are prone to be lost, and image-based analysis can be more challenging. So, why do we still use images as the input source? Here are the reasons:
1) Images usually lead to clearer and definitive results in the production environment. Using images as the input source is not restricted by the upstream procedures of the production process.
2) Design files are different from the development code in layout. For example, design files do not support layouts such as listview and gridview.
3) Image-based frontend design is widely used in our industry. For example, an image-based approach supports automatic testing capabilities and allows comparing our data directly with competitors' products to enable business analysis. Other approaches do not support this.
4) Design files have stacked layers. The image-based approach can merge the layers better.
Image segmentation is an essential part of the image processing layer in the D2C project. It involves page analysis, complex background processing, layout recognition, and attribute extraction. This article shows how to analyze a page and then extract information from a complex background. During page analysis, an image is segmented into multiple blocks and then further divided into different nodes based on the content. During complex background processing, some overlay elements are extracted based on the page analysis.
This article focuses on the image processing capabilities of the intelligent D2C project. This capability layer is mainly responsible for recognizing element categories and extracting styles in images. It also provides support for the layout algorithm layer.
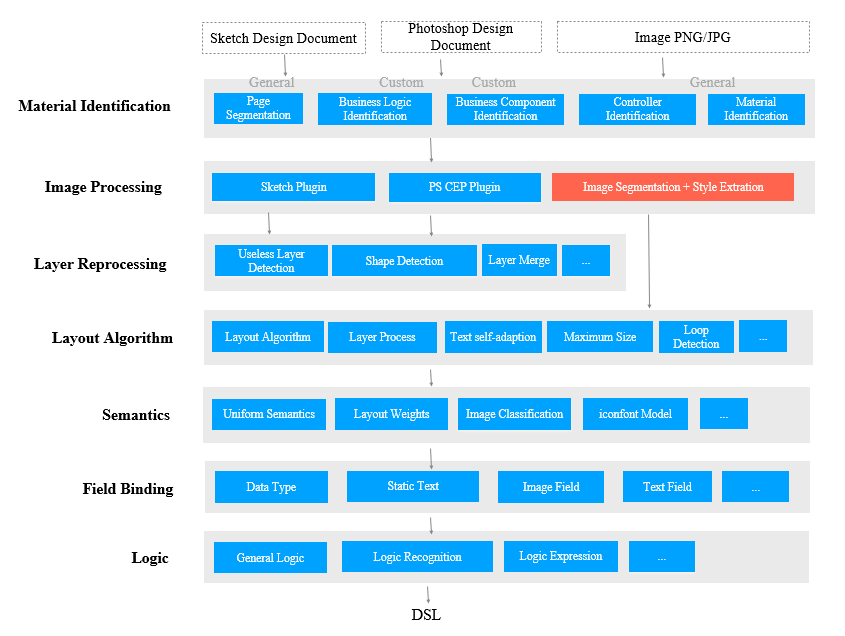
In page analysis, we deal with the foreground module extraction and background analysis of UI images to extract GUI elements from the design files by using a foreground-background separation algorithm.
1) Background analysis: In background analysis, we analyze the colors, gradient direction, and connected components of the background using machine vision algorithms.
2) Foreground analysis: In foreground analysis, we organize, merge, and recognize GUI fragments using deep learning algorithms.
The key to background analysis is to find the background's connected components and closed intervals. The specific steps are:
Step 1: Determine background blocks and calculate the gradient direction using an edge detection method such as Sobel, Laplacian, and Canny, in order to obtain the pure-color background regions and gradient background regions. A discrete Laplace operator-based template for extracting background regions is as follows:

We can also collect statistics about the background's motion tendency to find whether the background has gradients. If the background has gradients, refinement processing is performed in step 2.
Step 2: Select seed nodes based on the flood fill algorithm in order to filter out noise in the gradient background regions.
def fill_color_diffuse_water_from_img(task_out_dir, image, x, y, thres_up = (10, 10, 10), thres_down = (10, 10, 10), fill_color = (255,255,255)):
    """
    Flood fill: changes the image
    """
    # Acquire the height and the width of the image.
    h, w = image.shape[:2]

    # Create a mask layer sized h+2 and w+2.
    # Note that OpenCV stipulates that
    # the shape of the layer must be sized h+2 and w+2 with 8 bits per channel.
    mask = np.zeros([h + 2, w + 2], np.uint8)

    # Perform a flood fill. The parameters are follows:
    # copyImg: the image on which the flood fill is to be performed.
    # mask: the mask layer.
    # (x, y): the fill start location (starting seed node).
    # (255, 255, 255): the fill value, which indicates the white color.
    # (100,100,100): the maximum negative difference between the starting seed node and the pixel values of the entire image.
    # (50,50,50): the maximum positive difference between the starting seed node and the pixels values of the entire image.
    # cv.FLOODFILL_FIXED_RANGEL: the image processing method, which is usually used to process color images.
    cv2.floodFill(image, mask, (x, y), fill_color, thres_down, thres_up, cv2.FLOODFILL_FIXED_RANGE)
    cv2.imwrite(task_out_dir + "/ui/tmp2.png", image)
    # The mask is an import region, which displays the filled regions and the colors filled in these regions.
    # For UI automation, the mask can be set to a shape that uses the maximum width and height as the size.
    return image, mask
The comparison between the source image and the processed image is as follows:

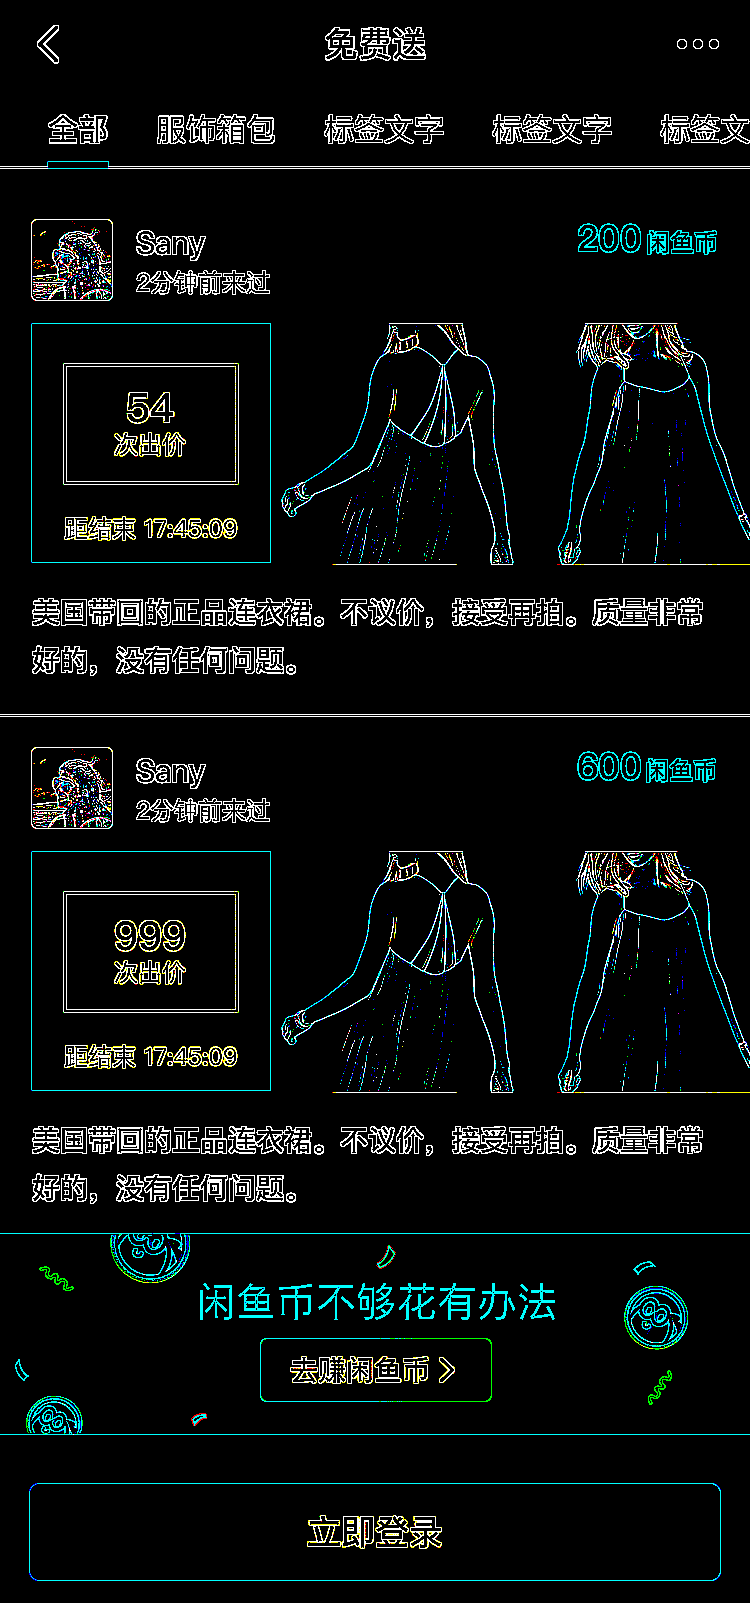
Fig: Comparison between the source image and the processed image
Step 3: Extract GUI elements through layout segmentation.

Fig: Content modules extracted after background analysis
Now, we have successfully layered the image and extracted content modules from it. More details can be obtained from foreground analysis and extracted from a complex background.
The key to foreground analysis lies in complete component segmentation and recognition. We perform connected-component analysis to prevent component fragmentation, recognize component types through machine learning, and then combine the fragments by component types. Then, we repeat these operations until there is no feature fragment or attribute fragment. Take the extraction of a complete item from a waterfall flow as an example:

Fig: Sections marked in red are the hard nuts to crack
Using a page on Xianyu (a popular customer-to-customer buy-and-sell platform for secondhand goods in China) as an example, recognizing cards in the waterfall flow is important for implementing layout analysis. When a card is displayed completely in a screenshot image (icons over the card are allowed), it needs to be fully recognized. However, if the background covers the card, the covered part should not be recognized. As the preceding figure shows, waterfall flow cards have various styles and are displayed compactly. As a result, some components may be missed, and errors may occur during detection.
We can use conventional edge gradient based or connected-component based image processing methods to extract the contours of waterfall flow cards based on the images' grayscales and shape features. These methods provide high performance in terms of IoU score and computation speed. However, these methods are susceptible to interference and have a low recall rate.
Object detection based or feature point detection based deep learning methods learn style features of the cards in a supervised manner. These methods are not easily affected by interference and have a high recall rate. However, their IoU score is lower than conventional image processing methods as they involve a regression process. They also require massive amounts of manual labeling effort, resulting in slower computation.
Inspired by ensemble learning, we combined conventional image processing methods with deep learning methods to leverage their respective advantages in order to obtain recognition results with high precision, high recall, and high IoU scores.
The following figure shows the process of a conventional image processing algorithm:
1) Convert the input waterfall flow card image into a grayscale image and enhance the grayscale image using the contrast limited adaptive histogram equalization (CLAHE) algorithm.
2) Perform edge detection with the Canny operator to obtain a binary image.
3) Perform morphology-based expansion on the binary image to connect the disconnected edges.
4) Extract the outer contours of continuous edges and discard those covering relatively small areas to obtain the candidate contours.
5) Perform rectangular approximation with the Douglas-Peucker algorithm and keep contours closely resembling a rectangle as the new candidate contours.
6) Project the candidate contours obtained in Step 5 in the horizontal and vertical directions to obtain smooth contours in the final result.

Fig: Process of a conventional image processing algorithm
Steps 1 to 3 of the algorithm are edge detection steps.
The image quality may degrade due to various factors. Therefore, the image needs to be enhanced to improve edge detection performance. It is not the best choice to equalize the entire image with a single histogram, as the contrast may vary significantly in different regions of the captured waterfall flow image. This may result in artifacts in the enhanced image. Some researchers have suggested using the adaptive histogram equalization (AHE) algorithm in single-histogram scenarios, as it is based on block processing. However, the AHE algorithm may amplify noise on edges.
Later based on AHE, some researchers proposed using Contrast Limited AHE (CLAHE) to eliminate noise interference using a contrast threshold. As the below histogram shows, parts exceeding the histogram threshold are not discarded when using CLAHE, instead evenly distributed in other bins.

Fig: Histogram-based equalization
The Canny operator is a classical edge detection operator that can be used to obtain accurate edge positions. Canny edge detection usually involves the following steps:
1) Perform noise reduction through Gaussian filtering.
2) Calculate the gradient's value and direction with the finite-difference method based on the first-order partial derivative.
3) Perform non-max suppression on the gradient value.
4) Detect and connect edges using double thresholds. We have made multiple attempts during the process to select the optimal dual-threshold parameters.
The detected edges may be disconnected at some points. We can use the morphology-based expansion method on the binary image using structural elements of specific shapes and sizes to connect the disconnected edges. The following figure shows the edge detection results. The result in (c) is obtained through CLACHE in which the contrast threshold is set to 10.0, and the region size is set to (10,10). The result in (d) is obtained by performing Canny detection in which the dual thresholds are set to (20,80). The result in (e) is obtained by performing morphology-based expansion and using a cross-shaped structural element sized (3,3).
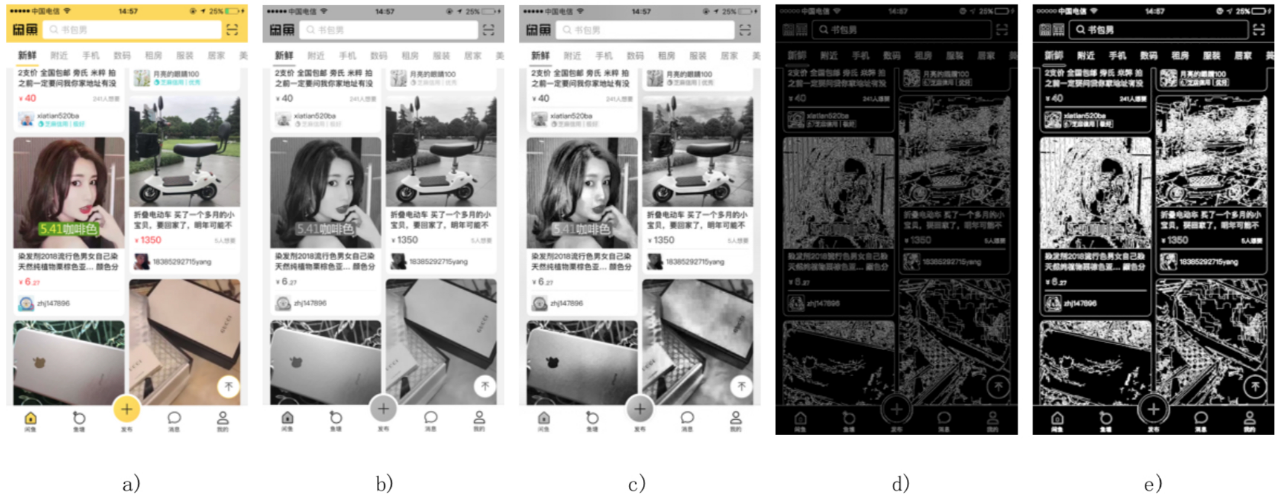
Fig: Results obtained through conventional image processing
In the algorithm process, steps 4 to 6 are contour extraction steps. After the morphology-based expansion is performed on the binary images, outer contours with continuous edges are extracted first. As the following figure shows, a binary image has regions containing only 0 or 1 bits. We assume that the S1 region consists of background points with a pixel value of 0. The S2 region consists of foreground points with a pixel value of 1. The B1 outer contour consists of the outermost foreground points, and the B2 inner contour consists of the innermost foreground points. We can assign different integer values to different contour edges by scanning the binary image to determine the contours' types and the layering relationships. After extracting the outer contours, we calculate the areas covered by the outer contours and discard those covering relatively small areas to obtain the initial candidate contours.
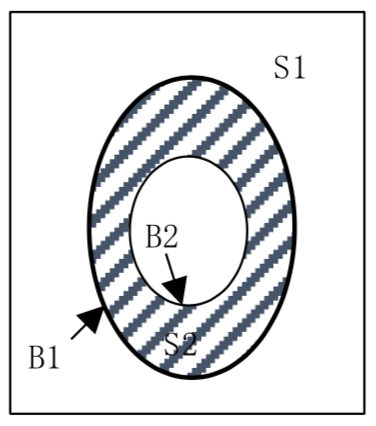
Fig: Contour extraction
The contours of waterfall flow cards on the Xianyu page are approximate rectangles with arc-curved corners. We perform rectangular approximation on the extracted candidate contours with the Douglas-Peucker algorithm and keep contours that resemble a rectangle. After that, we use the Douglas-Peucker algorithm to fit a group of points representing a curve or a polygon to another group with fewer points to make the distance between the two groups of points meet a specified precision. By doing this, we can obtain the second version of candidate contours.
When we have the second version, we project the initial candidate contours at the positions of the second version of candidate contours in the horizontal and vertical directions to remove burrs and obtain rectangular contours.
The following figure shows the contour extraction results. The result in (c) is obtained by setting the contour area threshold to 10000. The result in (d) is obtained by setting the precision to 0.01 °¡ contour length in the Douglas-Peucker algorithm. All extracted contours in this article contain input fields.
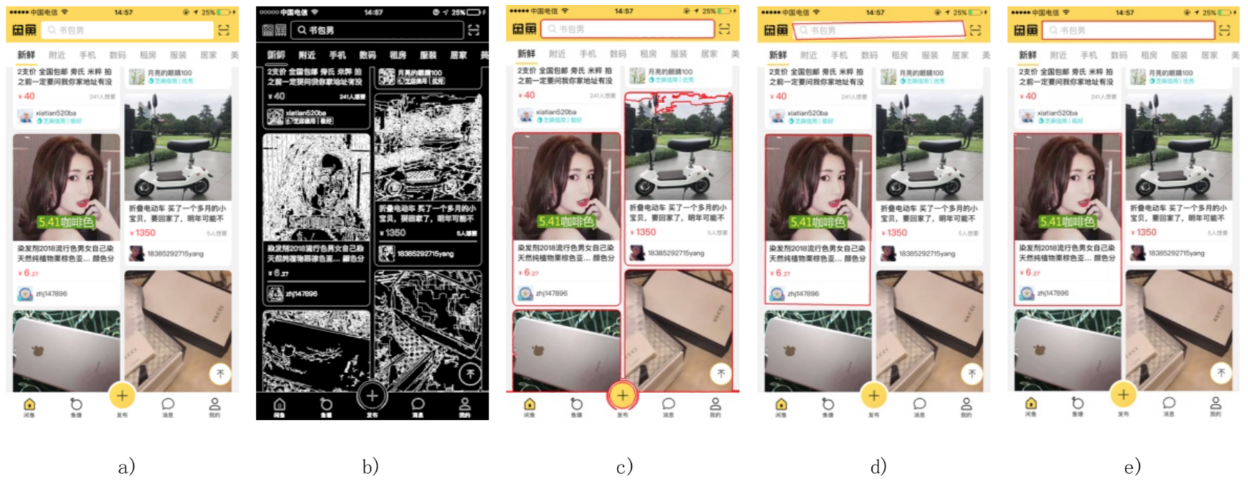
Fig: Recognition results obtained by using different methods
Let's take a look at how machine learning-based image processing works.
In conventional algorithms, contour features are extracted with conventional image processing methods. The problem is that when the image is not clear enough or is covered, the contours cannot be extracted. So, the recall is poor.
More representative and distinctive features can be learned based on massive amounts of sample data using a convolutional neural network-based object detection algorithm. Currently, object detection algorithms are classified into two families: two-stage algorithms represented by Regions with Convolutional Neural Network (R-CNN), and single-stage algorithms represented by You Only Look Once (YOLO) and Single Shot MultiBox Detector (SSD).
Single-stage algorithms directly categorize and perform regression on predicted objects. These algorithms are fast but have lower mean average precision (mAP) than that of two-stage algorithms. If you use two-stage algorithms, you must first generate candidate object regions before classification and regression on predicted objects. This enables easier convergence during training. Therefore, these algorithms have higher mAP but slower computation speed than that of single-stage algorithms.
Regardless of whether you use a single-stage algorithm or a two-stage algorithm, perform the general object detection process as follows: The first step is to process an input image in a feature extraction network (select a mature CNN based on VGG, Inception, or Resnet) to learn image features. Then process features of specified regions separately in a classifier and a regressor for classification and position regression. By doing this, you can obtain the categories and positions of the bounding boxes.

Fig: Workflow of an object detection network
The greatest benefit of using Faster R-CNN is that it integrates the process of generating candidate target regions into the entire network. This significantly improves the overall performance, especially in terms of detection speed. The following figure shows the basic structure of Faster R-CNN.
A Faster R-CNN model consists of four main parts:
1) Convolutional layers: As a feature extraction network, the Faster R-CNN extracts image features using a group of basic layers (the convolutional layers, ReLU, and pooling layers). These features are shared in the region proposal network (RPN) and the fully connected layer.
2) The region proposal network (RPN): The RPN is used to generate candidate bounding boxes, determine whether a candidate bounding box belongs to the foreground or the background by using the softmax function, and perform regression on the candidate bounding boxes to correct the positions of the candidate bounding boxes.
3) The region-of-interest (RoI) pooling layer: In this layer, input images and candidate regions are collected. Then the candidate regions are mapped to fixed sizes and passed to the fully connected layer.
4) Classifier: The classifier calculates the specific categories of the candidate bounding boxes and performs regression again to correct the positions of the candidate bounding boxes.
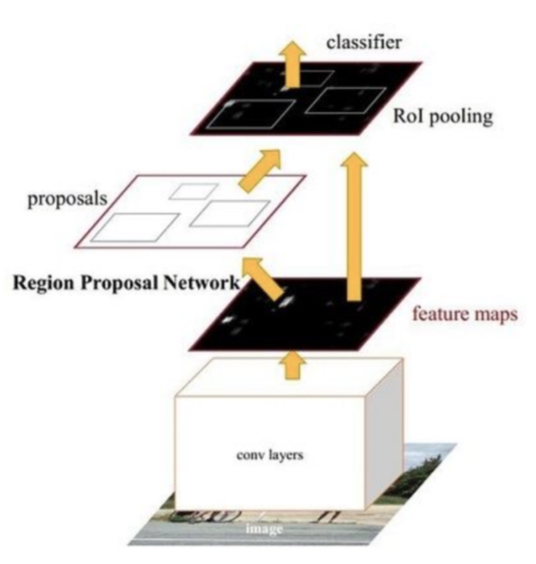
Fig: Structure of the object detection network
The results of recognizing the waterfall flow cards by using the Faster R-CNN are shown in the following figure.
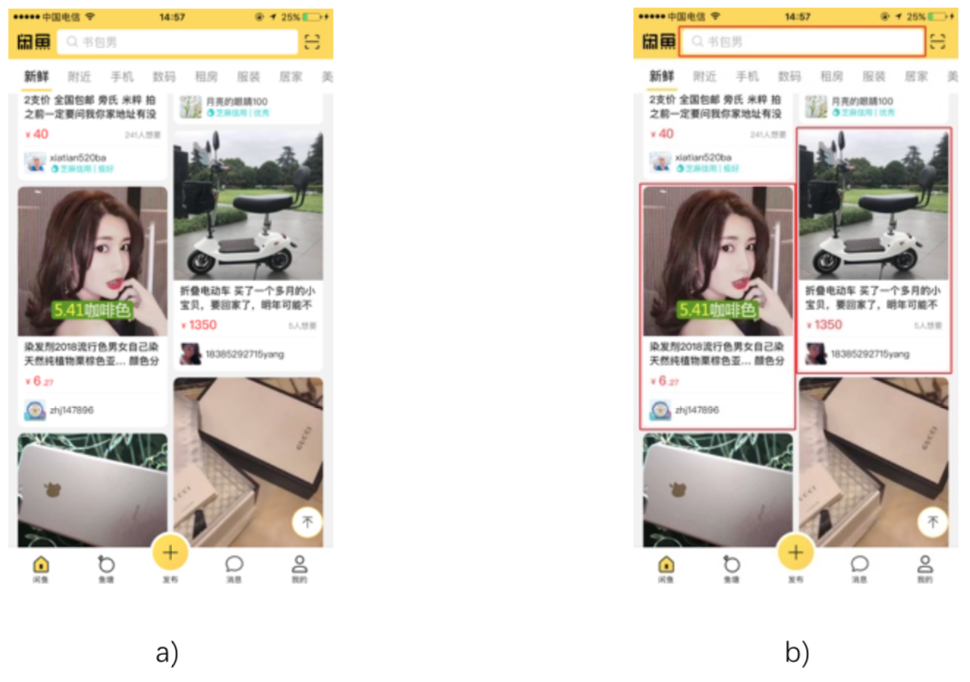
Fig: Object detection results
We can use conventional image processing algorithms to obtain card recognition results with high IoU. However, the conventional algorithms' recall is poor, and the card on the right side is not detected. The object detection based deep learning algorithm has high generalization abilities and can achieve a relatively high recall. However, card positions cannot be obtained with high IoU during the regression process. As shown in Image (c) of the following figure, all cards are detected, but the edges of two cards overlap with each other.
We can obtain detection results with high precision, recall, and IoU scores by combining the results obtained using these two algorithms. The combination process is as follows:
1) First, we obtain the bounding boxes (trboxes and dlboxes) of the cards. We do this by using a conventional image processing algorithm and a deep learning algorithm in parallel. In this approach, a trbox is used as the benchmark of IoU, and a dlbox as the benchmark of precision and recall.
2) Select a trbox. When the IoU of a trbox and a dlbox is greater than a specified threshold (for example, 0.8), keep the trbox and name it as trbox1. Otherwise, discard it.
3) Select a dlbox. When the IoU of a dlbox and trbox1 is greater than a specified threshold (for example, 0.8), discard the dlbox. Otherwise, keep this dlbox and name it as dlbox1.
4) Correct the position of dlbox1. Move each edge of dlbox1 to the nearest straight line to obtain a corrected dlbox. Do not move the edge by more than the specified movement threshold (for example, 20 pixels) and the moved edge cannot cross any edge of trbox1. Then name this corrected dlbox as dlbox2.
5) Combine trbox1 and dlbox2 to obtain the final bounding box of a card.
Results:
Take a look at a few basic metrics first.
True Positive (TP): the number of samples the model correctly predicts as positive.
True Negative (TN): the number of samples the model correctly predicts as negative.
False Positive (FP): the number of samples the model incorrectly predicts positive.
False Negative (FN): the number of samples the model incorrectly predicts as negative.
Precision = TP/(TP + FP): The ratio of actual positive samples to the samples predicted as positive.
Recall = TP/(TP + FP): The ratio of samples the model correctly predicted as positive to the total number of samples correctly predicted.
Intersection over Union (IoU) = The size of the intersection set of two boxes/The size of the union set of the two boxes
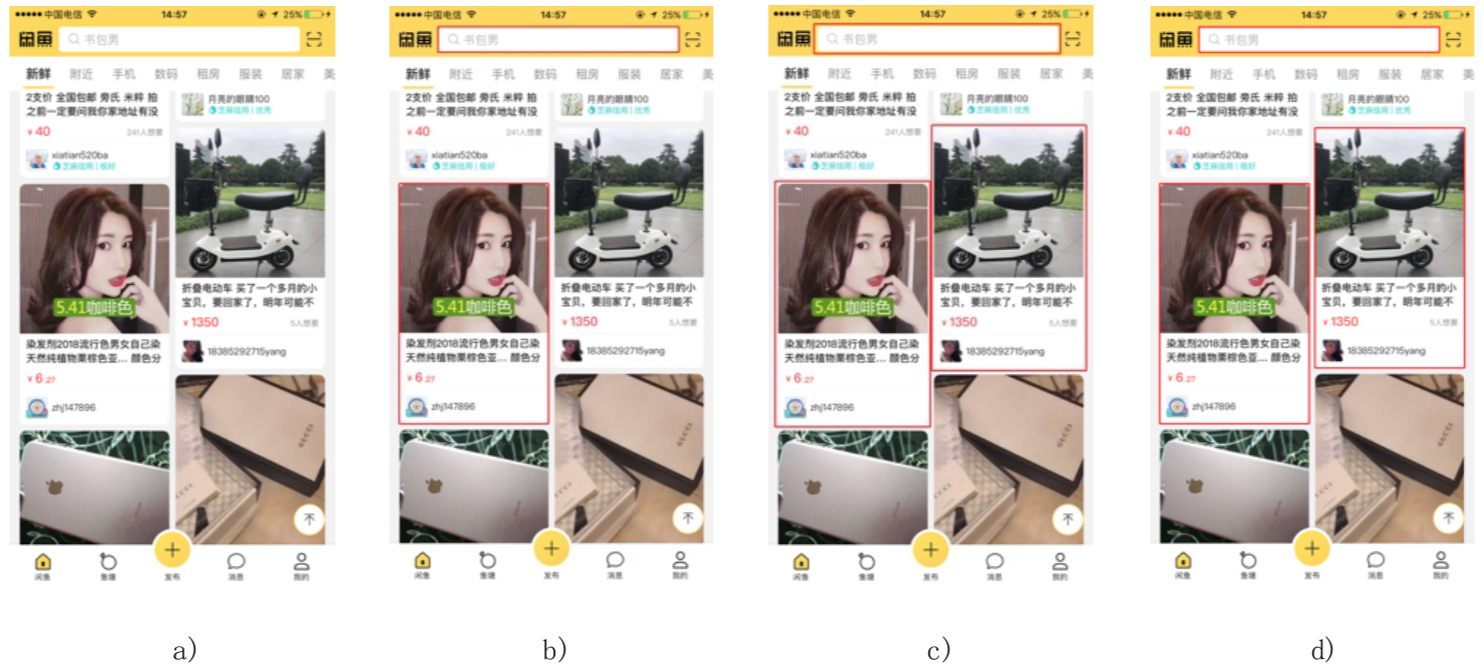
Fig: Detection results obtained in other ways
The preceding figure shows the recognition results of two cards obtained by using different algorithms. The result in (d) is better than that in (b) because it has a higher recall. The result in (d) is better than that in (c) because it has a higher IoU. The recognition results of some sample images are shown in the following figures. Each figure shows the comparison of recognition results obtained by using different algorithms. The first image of each figure from left to right is the input image; the second shows a card recognized by using a conventional image-processing algorithm, the third shows two cards recognized by using a deep-learning algorithm, and the last shows two cards recognized by using the ensemble method.
In the first and second figures, the contours of the cards are recognized accurately.
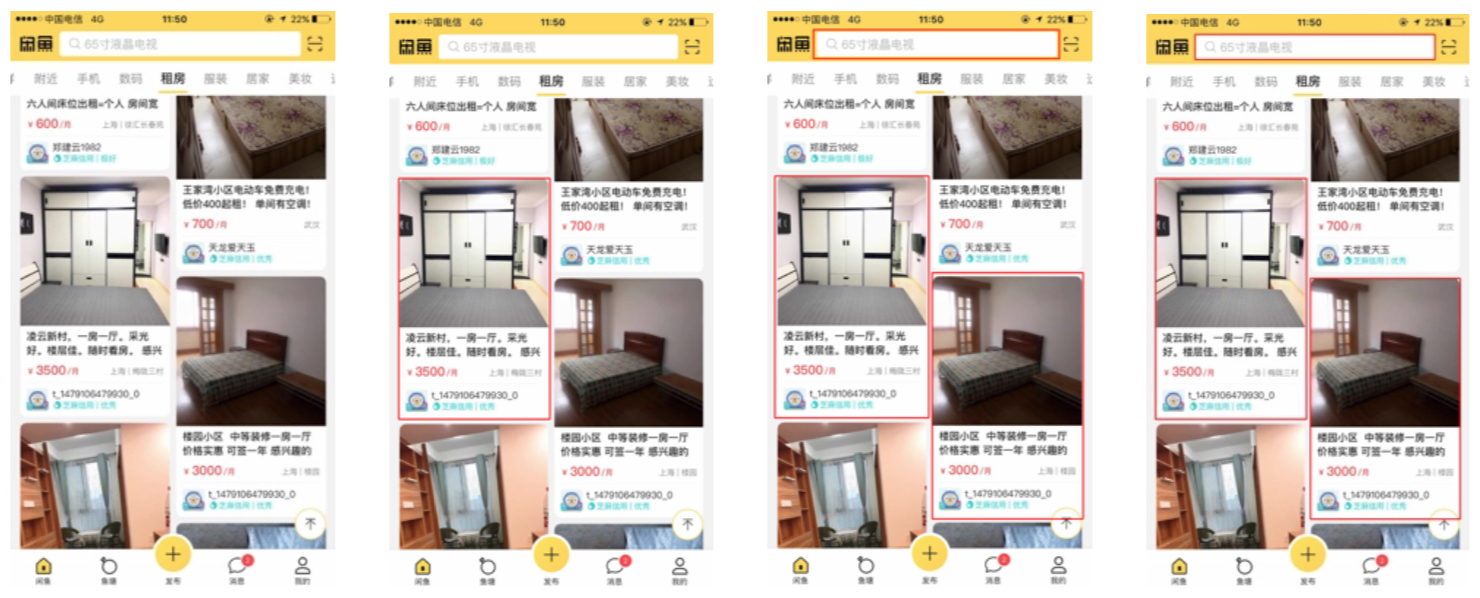

Fig: Example 1 of foreground recognition results
The lower edges of the cards recognized by using the ensemble method shown in the third figure do not align with the l lower edges of the cards. This issue is caused because when the position of dlbox1 was corrected in the combination process, a conventional image-processing algorithm was used to look for the nearest straight line for each edge of the card's bounding box. The straight lines obtained were not the cards' edges because the cards' styles were different.
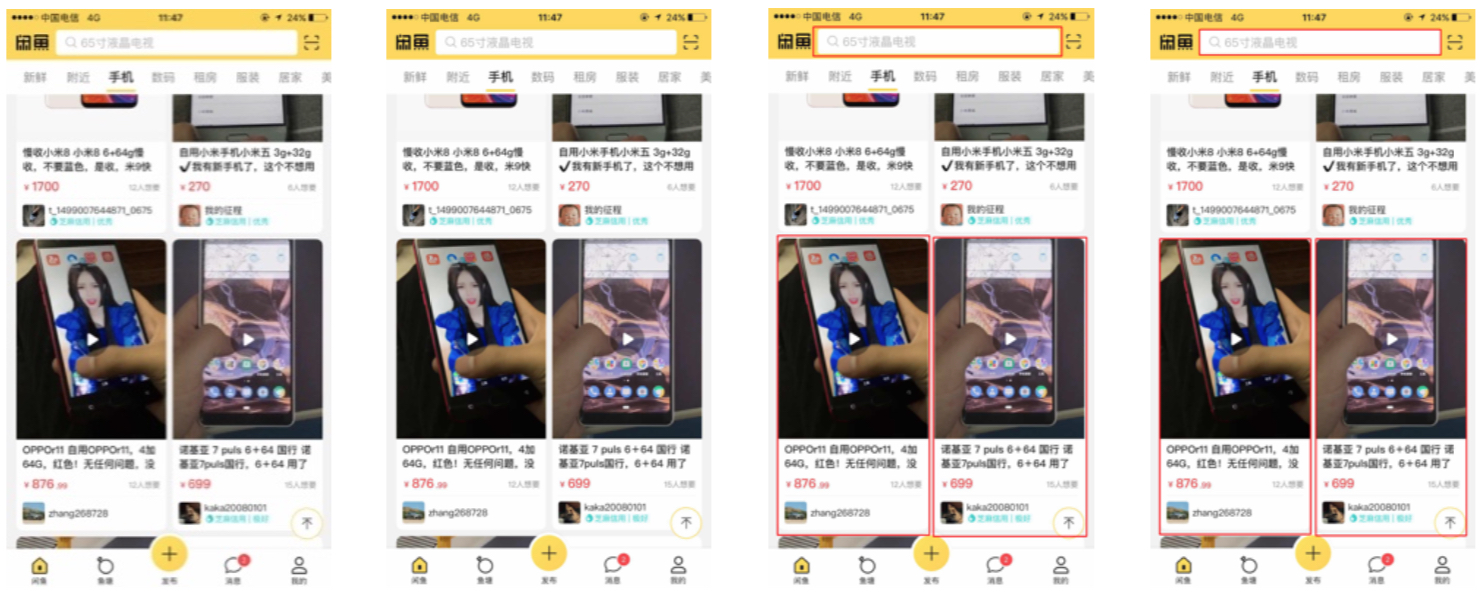
Fig: Example 2 of foreground recognition results
In our test, we randomly captured 50 screenshots with waterfall flow cards on Xianyu pages. These screenshots include a total of 96 cards (excluding input fields). Each image is processed separately by using a conventional image processing algorithm, a deep learning algorithm, and an ensemble method to obtain the card recognition results. A total of 65 cards are recognized by using the conventional image processing algorithm, 97 cards are recognized by using the deep learning algorithm, and 98 cards are recognized by using the ensemble method. The precision, recall, and IoU scores are shown in the following table. The recognition results obtained through the ensemble method demonstrate the advantages of both conventional image-processing algorithms and deep-learning algorithms: high IoU and recall.
Results obtained using different algorithms:

Foreground processing is illustrated with the process of recognizing waterfall flow cards on Xianyu pages. Machine vision algorithms, along with machine learning algorithms, are used to complete foreground element extraction and recognition.
We described foreground element extraction and background analysis. Then we proposed an ensemble method in which conventional image processing algorithms are combined with deep learning algorithms to obtain recognition results with high precision, recall, and IoU. However, this approach still has some drawbacks. For example, the correction of component elements in the combination process is affected by the image style. We will optimize this part in the future.
Content extraction from a complex background is to extract specific content from a complex background, for example, extracting specific text or overlay layers from an image.
This is a challenge for the entire machine vision industry. Conventional image processing algorithms have disadvantages in precision and recall and cannot resolve semantic problems. Mainstream machine learning algorithms also have their drawbacks. For example, object detection algorithms cannot obtain the pixel-level position information, while semantic segmentation can extract pixels but cannot get pixel information existing before the translucent overlay is added.
This article describes a new solution that combines an object detection network with a generative adversarial network (GAN) to solve these pain points. We use the object detection network to implement content recall and the GAN to implement extraction and restoration of specific foreground content in a complex background.
The complex-background processing involves the following steps:
Content recall: The object detection network is used to recall elements and determine whether these elements need to be extracted from the background.
Region determination: Verify whether the current region is a complex region using a machine vision algorithm such as a gradient-based algorithm.
Simple region: Locate the background blocks by using a gradient-based algorithm.
Complex region: Extract content by using a super-revolution generative adversarial network (SRGAN).
We can implement content recall by using an object detection network such as Faster R-CNN and Mask R-CNN, as the following figure shows:

We can calculate the peripheral gradient using the Laplace operator to determine whether the current region is a complex region.
Pixel-level precision cannot be achieved due to the object detection model's limitation. Therefore, position correction needs to be performed. Positions can be corrected based on gradients in a simple background. The specific calculation process is as follows:
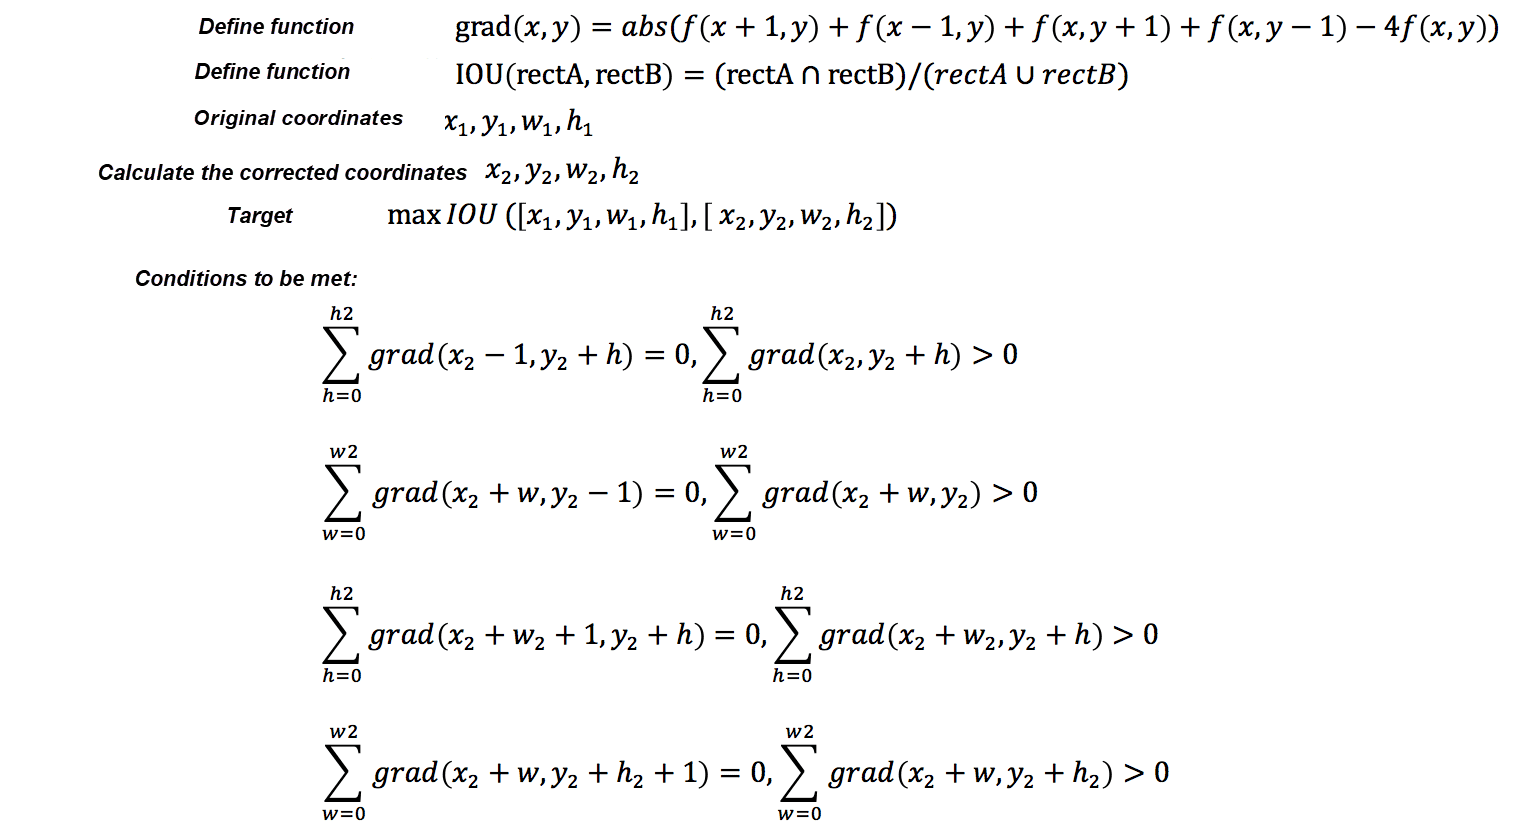
Fig: Position correction formulas for a simple background
The following figure shows a complex background. On the left is the source picture, and the image on the right shows the extracted text block.

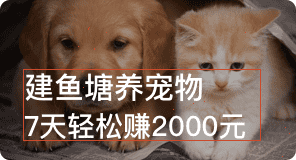
Fig: Source image and text region
You can see that the extracted blocks are not entirely correct. In this case, the positions cannot be corrected by using machine vision algorithms. This article proposes a solution for extracting content from a complex background by using a GAN. The following figure shows a GAN's main structure.
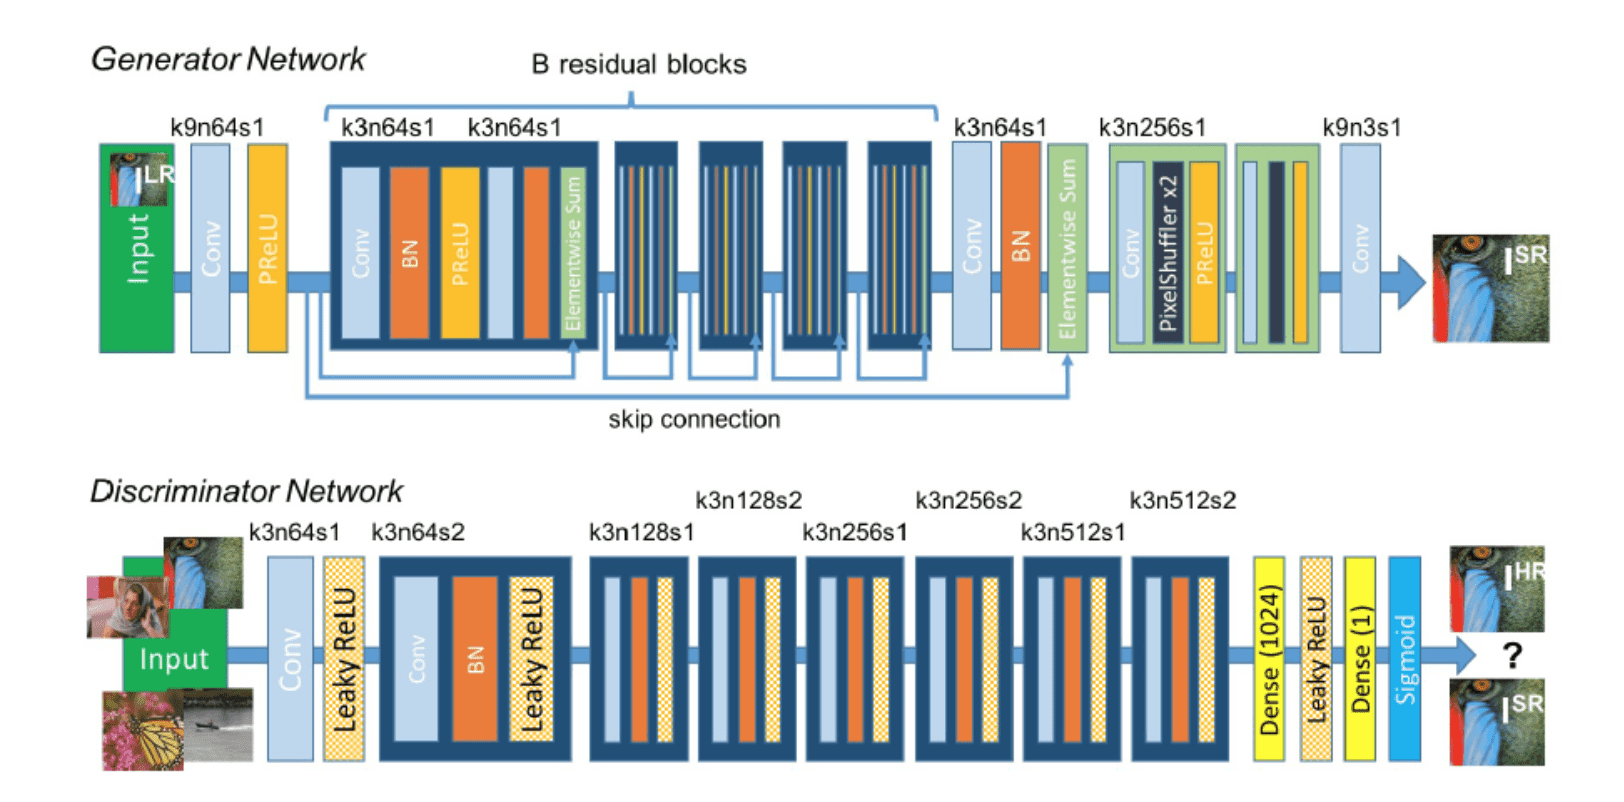
Fig: Structure of a GAN
1) Based on the SRGAN, a loss function of the feature map is added to the GAN. In this way, high-frequency information can be better preserved to preserve the edges. The feature map's loss function is defined as follows:

Fig: Loss function of the feature map
In this equation, the loss function is represented by the squared difference between the original image's feature value and that of the generated image.
2) The loss function rate can significantly reduce the false detection.
3) Most importantly, when the transparency property is involved, the semantics segmentation network can only "extract" elements but cannot "restore" them. A GAN can restore the pixels existing before the overlay is added while extracting the elements.
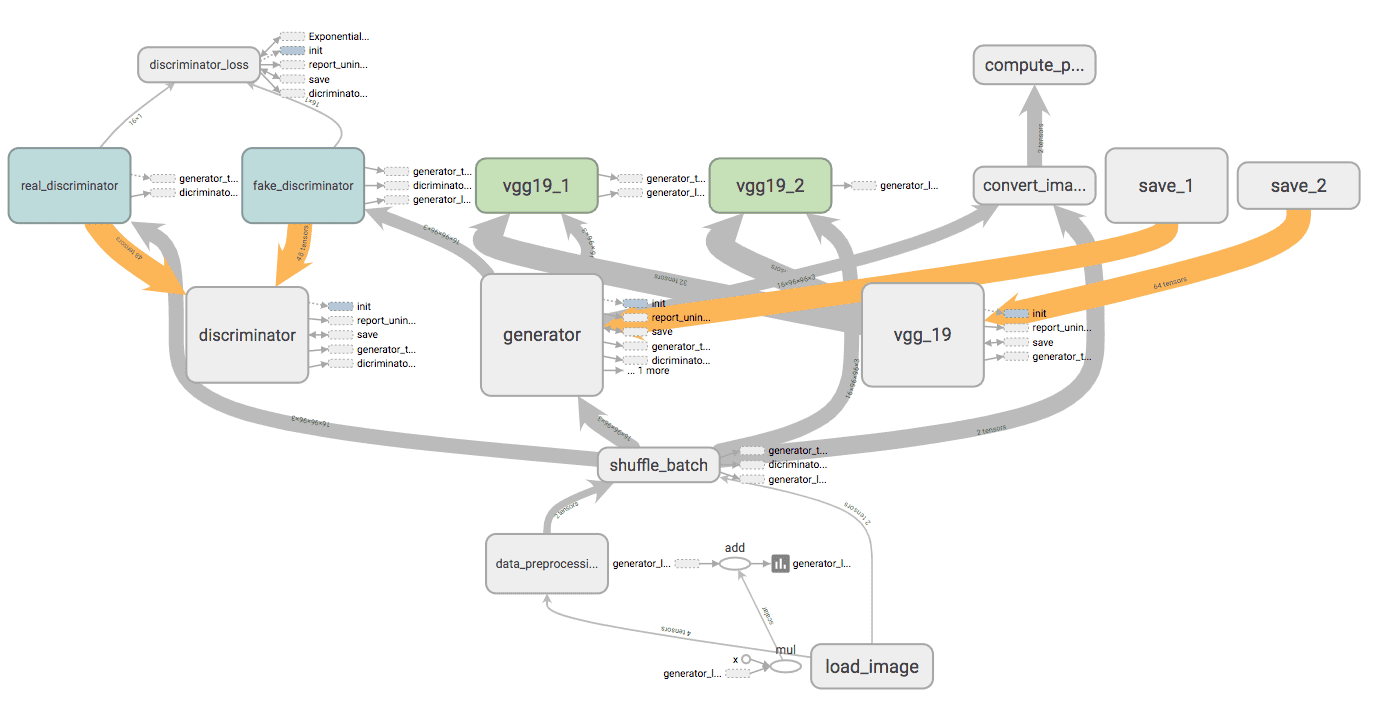
Fig: The training process of an SRGAN network
We improved the GAN model from the following aspects with respect to business scenes:
We do not perform upsampling by using the pixelShuffler module as it is not a super-resolution problem.
When the input images are complex, we use the DenseNet and a deep network to improve precision.
The content loss function has poor performance in identifying and suppressing noise. Therefore, the penalty for misidentifying noise is increased, as the following figure shows.

Example 1 of expected results:

Fig: Text content extraction from a complex background
Example 2 of expected results:


Fig: Source images and corresponding processing results
This section describes content extraction from a complex background. It also provides a solution for accurately extracting specific foreground content through machine learning supplemented by image processing in order to obtain recognition results with high precision, recall, and IoU.
The following figure shows the performance metrics of a conventional algorithm, the semantics segmentation network, and the ensemble method proposed in this article.
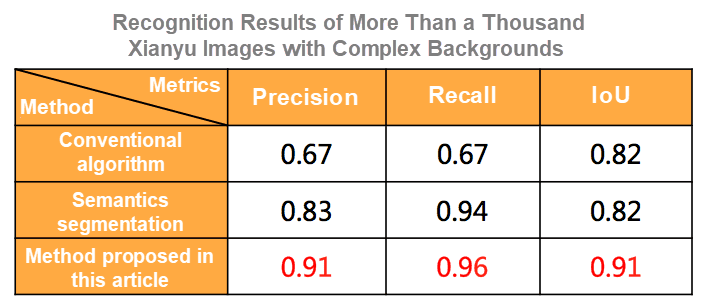
Fig: Performance metrics of different algorithms
The solution proposed in this article has been applied in the following scenarios:
1) imgcook image links: This solution can achieve an accuracy of 73% in general scenarios and an accuracy of over 92% in specific card scenarios.
2) Image content understanding during Taobao automated testing: This method has been applied in module recognition for the Taobao 99 Mega Sale and the Double 11 Shopping Festival. The overall precision as well as recall exceed 97%.
We plan to achieve the following goals concerning the image processing workflow:
1) Enrich and complete layout information to better recognize the information of layouts such as listview, gridview, and waterfall.
2) Improve the accuracy and recall in general scenarios. We will introduce a series of technologies such as the feature pyramid network (FPN) and Cascade to achieve this goal.
3) Increase the applicability. Currently, the method is applicable only to Xianyu pages and some Taobao pages. We plan to support more pages to improve the generalization abilities of our image-processing models.
4) Introduce an image sample machine to support more specific scenarios.
Intelligently Generate Frontend Code from Design Files: Business Module Recognition
Intelligently Generate Frontend Code from Design Files: Field Binding

66 posts | 4 followers
FollowAlibaba F(x) Team - February 23, 2021
Alibaba F(x) Team - February 25, 2021
Alibaba F(x) Team - March 3, 2021
Alibaba F(x) Team - February 26, 2021
Alibaba F(x) Team - June 20, 2022
Alibaba F(x) Team - February 24, 2021

66 posts | 4 followers
Follow Super App Solution for Telcos
Alibaba Cloud (in partnership with Whale Cloud) helps telcos build an all-in-one telecommunication and digital lifestyle platform based on DingTalk.
Learn More Mobile Testing
Provides comprehensive quality assurance for the release of your apps.
Learn More mPaaS
mPaaS
Help enterprises build high-quality, stable mobile apps
Learn More Platform For AI
A platform that provides enterprise-level data modeling services based on machine learning algorithms to quickly meet your needs for data-driven operations.
Learn MoreMore Posts by Alibaba F(x) Team
Start building with 50+ products and up to 12 months usage for Elastic Compute Service
Get Started for Free Get Started for Free