This is part of the Building End-to-End Customer Segmentation Solution Alibaba Cloud's post. These posts are written by Bima Putra Pratama, Data Scientist, DANA Indonesia.
Check the background and summary here.
To see previous phase, click here.
User recency, frequency, and monetary data could change over the period. It means we need to continuously label our users based on their current characteristics. Segmentation could be a hard task if we do it manually. So that we will deploy and create the segmentation process automatically in a batch once a day. The image below summarizes the step to serving the model.
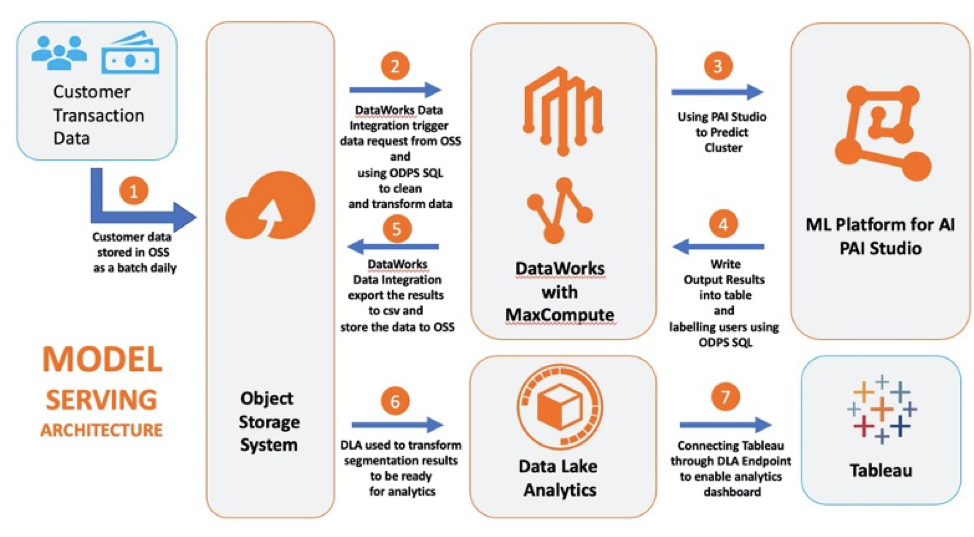
We begin by putting the daily data into the OSS and then using the Data Works service to transfer those data from OSS to Max Compute. After that, we clean and transform the data into RFM form that same as before.
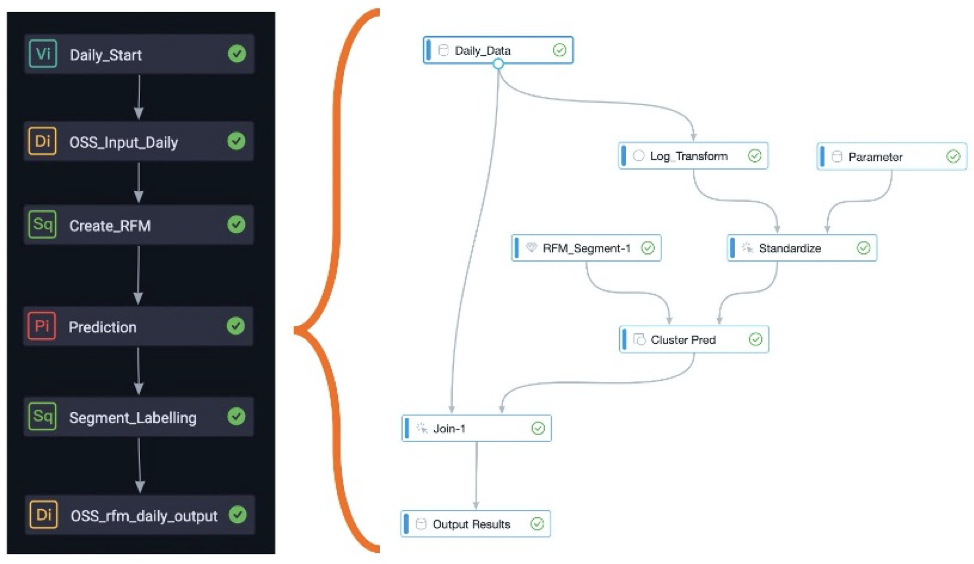
Then we create a new experiment as a PAI node. In this experiment, we do the same feature engineering process like Log Transform and Standardize. But we use the standardized parameter that we save during the training process.
Next, we use the prediction component using the RFM model that has been created before to predict our new data. We then join the segment results with the original parameters and save them into the Max Compute table.
After that, we create a SQL node to labeling our customers with the respective segment name. Then we send the results back to OSS as a *.csv files by creating a Data Integration Node. The image below shows the overall flow in Data Works and PAI Experiment.
Lastly, data lake analytics (DLA) will be used to connect OSS files with external visualization tools like Tableau. Data Lake Analytics (DLA) is a serverless cloud-native interactive query and analytics service. Hence we could present the segmentation results to our business team for monitoring and usage. The image below shows the customer segmentation dashboard created in Tableau.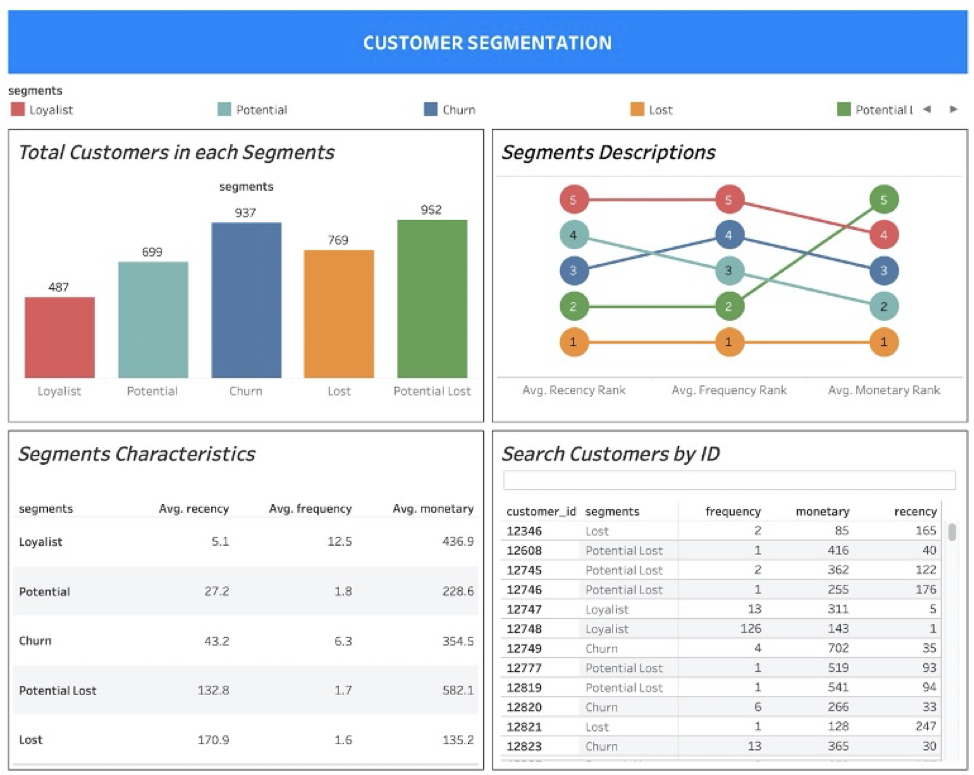
Conclusion
As a result, five clusters have been identified. Those are loyalist, potential, churn, potential loss, and loss. Hence, our business team could design and execute a marketing strategy to engage with each segment.
In the process, we also learn about how to combine various Alibaba Cloud Products to make an end-to-end machine learning pipelines and build a business use case.
To check see the first phase: Data Preparation, click here.
To check the second phase: Model Training, click here.
To check the background and summary, click here.
See all Alibaba Cloud's product:
*https://www.alibabacloud.com/product/maxcompute
https://www.alibabacloud.com/product/ide
https://www.alibabacloud.com/product/data-lake-analytics
https://www.alibabacloud.com/product/oss*
104 posts | 18 followers
FollowAlibaba Clouder - March 15, 2021
Alibaba Cloud Indonesia - August 28, 2020
Alibaba Cloud Indonesia - August 28, 2020
Alibaba Cloud Indonesia - August 28, 2020
Alibaba Cloud Community - September 5, 2024
Amuthan Nallathambi - June 4, 2023
104 posts | 18 followers
Follow MaxCompute
Conduct large-scale data warehousing with MaxCompute
Learn More OSS(Object Storage Service)
An encrypted and secure cloud storage service which stores, processes and accesses massive amounts of data from anywhere in the world
Learn More Hologres
A real-time data warehouse for serving and analytics which is compatible with PostgreSQL.
Learn More Data Lake Analytics
A premium, serverless, and interactive analytics service
Learn MoreMore Posts by Alibaba Cloud Indonesia