This is part of the Building End-to-End Customer Segmentation Solution Alibaba Cloud's post. These posts are written by Bima Putra Pratama, Data Scientist, DANA Indonesia.
Check the background and summary here.
To see previous post, click here.
We will use K-Means unsupervised machine learning algorithm. K-means clustering is the most widely used clustering algorithm, which divides n objects into k clusters to maintain high similarity in each group. The similarity is calculated based on the average value of objects in a cluster.
This algorithm randomly selects k objects, each of which initially represents the average value or center of a cluster. Then, the algorithm assigns the remaining objects to the nearest clusters based on their distances from the center of each cluster and re-calculates each cluster’s average value. This process repeats until the criterion function converges.
The K-means clustering algorithm assumes that we obtain object attributes from the spatial vector, and its objective is to ensure the minimum mean square error sum inside each group.
In this step, we will create an experiment using PAI studio and doing optimization using Data Science Workshop (DSW). PAI studio and DSW are part of Alibaba Machine Learning Platform For AI.
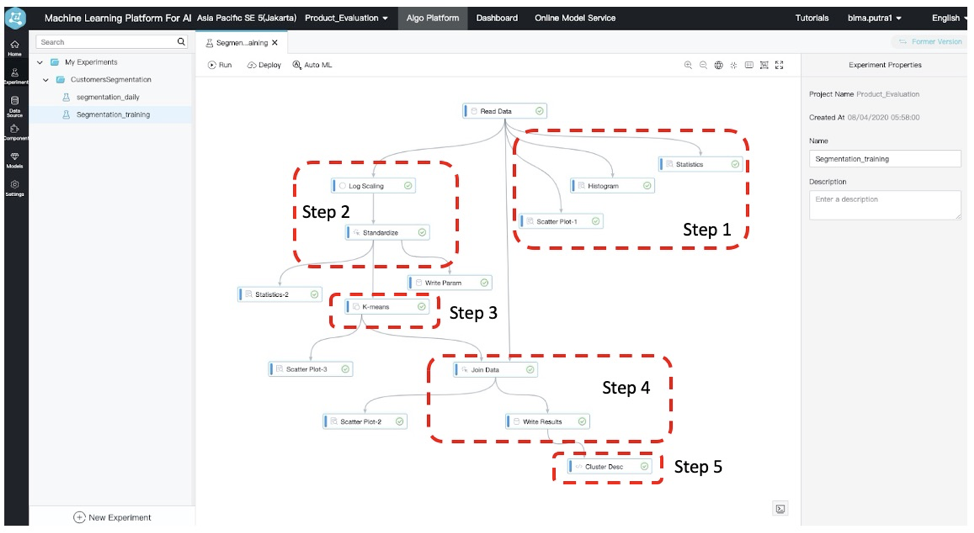
To create an experiment in a PAI studio is relatively simple. PAI Studio already has several functions as a component that we can drag and drop into the experiment pane. Then we just need to connect each component. The image below shows the experiment that we will build to make our model.
Step 1: Data Exploration
In this step, we aim to understand the data. We will explore our data by generates descriptive statistics, creating a histogram, and create a scatter plot to check the correlation between variables. We can do this by creating a component to do those tasks after we read our data.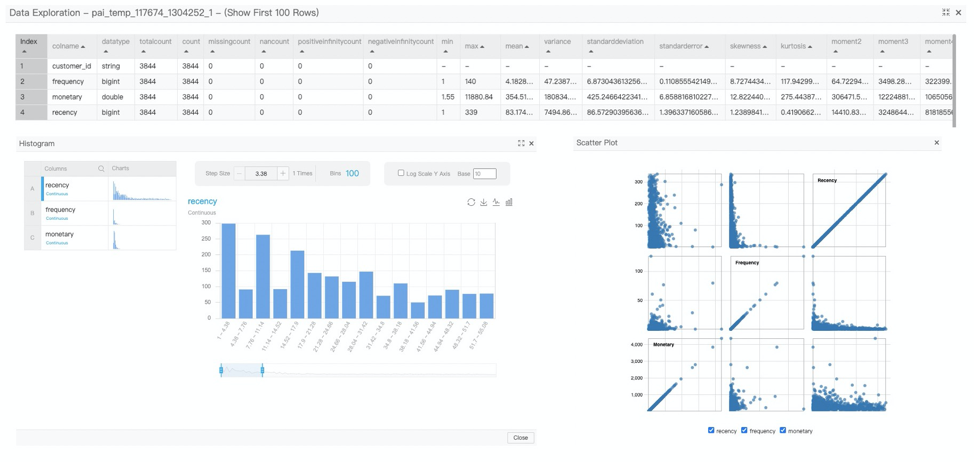
As a result, we know that we have skew data for frequency and monetary. Hence, we need to do feature engineering before creating the model.
Step 2: Feature Engineering
We will do a log transformation to handle the skew in our data. We also need to standardize the value before we use it for modeling. Because K-Means using distance as a measurement, and we need each of our parameters to be on the same scale. To do this, we need to create a feature transformation component and standardize component.

Then below this node, we should save the standardized parameter into a table so that we can use it during deployment.
Step 3: Model Creation
Now it’s time to create our model. We will use K-Means to find customer clusters. To do this, we need to input the number of clusters as our model hyper-parameter.
To find the optimum cluster number, we need to use Data Science Workbench to iterate the modeling using different numbers of clusters and find the optimum by generating the elbow plot. The optimum number of cluster is where the sum square error start flattens out.
DSW is a Jupyter Notebook like environment. Here We need to create an experiment by writing a python script and generate the elbow plot.

As a result, we found that our optimum cluster is five. Then we use this as our hyper-parameter for the K-Means component in PAI studio and run the component.
The results of this component, we have a cluster_index for each customer. We also can visualize the results in the forms of scatter plot that already colored by cluster_index. This component also generates a model that will be served later.

Step 4: Save Cluster Results
Here we will combine the original data with the results of the k-means component. Then we save the results to the MaxCompute table as our experiment output by creating a Write MaxCompute Table Component.
Step 5: Labelling Customer Segment
We will use the SQL component to calculate average Recency, Frequency, and Monetary for each cluster to understand the characteristics of each cluster and represent a name for each cluster. 

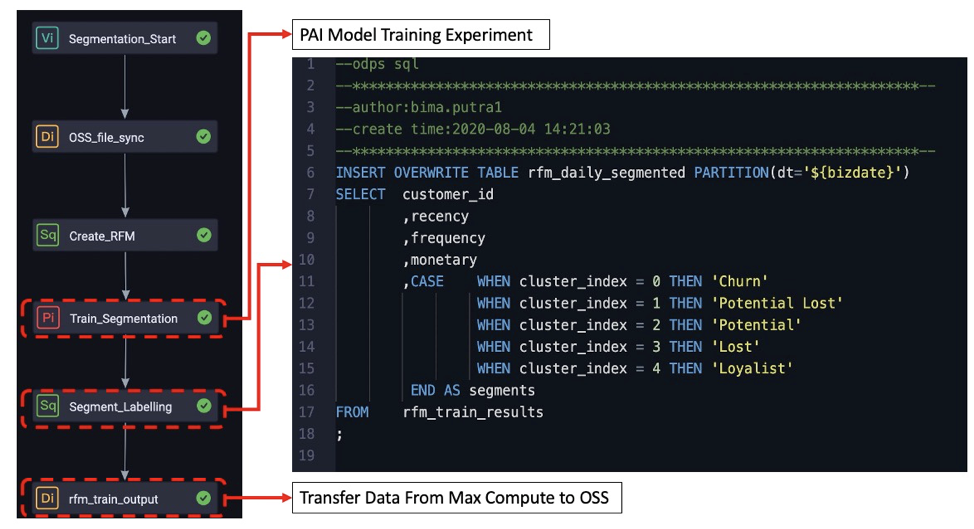
Now, we go back to Data Works and create a PAI Node to run our experiment. We are then using a SQL node to write a DML to segment each cluster. Lastly, we create another data integration node to send back the data from MaxCompute to OSS.
Summary for this phase
Those are five steps that need to be done to create a model training using Alibaba Cloud Products like OSS, MaxCompute, DataWorks, and Machine Learning Platform for AI. In summary, the diagram below shows the model training architecture from data preparation to model training. 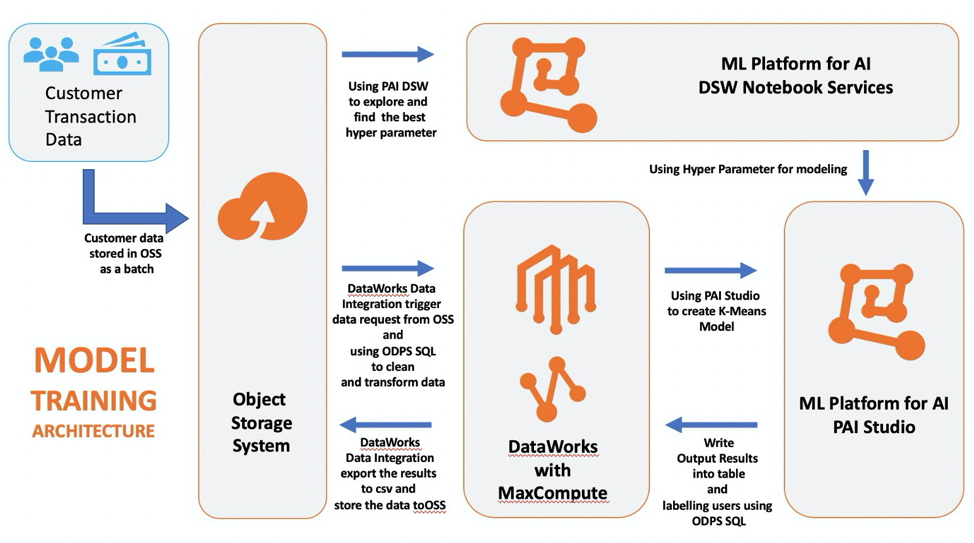
To continue to the next phase: Model Serving, please click here.
To check see the first phase: Data Preparation, click here.
To check the background and summary, click here.
How to Build Customer Segmentation Phase I: Data Preparation
115 posts | 21 followers
FollowAlibaba Clouder - March 15, 2021
Alibaba Cloud Indonesia - August 28, 2020
Alibaba Cloud Indonesia - August 28, 2020
Alibaba Cloud Community - September 5, 2024
Alibaba Cloud Indonesia - August 28, 2020
Academy Insights - December 25, 2025
115 posts | 21 followers
Follow MaxCompute
Conduct large-scale data warehousing with MaxCompute
Learn More OSS(Object Storage Service)
An encrypted and secure cloud storage service which stores, processes and accesses massive amounts of data from anywhere in the world
Learn More Hologres
A real-time data warehouse for serving and analytics which is compatible with PostgreSQL.
Learn More Data Lake Analytics
A premium, serverless, and interactive analytics service
Learn MoreMore Posts by Alibaba Cloud Indonesia