By Ranjith Udayakumar, Alibaba Cloud Tech Share Author. Tech Share is Alibaba Cloud's incentive program to encourage the sharing of technical knowledge and best practices within the cloud community.
This multi-part article talks about how to collect data, wrangle the data, ingest the data, model the data, and visualize the data from three viewpoints (conceptual, practical, and best practice).
In the first article of this series, we have seen how to understand data conceptually through an example from the Banking, Financial services and Insurance (BFSI) domain.
In this article, we will learn how to wrangle the data (i.e. cleaning the data) according to your business scenario to Alibaba Cloud Quick BI. We may need Quick BI in the upcoming process of deciphering data so please ensure that you have registered for an Alibaba Cloud account. If you haven't, sign up for a free account through this link.
Data wrangling, sometimes referred as data munging, is the process of transforming data from one format to other with the intent of making it more appropriate and valuable for analytics. With the rapid rise of Big Data and IoT applications, the number of data types and formats are increasing each day. This makes data wrangling an indispensable element for big data processing, especially for larger applications.
Alibaba Cloud Quick BI is a flexible and lightweight business analytics platform built on cloud. The basic components of Quick BI are as follows:
Data wrangling includes:
Data cleansing or data cleaning is the process of detecting, analyzing, removing the inaccurate records from a data set, and replacing the inaccurate parts of the data by appropriate data. Data cleansing could be done with help of data wrangling tools, or through scripts.
For example, let's assume the dataset has some erroneous value in date column like "s29-05-2018" instead of "29-05-2018". To a person, this may seem like a trivial error, but to a system, this entry is unreadable. The system may not read this entry as a date but instead it will take it as a string.
Note: We can use Excel itself to clean the data but may we miss something. It's better to do it via scripts or tools. If the data source is Database, then we can do it in BI tool.
Data Editing and Preparing is nothing but a manual process of changing the data, data types for the reporting purpose.
For example, let's assume dataset has date values in "MM-DD-YYYY" format but we need in "DD-MM-YYYY" format. This means we need to change it manually.
Note: Data Editing and Preparing is usually carried out in Excel itself or if the data source is Database then we can do it in BI tool.
As we discussed earlier, we are going to use Excel to wrangle the data. In addition to that, I also like to share the python script I wrote to wrangle the data automatically.
Here, we will look at our first use case ATM Dataset. In this use case example we will see how to wrangle the data in Excel.
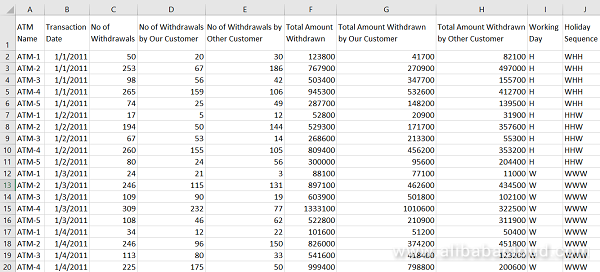
Our dataset is clean, but for demonstration we will make some part of this data erroneous or inaccurate first.
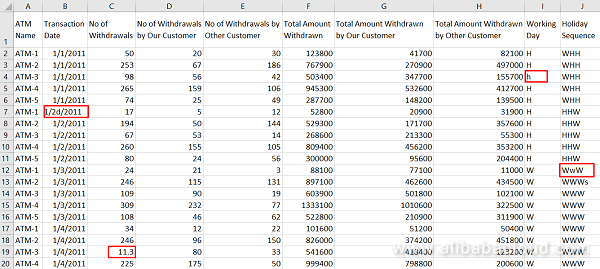
Now our data contains some erroneous value like:
We need to handle this because if not handled properly it will lead to inaccurate results which in turn leads to false insights.
Let me show how to handle this in excel. Please have a look at the following table
| Type | Result |
| Number | 1 |
| Text | 2 |
| Logical Value | 4 |
| Error Value | 16 |
| Array Value | 64 |
Using Type Function, we can easily find erroneous data. Please follow the following Steps:
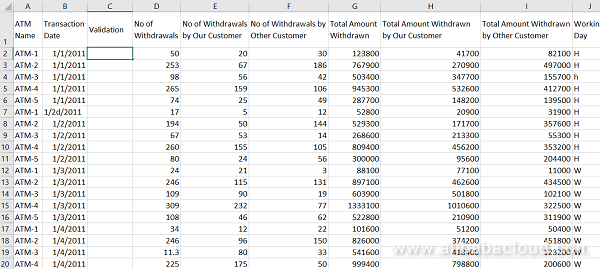
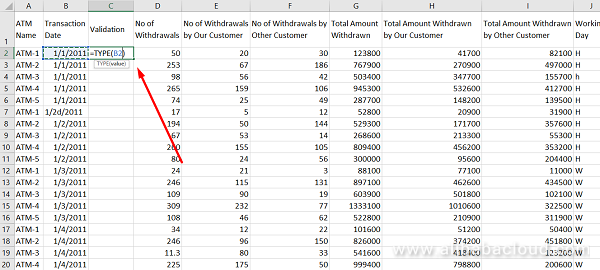
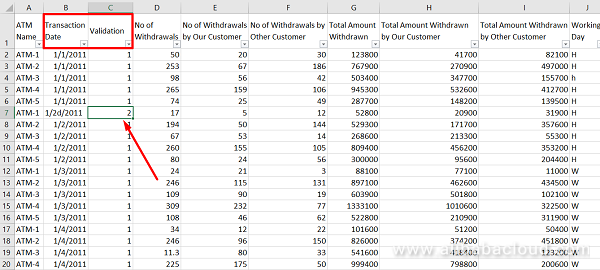
We may not able to analyze each cell to find the incorrect data. So, it is essential to use any wrangling tool or scripts.
Here we go our next use case Customer360.
We are going to use a Python Script to wrangle the data automatically. I will write a separate article in detail about this programmatic approach to "Decipher the data to uncover the hidden insights out of it".
Python Code
# =============================================================================
#                      #Importing the necessary modules
# =============================================================================

import pandas as pd
import numpy as np

# =============================================================================
#                    #Data Wrangling or Data munging
# =============================================================================

def datawrangler(data):


    data=data.drop_duplicates()
    data.rename(columns=lambda x: x.replace(' ', ''), inplace=True)

    # Getting Column Names
    columns=data.columns.values
    columns=pd.DataFrame(columns,columns=['ColumnFields'])

    # Getting Column Types
    columndatatype=pd.DataFrame(data.dtypes)
    columndatatype.index=range(len(columns))

    #Adding Column types with their respective columns
    columns['ColumnTypes']=columndatatype

    for x in range(len(columns)):

      if (columns['ColumnTypes'].iloc[x]) is np.dtype(np.int64) or (columns['ColumnTypes'].iloc[x]) is  np.dtype(np.float64) :

           data[columns['ColumnFields'].iloc[x]]=data[columns['ColumnFields'].iloc[x]].fillna(0)

      if (columns['ColumnTypes'].iloc[x]) is not np.dtype(np.int64):

           data[columns['ColumnFields'].iloc[x]]=data[columns['ColumnFields'].iloc[x]].fillna(method='ffill')

      if 'date' in (columns['ColumnFields'].apply(np.str.lower).iloc[x]):

          data[columns['ColumnFields'].iloc[x]]=data[columns['ColumnFields'].iloc[x]].apply(pd.to_datetime)

      if (columns['ColumnTypes'].iloc[x]) is np.dtype(np.float64):

          for y in range(len(data)):

              if (np.modf(data[columns['ColumnFields'].iloc[x]].iloc[y])[0]) in ['0.0',0.0] :

                 data[columns['ColumnFields'].iloc[x]]= data[columns['ColumnFields'].iloc[x]].astype(np.dtype(np.int64))
                 break

      if (columns['ColumnTypes'].iloc[x]) is not np.dtype(np.int64) and (columns['ColumnTypes'].iloc[x]) is not np.dtype(np.float64) and ('date' not in (columns['ColumnFields'].apply(np.str.lower).iloc[x])):

          for y in range(len(data)):

              if ((data[columns['ColumnFields'].iloc[x]].iloc[y]).isnumeric()) :

                  data[columns['ColumnFields'].iloc[x]]=data[columns['ColumnFields'].iloc[x]].astype(np.dtype(np.int64))
                  break


    return data

# =============================================================================
#                            #Getting the Data
# =============================================================================

location=input("\n\nEnter the File Location\n\n\t")
data=pd.read_csv(location,index_col=0)
savelocation=input("\n\nEnter the File Save Location\n\n\t")

# =============================================================================
#                            #Passing the Data to the Module
# =============================================================================

data=datawrangler(data)
data.to_csv(savelocation, index=False, header=None)Data ingestion is a critical success factor for analytics and business intelligence. We need to know about OLTP and OLAP.
OLTP is an Online Transaction Processing system. The focus of OLTP system is to record the current Update, Insertion and Deletion while transaction. The OLTP queries are simpler and short and hence require less time in processing and requires less space. A common example of an OLTP system is an ATM database, in which using short transactions we modify the status of our account
OLAP, on the other hand, is an Online Analytical Processing system. OLAP database stores historical data that has been inputted by OLTP. Using OLAP, you can extract information from a large database and analyze it for decision making. A classic example of an OLAP system is a data warehouse, which accumulates data from multiple OLTP data sources for querying and analyzing the data.
For both OLTP and OLAP, we may have files or database as data sources. Typical file formats include .CSV and .XLS. We also need to consider different types of databases for our application. Connectors will be available to easily connect the databases.
Let's now see how to ingest data into Quick BI.
But first, you'll need to have Quick BI set up for this example. Follow these steps to apply for Quick BI Pro Trial. You'll need to have an Alibaba Cloud account. If you don't have one already, please sign up here.
Your Quick BI instance has been created.
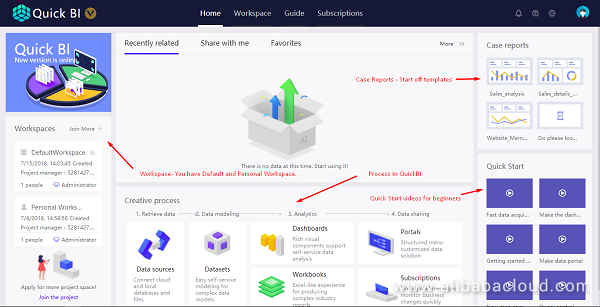
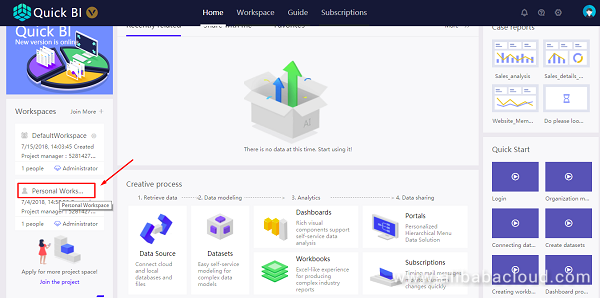
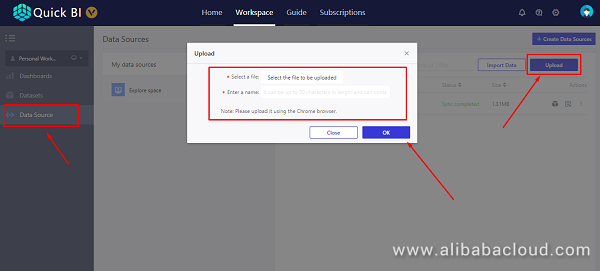
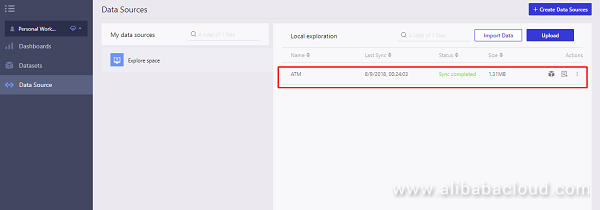
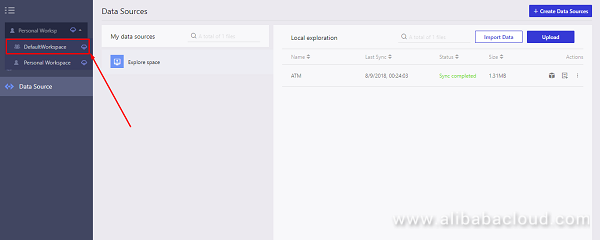
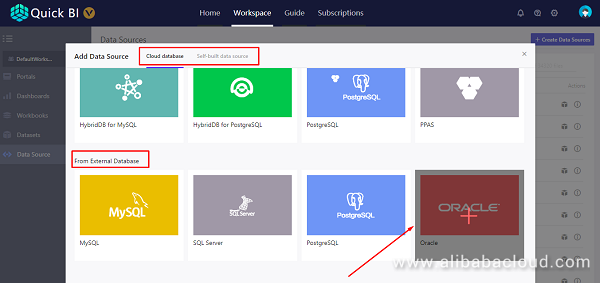
Note: You can select either Cloud Databases or External Databases.
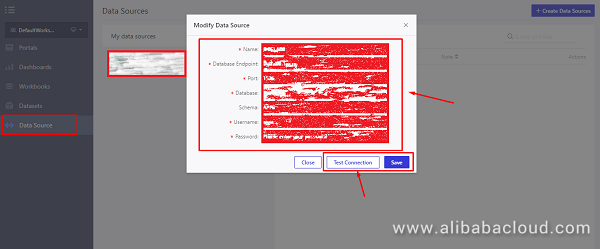
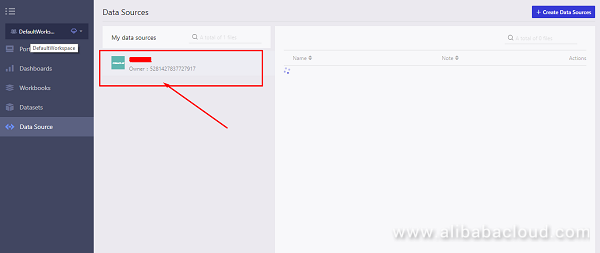
If you followed the steps correctly, you should have successfully ingested data into Quick BI, which is a great milestone in the process of deciphering your data to uncover the hidden insights.
Please ensure that you have registered for an Alibaba Cloud account to enjoy a free trial of Quick BI Pro. In the next article of this multi-part tutorial, we will see how to model the data with Quick BI. See you all in next part of this article series.
Pangu – The High Performance Distributed File System by Alibaba Cloud

2,593 posts | 792 followers
FollowAlibaba Clouder - March 1, 2019
Alibaba Clouder - August 10, 2020
Alibaba Clouder - August 13, 2018
Alibaba Clouder - July 15, 2020
Alibaba Clouder - March 1, 2019
Alibaba Clouder - October 15, 2018

2,593 posts | 792 followers
Follow Quick BI
A new generation of business Intelligence services on the cloud
Learn More DataV
DataV
A powerful and accessible data visualization tool
Learn More MaxCompute
Conduct large-scale data warehousing with MaxCompute
Learn MoreMore Posts by Alibaba Clouder