By Wang Xining
This is the fourth edition in the ASM Extended Capabilities series, a collection of articles that describes some extended capabilities of Alibaba Cloud Service Mesh (ASM).
According to the OpenTracing website, distributed tracing, also known as distributed request tracing, is a method for the general analysis and monitoring of applications, primarily applications built using the microservice architecture. Distributed tracing helps locate faults and identify the causes for performance deterioration.
A common misunderstanding is that no code changes are required when the ASM is used for service tracing. According to the official Istio introduction, even though the Istio proxy can automatically send span information, applications still need to transmit suitable HTTP request headers to associate the span information with the correct trace. Therefore, applications need to collect the following request headers and transmit them from incoming requests to outgoing requests.
The x-b3 header originates from the Zipkin project, and "b3" in the header is named after BigBrotherBird, the original name of Zipkin. The transmission of these headers between services is called B3 transmission. According to Zipkin principles, these attributes are usually transmitted to downstream nodes through HTTP request headers to ensure that all activities originating from the same root are collected together.
Tracing Analysis provides a wide range of tools to help developers identify performance bottlenecks of distributed applications and improve the efficiency of developing and troubleshooting applications that use the microservice architecture. These tools help to map traces, offer trace topologies, analyze application dependencies, and count the number of requests.
To use Tracing Analysis, first activate the Tracing Analysis service. Tracing Analysis depends on Log Service and the Resource Access Management (RAM) service. Therefore, activate both services and authorize Tracing Analysis to read and write respective Log Service data.
For more information about how to activate related services and authorize permissions, see Activate Related Services and Authorize Permissions.
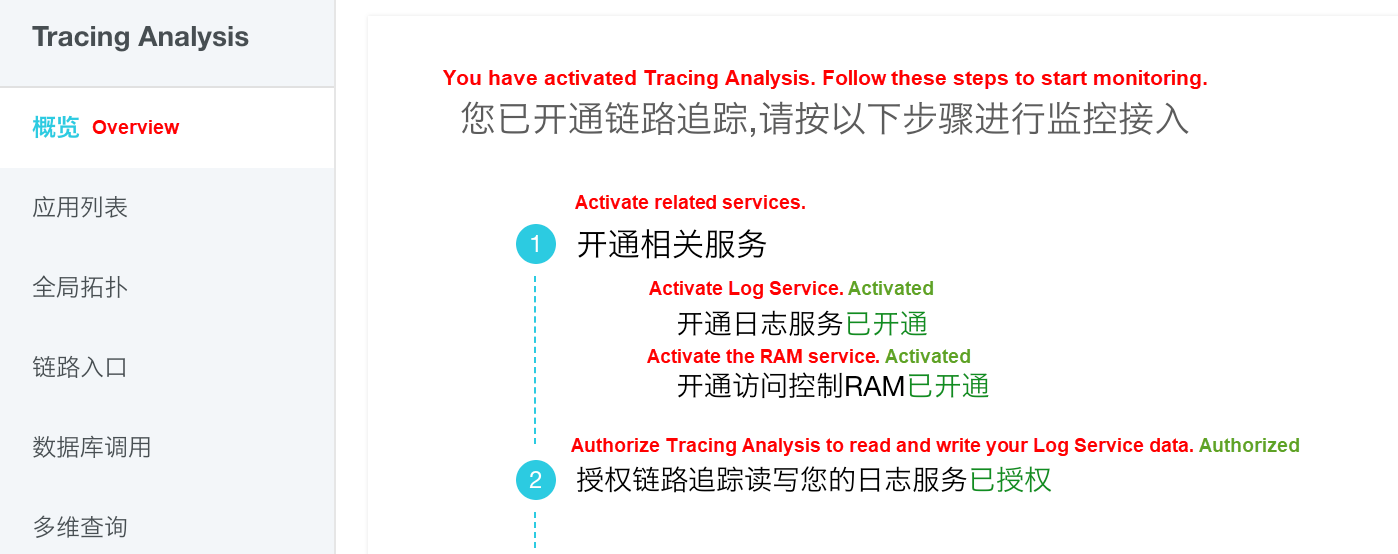
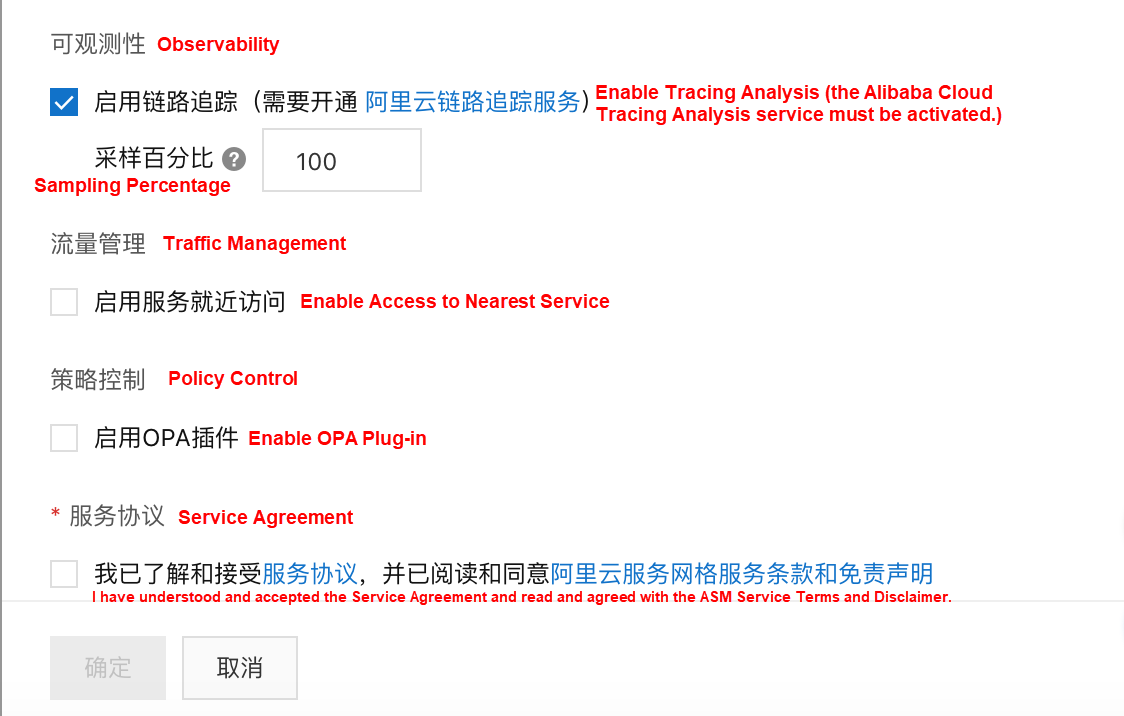
ASM integrates the Alibaba Cloud Tracing Analysis service. The following sub sections describe how to enable Tracing Analysis while creating a new ASM instance as well as for an existing ASM instance.
While creating an ASM instance, select Enable Tracing Analysis to enable the ASM tracing analysis capability. Also, set the traffic percentage for tracing, which ranges from 0.01 to 100.00.
Note: To select this option, first activate the Alibaba Cloud Tracing Analysis service.
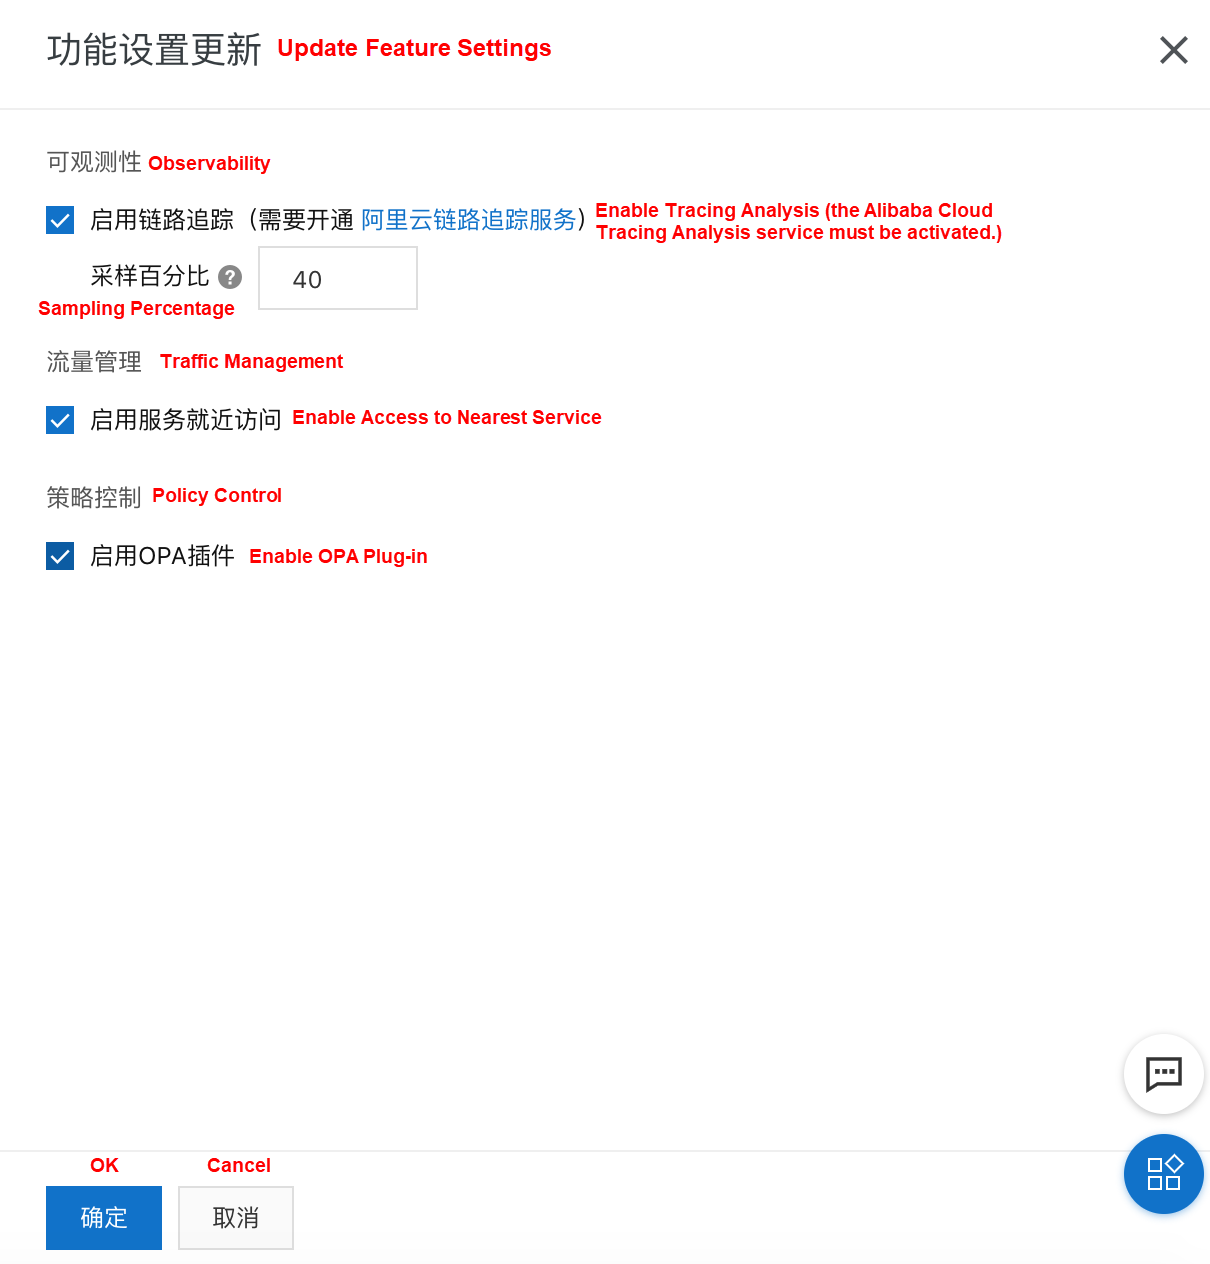
If you did not select Enable OPA Plug-in when creating an ASM instance, use the following method to enable the OPA plug-in to enable the tracing feature for ASM instances or adjust the traffic percentage for tracing.
Deploy the application to an ASM instance. View the productpage service implemented using Python in the example. Note that this application uses the OpenTracing library to extract required headers from the HTTP request.
def getForwardHeaders(request):
    headers = {}

    # x-b3-*** headers can be populated using the opentracing span
    span = get_current_span()
    carrier = {}
    tracer.inject(
        span_context=span.context,
        format=Format.HTTP_HEADERS,
        carrier=carrier)

    headers.update(carrier)

    # ...

    incoming_headers = ['x-request-id']

    # ...

    for ihdr in incoming_headers:
        val = request.headers.get(ihdr)
        if val is not None:
            headers[ihdr] = val

    return headers
View the Reviews service implemented using Java.
@GET
@Path("/reviews/{productId}")
public Response bookReviewsById(@PathParam("productId") int productId,
                            @HeaderParam("end-user") String user,
                            @HeaderParam("x-request-id") String xreq,
                            @HeaderParam("x-b3-traceid") String xtraceid,
                            @HeaderParam("x-b3-spanid") String xspanid,
                            @HeaderParam("x-b3-parentspanid") String xparentspanid,
                            @HeaderParam("x-b3-sampled") String xsampled,
                            @HeaderParam("x-b3-flags") String xflags,
                            @HeaderParam("x-ot-span-context") String xotspan) {

  if (ratings_enabled) {
JsonObject ratingsResponse = getRatings(Integer.toString(productId), user, xreq, xtraceid, xspanid, xparentspanid, xsampled, xflags, xotspan);In the address bar of the browser, enter http://{IP address of the ingress gateway service}/productpage and press Enter. The following page appears. Refresh the page to achieve the effect of multiple visits.

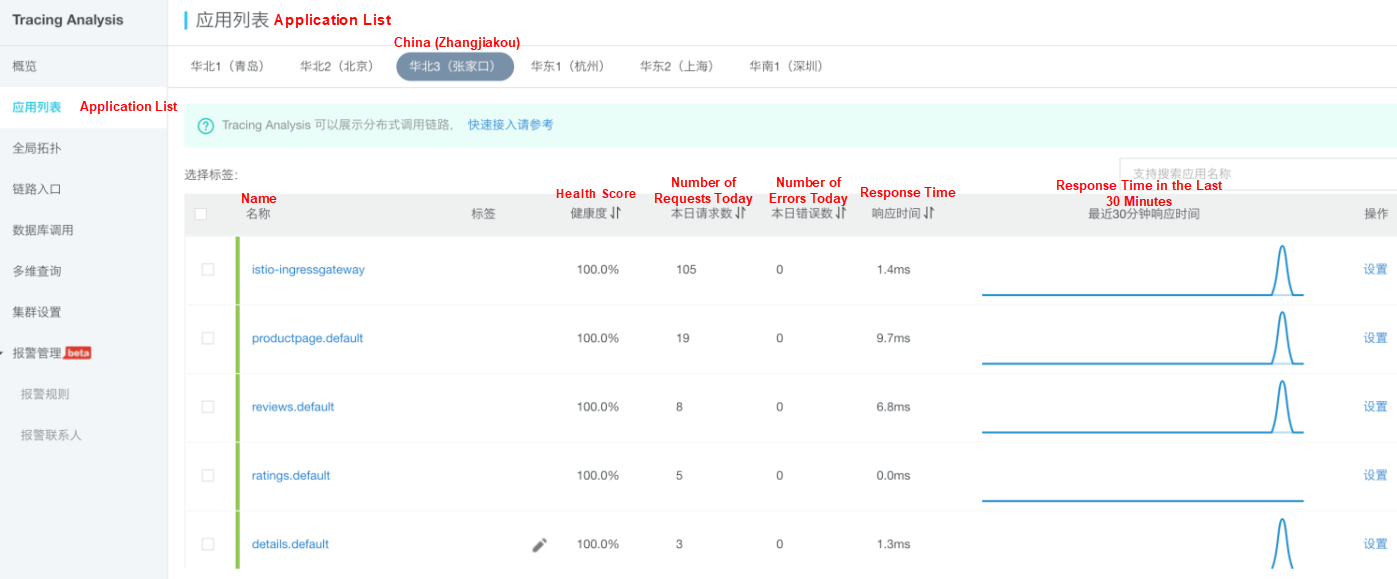
The Application List page displays the key metrics of all monitored applications, including the health score, number of requests today, and number of errors today. Customize tags for applications and filter applications by tag.
Complete the following steps to go to the Application List page:
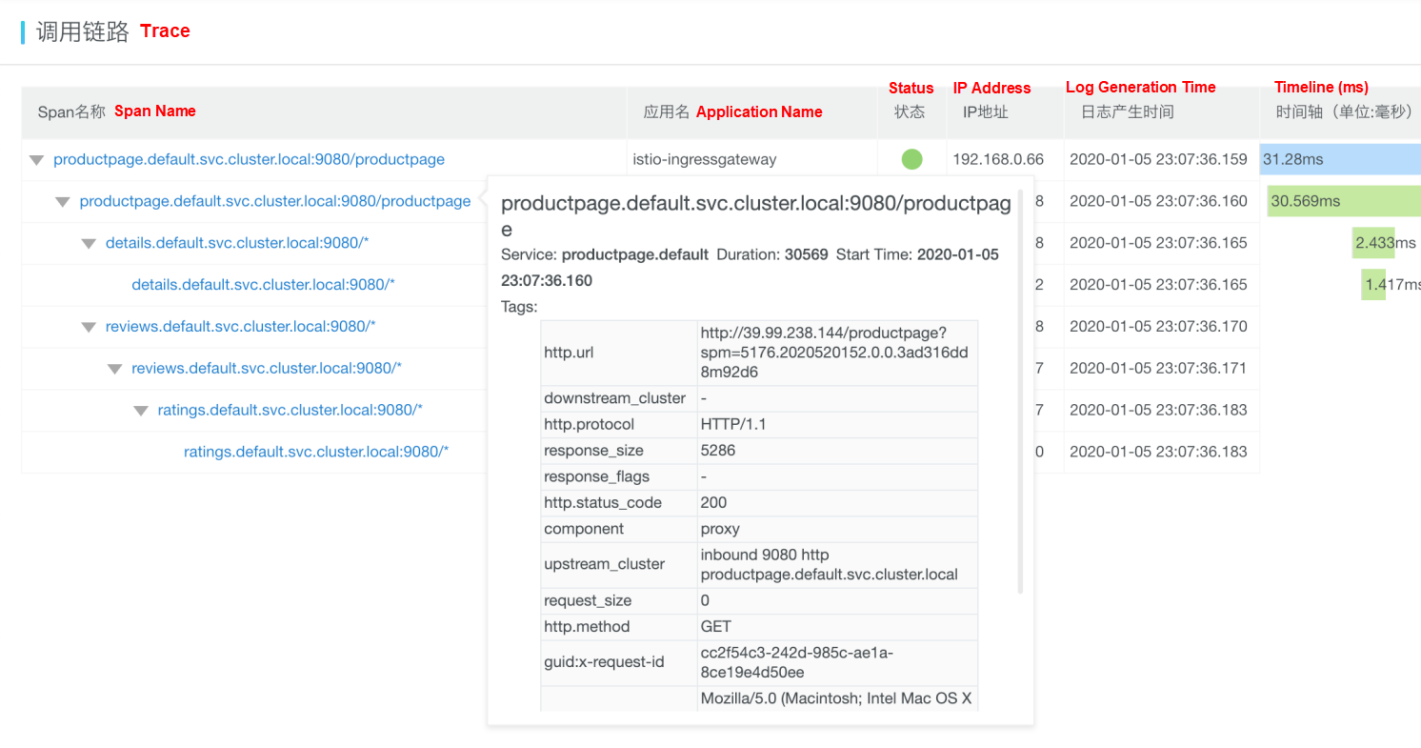
The Application Details page displays the key performance metrics, trace topology, and traces of an application on deployed servers.

Note: Whether an IP address or server name is displayed for the IP Address field depends on the display configuration on the Application Settings page. For more information, see Manage Applications and Tags.

Move the pointer over a service name to view information about the service, including the duration, start time, tag, and log event.
For more information about other operations, see Tracing Analysis documentation.
Architecture Analysis of Istio: The Most Popular Service Mesh Project

56 posts | 8 followers
FollowXi Ning Wang(王夕宁) - June 10, 2020
Alibaba Container Service - May 23, 2025
Alibaba Clouder - February 22, 2021
Xi Ning Wang(王夕宁) - July 21, 2023
Alibaba Developer - April 7, 2022
Xi Ning Wang(王夕宁) - August 17, 2023

56 posts | 8 followers
Follow Simple Log Service
An all-in-one service for log-type data
Learn More Managed Service for OpenTelemetry
Allows developers to quickly identify root causes and analyze performance bottlenecks for distributed applications.
Learn More Microservices Engine (MSE)
MSE provides a fully managed registration and configuration center, and gateway and microservices governance capabilities.
Learn More Cloud-Native Applications Management Solution
Accelerate and secure the development, deployment, and management of containerized applications cost-effectively.
Learn MoreMore Posts by Xi Ning Wang(王夕宁)