By Zhou Jiang (Weisong)
Alibaba Cloud's real-time data processing and visualized dashboard during Double 11 are classic examples of exporting real-time visualization projects to the new retail industry. This practice has been emulated by many enterprises in the e-commerce industry. This article summarizes the technical implementation and business analysis of these solutions and provides readers with valuable implementation experience. We will be focusing on illustrating the implementation scheme and details of visualized dashboard technology and discussing its business value.
When it comes to "data middle platform," also known as "data mid-end," Alibaba is undoubtedly one of the originators of this concept in the industry. In 2016, the book The Road to Big Data - Alibaba's Big Data Practice got published and set off a trend of learning in the industry; data middle platform gradually became the new direction of development for enterprises. As the birthplace of data middle platform and its main advocate, Alibaba Cloud has officially shared its experience of establishing data middle platform since early 2018. With the establishment of the Delivery Technology Department of Alibaba Cloud GTS Global Technical Services in 2019, the data middle platform program has witnessed rapid development. So far, Alibaba Cloud has popularized its data middle platform construction experience to hundreds of enterprises, governments, banks, and other institutions.
In 2020, the data middle platform project mainly involved T + 1 offline data analysis. Real-time data analysis scenarios are few. In May 2020, during a bi-weekly meeting, the team discussed for the first time the topic that many Alibaba Cloud users wished that the data middle platform could utilize the visualized dashboard to display real-time data analysis. In the next two months, several team members conducted detailed research on technical maturity, maturity of Alibaba Cloud products, and market potential.
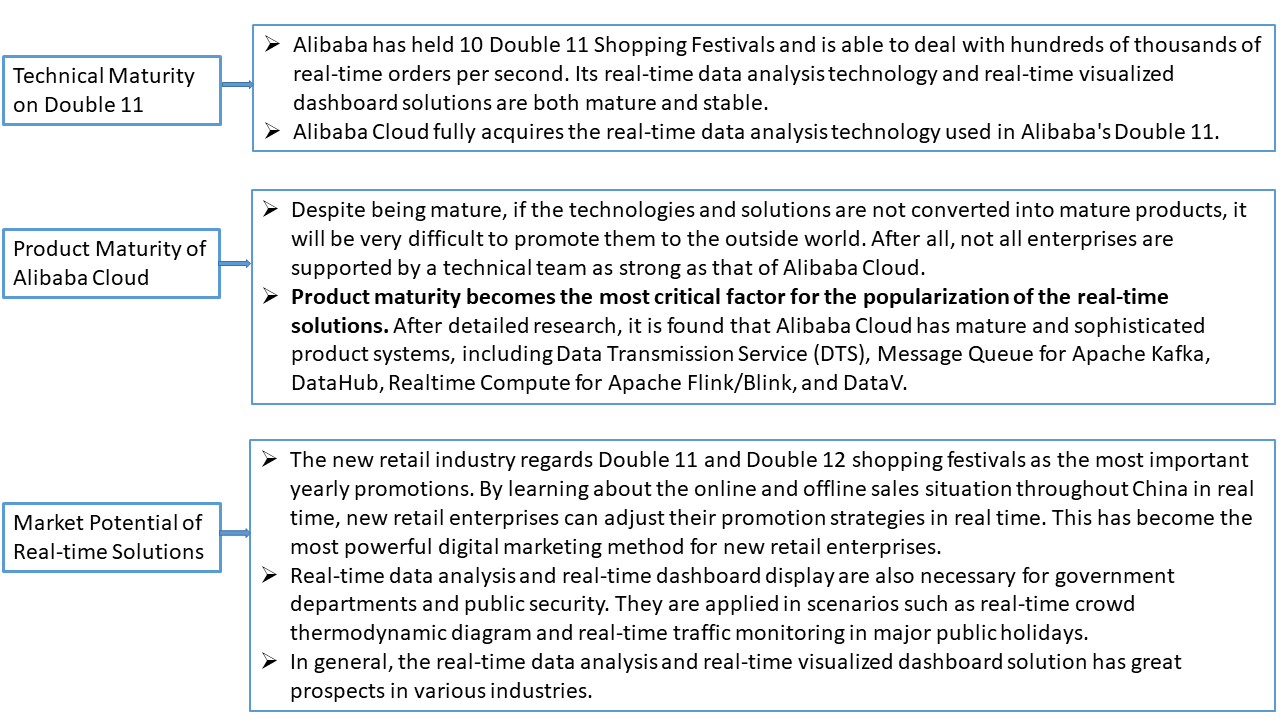
After the survey, the team determined that the real-time data analysis and real-time visualized dashboard solutions were basically feasible and can meet the requirements for exporting to external enterprise customers. In July 2020, the author was responsible for the data middle platform delivery project of a leading business Group. The customer proposed to the Alibaba Cloud technical team officially its wish to transport the real-time data analysis and visualized dashboard technologies to the Group so as to assist the marketing activities of Double 11 or Double 12.
This article analyzes the new retail industry and summarizes the Group's experience in employing visualization dashboard technology for the data middle platform project. Business scenario analysis, business value analysis, technical implementation solutions, and implementation details are elaborated in details.
Many enterprises want to implement real-time data analysis and visualized dashboard in their businesses in the hope of improving their marketing activities. Based on my personal experience with several customers, I summarized the business value brought by real-time data analysis to customers. I will introduce it in detail in the following part.
During big promotions such as Double 11 and Double 12 promotions, the duration of promotion spans from one day to two or three days. Therefore, the traditional T + 1 data analysis mode cannot adjust the marketing strategy according to real-time sales.
Enterprises can set up reasonable real-time data indicators and display them on the real-time dashboard. This enables decision-makers to learn about the sales statistics of online and offline stores across the country at all times:
Double 11 Shopping Festival has been with us for 10 years. Apart from the optimization of their promotion strategies, many enterprises still need to optimize their inventory and supply chains. For users, the speed of delivery is also a criterion for judging the quality of services of online stores. Another very important thing is that most new retail enterprises have about a dozen of flagship stores on online e-commerce platforms, with more offline stores, even up to hundreds or thousands in number. Therefore, it is critical to make sure that the inventory meets the market demand.
If customers shop offline but can't get their desired product, it is very likely that the store will lose those customers. Therefore, during big promotion campaigns, the sales are largely affected by whether stores have sufficient inventory and whether the inventory meets the market demand.
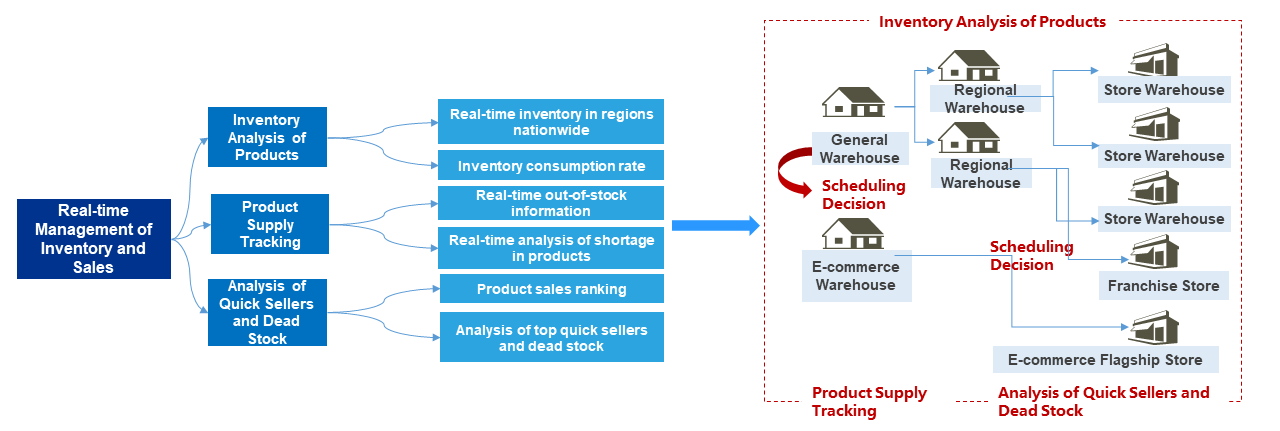
Double 11 of 2020 started on November 1 and ended on November 11, with 11 days to perform stock analysis, product inbound and outbound transfer, product scheduling, and delivery. With the real-time dashboard solution, the company's decision makers can obtain real-time information about the sales in stores in every region of the country at any time, each brand and category, and even each SKU. Based on the preceding information, they can have a better understanding of the regions where the inventory meets the market demand and the regions with wrong types or quantities of goods in their inventory. By doing so, inventory scheduling among regions across the country in a short time can be achieved, increasing the sales of offline stores.
As for dozens of flagship stores on various online e-commerce platforms and their corresponding e-commerce warehouses, the decision-makers of enterprises can also get real-time information about the sales in every online store at any time, of each brand and category, and even of each SKU. By doing so, the optimal scheduling of goods among different e-commerce warehouses and between e-commerce warehouses and offline warehouses can be achieved so as to increase the sales of online flagship stores.
Regrettably, when the Group first employed real-time indicators from the visualized dashboard for inventory and sales analysis in 2020, the delivery mechanism of warehouses didn't make the necessary adjustments. As a result, during the Double 11 Shopping Festival in 2020, the Group only analyzed the real-time indicators about sales and inventory because the warehouse system wasn't integrated with the real-time analysis system. After successful integration in 2021, the scheduling and delivery of goods from warehouses nationwide can be optimized based on the real-time sales during Double 11.
Real-time visualized dashboards are visually pleasing, but aesthetics is not our main goal. Instead, only reasonable real-time indicators can help enterprises improve their marketing strategies. So, how do we select real-time indicators to achieve the best result? Here, I'd like to illustrate this based on the real-time indicators of a project, and the overall indicators are shown in the table below (only some of them are displayed):
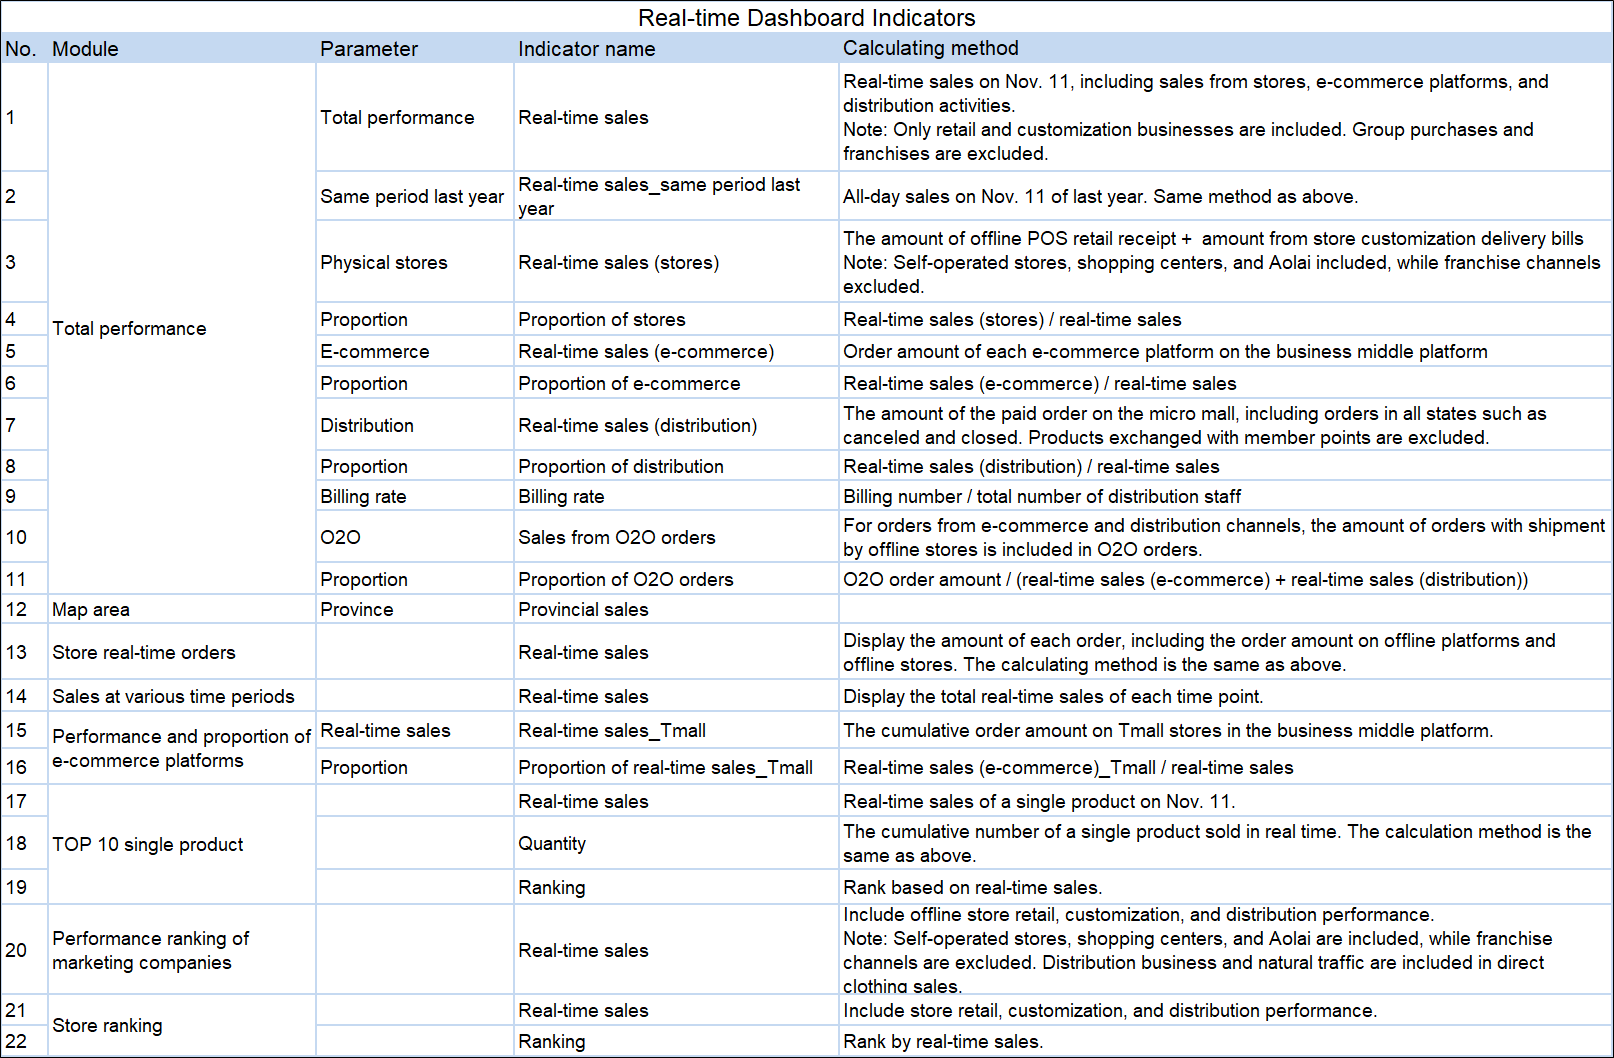
Global indicators are used by decision-makers to view the overall sales status and determine sales trends, and these indicators are as follows:
(1) Total sales: real-time sales of all channels.
(2) Online channel sales: sales from flagship stores on e-commerce platforms, including rankings of sales of different brands on each e-commerce platform.
(3) Offline channel sales: sales from stores, O2O, and distribution.
These indicators involve real-time sales of offline franchised stores and flagship stores on various e-commerce platforms. Offline franchised stores are distributed across the country, while e-commerce platforms include Tmall, Taobao, JD.COM, Vipshop, and live streaming. Brick-and-mortar stores or flagship stores include flagship stores of men's clothing, women's clothing, and main brands such as Youngor and Mayor. The indicators are as follows:
(1) Marketing strategies: Based on the sales of offline stores and e-commerce flagship stores, the decision-makers adjust promotion strategies temporarily, including the discounts of different brands and the number of coupons released. In addition, the prices of goods sold on e-commerce platforms are synchronized with the prices of those sold in offline stores in real time. At the same time, online coupons are provided to offline stores to prevent the loss of offline customers.
(2) Ranking of sales: The decision-makers can observe clearly the sales situation of online and offline stores in the country and notice some obviously abnormal stores. For example, if a star store that was popular during the previous Double 11 Festival ranks very low in terms of its sales this year, the store manager must be notified immediately to find problems and make adjustments.
(3) Inventory normality: Based on the distribution of e-commerce orders, best delivery choices can be made by coordinating inventory in e-commerce warehouses, regional warehouses, and store warehouses. At the same time, based on the "sales + inventory" of different brand categories of stores in various regions of the country, the goods in different warehouses are scheduled in a timely manner so that goods are shipped to places where they are most popular.
(4) Promotion campaign of new products: The Double 11 Shopping Festival is also a great opportunity for merchants to adjust the promotion strategies of their new products.
This year's Double 11 promotion last 11 days from November 1 to November 11. During the 11 days, the sales statistics at every time period of each day are recorded. The decision-makers can view the real-time sales chart to understand the sales situation at each time period and adjust promotion campaign accordingly.
Based on the mature product matrix of Alibaba Cloud, the team of GTS data middle platform delivery designed the overall real-time data analysis and real-time visualized dashboard architecture for the Group. The solution is as follows:
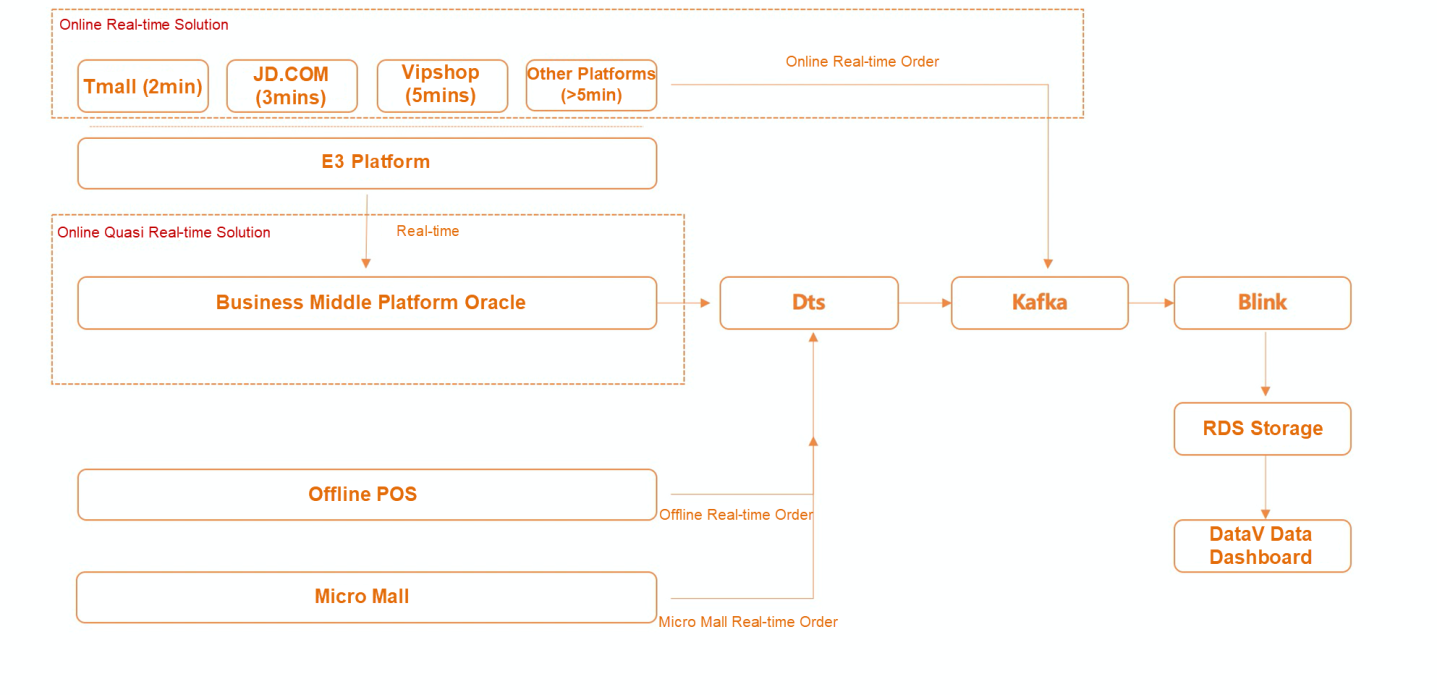
As you can see from the figure above, the Group's e-commerce orders come from multiple e-commerce platforms, such as Tmall, JD.COM, Vipshop, and SUNING.COM. Therefore, the real-time data processing and visualized dashboard solution we designed became the "real-time visualized dashboard plan on all channels".

In terms of collecting Oracle real-time data, DTS has both merits and demerits:
The sales and inventory data of offline stores are stored in the Daoxun POS system. When a customer purchases goods at a store, the shopping guide enters relevant information such as the product information and the price into the system, and then the Oracle database in the POS system records the transaction immediately. After that, Alibaba Cloud DTS collects the order within 10 seconds. Therefore, for transaction orders completed in offline stores, the process from placing orders to data collection can be completed within 20 seconds.
Similar to the POS system, the order data of Micro Mall is stored in the Oracle database. Immediately after the order is created, THE order data is written to the oracle database. It takes less than 20 seconds for DTS to collect real-time order data.
Unlike Alibaba's Double 11 orders, most e-commerce orders of the new retail enterprises are distributed on various e-commerce platforms, such as Tmall and Taobao, and their own private e-commerce platforms. To implement real-time data analysis and real-time visualized dashboard, the best way to collect data is to directly access the order databases of various e-commerce platforms. However, those who are familiar with e-commerce businesses must know that the order data of e-commerce flagship shops are not available to new retail enterprises but can only be obtained through brokers. In this case, this scheme was denied.
We cannot directly obtain orders from various e-commerce platforms, so we use Baison E3 to forward orders. Baison E3 retrieves orders from e-commerce platforms and forwards them to the order center of the business middle platform. To obtain a large number of e-commerce orders quickly during Double 11, we communicated with Baison E3 and decided to use the light cache mode so as to control order forwarding within 5 minutes. Due to the fact that latency would emerge when Baison E3 collects orders from various e-commerce platforms, for example, 2 minutes from Taobao and Tmall and 3 minutes from JD.COM, the overall latency between order placement and data collection by DTS would be between 5 to 10 minutes.
You need to pay attention to many technical details when using DTS to subscribe to an Oracle database. Otherwise, the following common failures may occur:
The common reasons why DTS fails to subscribe to Oracle tasks are as follows: (1) The configured redo log is too small; (2) The Oracle server does not install LOGMNR or authorize the logmnr permission. The reason why DTS has a high latency when obtaining data involving the insertion, deletion, and update operations is that there are too many update clauses in single transactions. Too many details and technical points are involved, so this article only summarizes several common optimization methods.
I. Oracle requires a relatively large redo log because a small logfile requires more checkpoints and reduces performance. Sometimes single transactions are deleted cyclically before they are completely recorded. Thus, DTS reader keeps reporting an error of not being able to find the redo log.
II. Oracle server needs to install LOGMNR package and grant the logmnr permission. DTS depends on LOGMNR to obtain the DML operations (including insert, update, and delete) from the Oracle database so as to obtain real-time data involving such operations.
III. The number of update clauses in single transactions operated by Oracle should be kept within a low range. If a large update statement is used, that is, a large number of update clauses exist in a transaction, the Oracle database will perform a reverse lookup. In addition, the latency of obtaining real-time data by DTS will become very high. Therefore, we recommend that the number of update clauses in a single transaction should be less than 1,000.
The team chooses Kafka as the message-oriented middleware for data cache rather than DataHub. The main reason is that the developers have previous knowledge about Kafka. In addition, with little time for this project, Kafka helps to save time. The following figure shows how to activate Kafka and develop based on it:
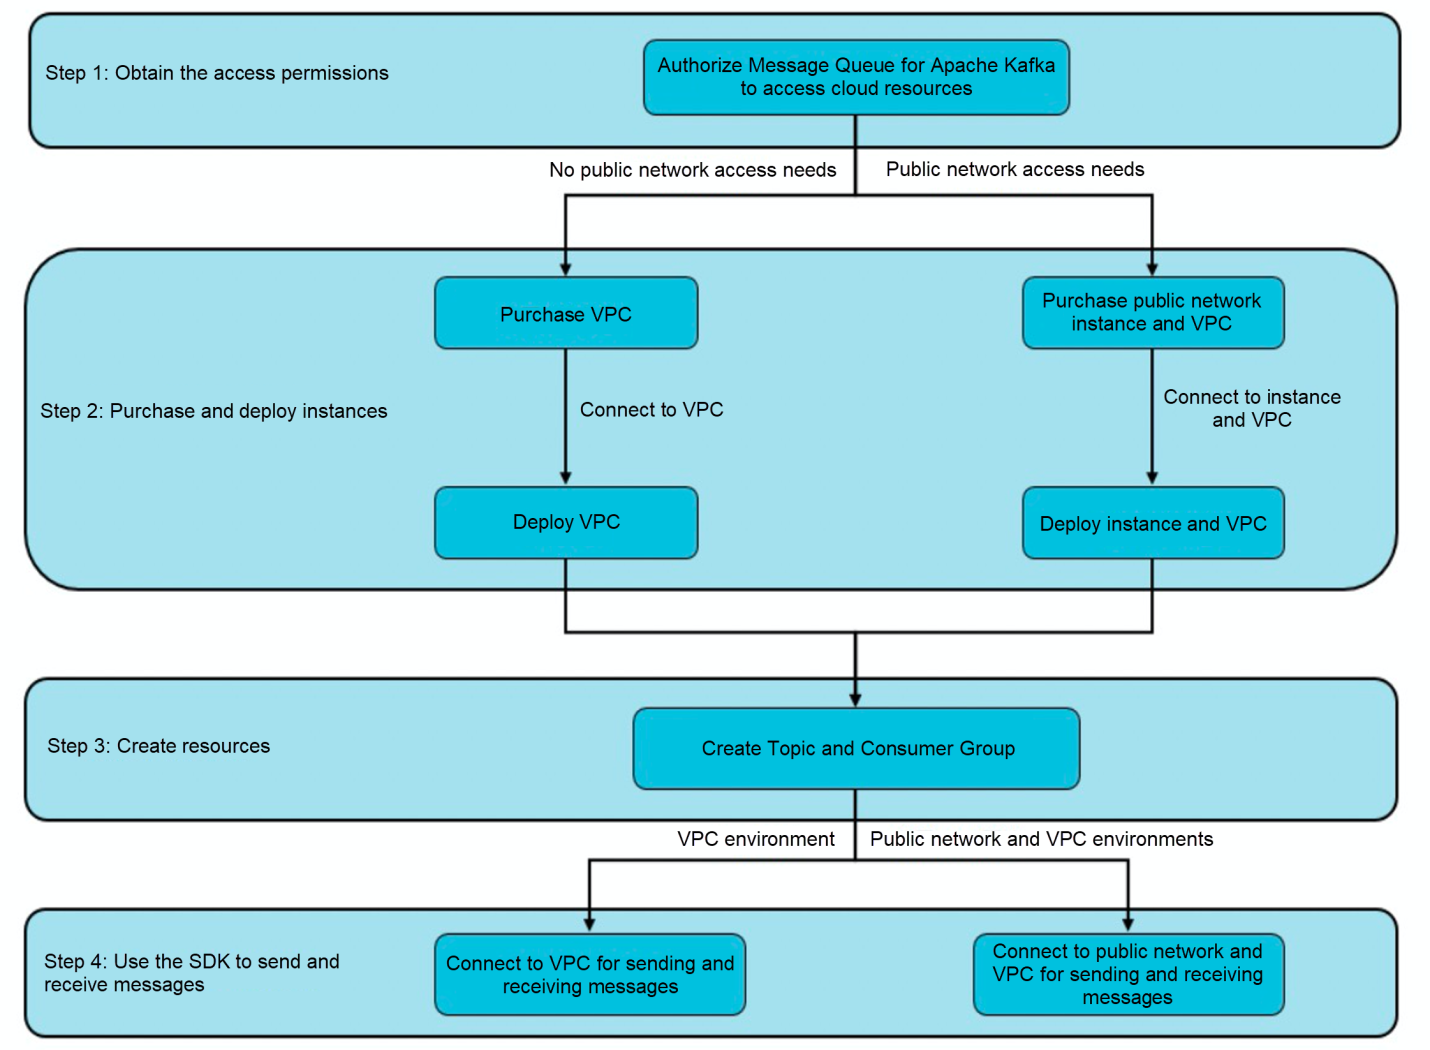
You also need to pay attention to the whitelist when using Alibaba Cloud Message queue for Apache Kafka. Otherwise, the network connection is different. Besides, We also recommend that you use the demo code and dependency packages provided on the official Alibaba Cloud website and deploy them to the production environment after modifications. It is because that the code and dependency packages from open-source communities may be incompatible with the production environment.
Blink or Realtime Compute for Apache Flink is an excellent tool for real-time data processing on Alibaba Cloud. It can directly read data of real-time orders from Alibaba Cloud Kafka. The following figure shows the overall process of real-time data processing of Blink:

To use Alibaba Cloud Kafka as the source of input data of Blink, you must first create a table of referred Kafka data sources in Blink. An example of creating a Kafka source table is as follows:
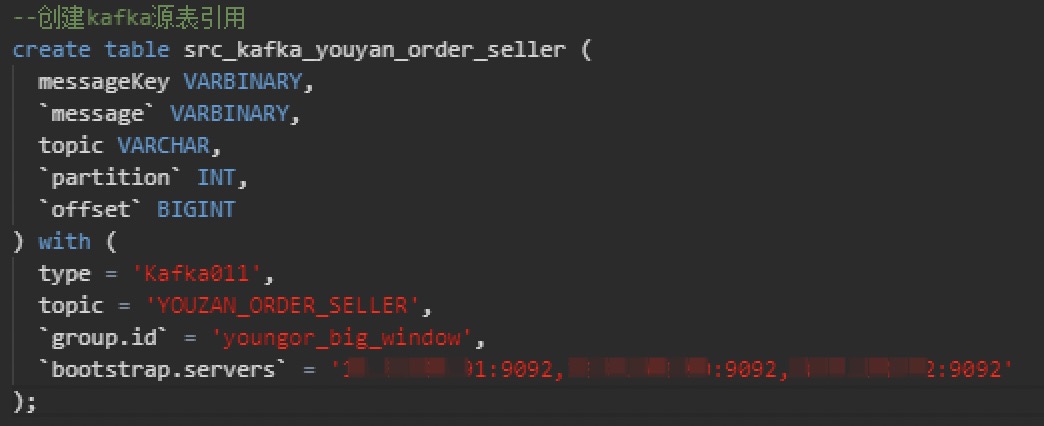
Preferred naming method of Kafka source table: src_type of source table_original table name. This enables developers to know from which data table in which business system the Kafka data is obtained.
Data consumed by Kafka is in the JSON format. You need to read out each field, that is, read the fields in the source table of the business system and write to Blink. An example of reading data from the Kafka Source table is as follows:
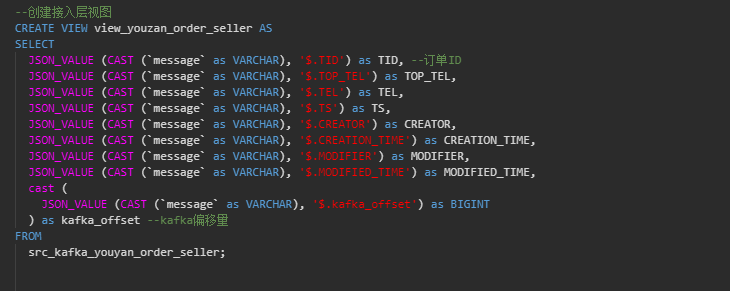
This is the most important step in data analysis. Blink reads the fields from the data table in the business system and then computes them. Currently, Blink can analyze and process data by using SQL statements, which simplifies the data analysis process. The following example shows how to obtain the latest order payment information from Youzhan:
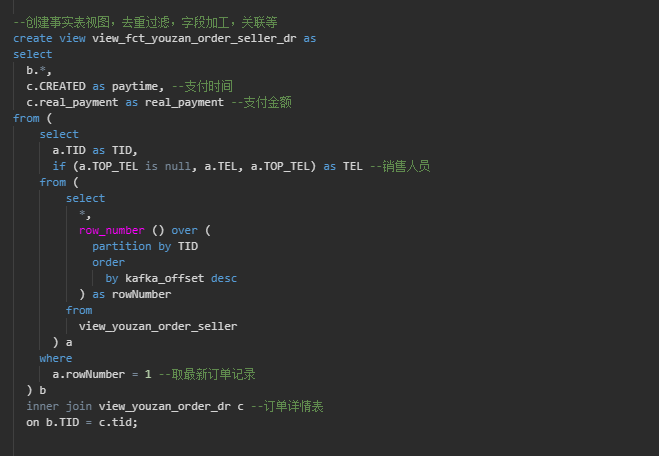
When you use Blink SQL for data analysis, note the following points:
The results are stored in ApsaraDB RDS for MySQL database. Therefore, you need to create an RDS view in Blink and write the processing results to the RDS view. The final data is written to the RDS data table. The following sample code shows the process:
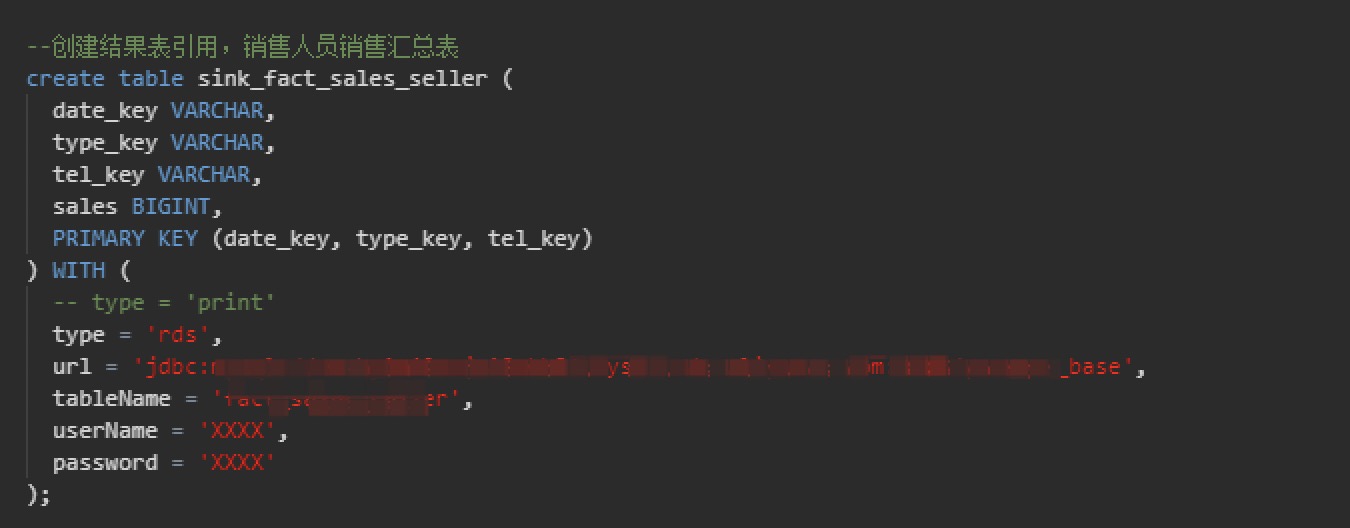
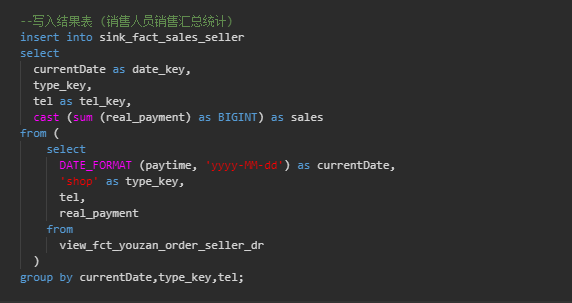
As the data source of DataV, RDS allows you to display real-time processing results after writing them to RDS.
Real-time data processing demands great timeliness. From DTS data collection to Kafka, to Blink, and to DataV, problems in any stage would prevent real-time data indicators from being generated in a timely manner. Therefore, we must design a standby solution. Similar to Alibaba's real-time solution for Double 11, the standby solution must support seamless switchover to the primary solution.
The data procedure of the standby solution is: Oracle -> Blink -> RDS -> DataV, skipping DTS and Kafka. The step of collecting real-time data by DTS is skipped, so Blink needs to be connected to Oracle database directly. By doing so, Blink can perform a full table scan on the transaction order table to produce real-time indicators. The standby solution puts a lot of query pressure on the Oracle production database, so it cannot be started unless the primary solution fails.
For switchover between the primary procedure and standby procedure, the is_master parameter has two values: 1 and 0. First, use two RDS data tables to store the indicators for real-time analysis results of the primary procedure and the standby procedure, respectively. Then, create a view to associate the two RDS result tables and connect the view with DataV. Finally, use values of the is_master parameter to complete the switchover.

After exploring business analysis scenarios, refining business indicators, and developing and testing real-time technologies for two months, the real-time dashboard was finally launched in late October and applied by the Group at 12 o'clock a.m. on November 1. The effect is shown in the picture below (The actual sales figures are sensitive data, so mosaics are used here):
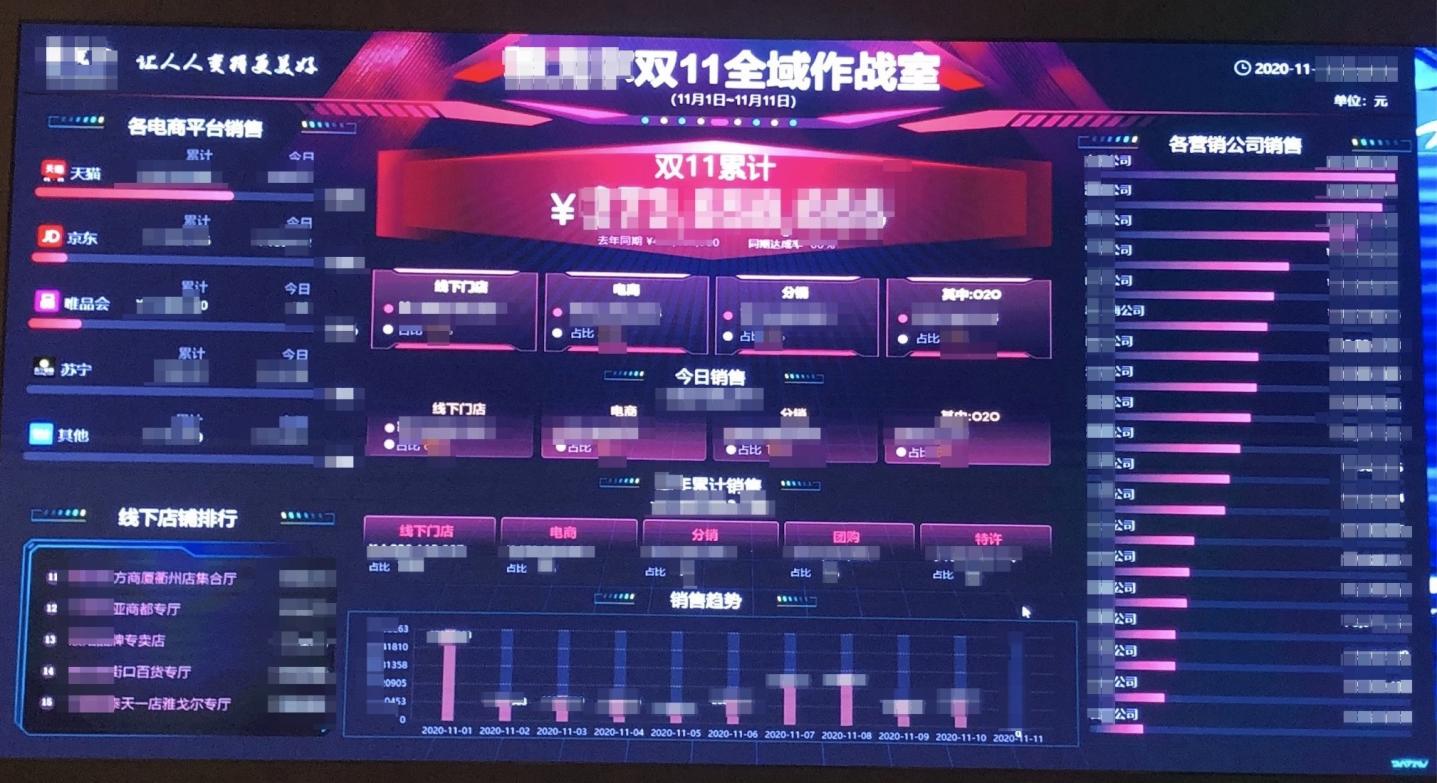
During Double 11, our customer achieved a sales volume that is 120% of the sales target and was more confident in our scheme for real-time analysis scenarios, business value, and technical solutions. Therefore, after Double 11, we developed a conventional BI report scheme based on the visualized dashboard and applied it in the office of the vice president of the Group. The vice president can check the real-time sales of offline and online stores nationwide at any time so that he can analyze business indicators and adjust marketing strategies.
Alibaba's real-time data analysis and visualized dashboard technologies are one of the best in the market, and many of Alibaba Cloud's customers want to employ them. The data middle platform delivery team of GTS technology delivery department in Alibaba Cloud combines real-time data processing with visualized dashboard to develop a delivery service package of visualized dashboard. The package is directly used for business output, technology output, and solution implementation of external enterprises. You are welcome to recommend Alibaba's real-time data processing and visualized dashboard solutions to the whole industry and help them become the benchmark for Alibaba Cloud's external delivery service.
Opportunity Discovery and Application of Keywords by AliExpress
Construction Methods and Practices of Data Middle Platform Delivery Standardization

3 posts | 0 followers
FollowHologres - June 16, 2022
Alibaba Clouder - June 10, 2020
Alibaba Clouder - December 12, 2017
Alibaba Cloud MaxCompute - December 8, 2020
Apache Flink Community China - March 29, 2021
Alibaba Cloud Security - July 9, 2020

3 posts | 0 followers
Follow Big Data Consulting for Data Technology Solution
Alibaba Cloud provides big data consulting services to help enterprises leverage advanced data technology.
Learn More Big Data Consulting Services for Retail Solution
Alibaba Cloud experts provide retailers with a lightweight and customized big data consulting service to help you assess your big data maturity and plan your big data journey.
Learn More Quick BI
A new generation of business Intelligence services on the cloud
Learn More ApsaraDB for HBase
ApsaraDB for HBase is a NoSQL database engine that is highly optimized and 100% compatible with the community edition of HBase.
Learn MoreMore Posts by AliCloud-Data Middle Office