By Rifandy Zulvan, Solution Architect Intern
In this blog post, we will explore the process of establishing logging solutions in Alibaba Cloud environments and using Elasticsearch, Kibana and Filebeat. To implement this, we need some Alibaba Cloud services, including:
● Alibaba Cloud Elasticsearch Cluster
● Alibaba Cloud ECS (for application server)
● Alibaba Cloud ECS (for Kibana)
Let's take a closer look at how the log flow operates from the application server to Elasticsearch and the subsequent visualization in Kibana. The illustration below provides a clear representation of this process.

To implement the solutions, we need to install Filebeat first in our application server. Filebeat is a lightweight log shipper that can collect and forward logs from application server to Elasticsearch.
For this blog we want to collect logs from Nginx applications server and also Syslog and Authlog in the server to monitor the server security. All the logs will be collected using Filebeat.
To Install Kibana on ECS, you can refer to our previous Blog Install Kibana 8.5 on ECS for Elasticsearch - Alibaba Cloud Community
To install Filebeat, you can refer to the official Elasticsearch documentation, here: Filebeat quick start: installation and configuration | Filebeat Reference 8.8 | Elastic
● Prerequisite
Before starting to set Kibana and Elasticsearch Endpoint for Filebeat in your Application server. You need to make sure that Elasticsearch Cluster on Alibaba cloud has a whitelist of your Application Server IP, or You application server and Elasticsearch cluster must be in the same VPC.
● Set Kibana and Elasticsearch Endpoint on filebeat.yaml file
We can find the filebeat.yaml file on /etc/filebeat/filebeat.yaml. Within this file, we will customize the configuration settings for filebeat. By making these configurations, we can establish the necessary connections with Kibana and Elasticsearch, and also define specific settings such as the number of index shards and replicas. We can set the configuration as below.
filebeat.inputs: filebeat.config.modules: #Default
path: ${path.config}/modules.d/*.yml reload.enabled: false

setup.template.settings: index.number_of_shards: 1
index.number_of_replicas: 0

setup.kibana:
host: 'kibana-endpoint:5601' #replace endpoint

output.elasticsearch: allow_older_versions: true
hosts: ['es-endpoint:9200'] # replace endpoint

# Customize index name
# index: "my-index-%{+yyyy.MM.dd}"
# Protocol - either `http` (default) or `https`. #protocol: "https"

# Authentication credentials - either API key or username/password. #api_key: "id:api_key"
#username: "elastic" #password: "changeme"

processors: #Default
-    add_host_metadata: when.not.contains.tags: forwarded
-    add_cloud_metadata: ~
-    add_docker_metadata: ~
-    add_kubernetes_metadata: ~
To collect Nginx Logs, we need to enable Nginx module in our Filebeat.
• Enable Nginx module
- module: nginx access:
enabled: true
var.paths: ['/var/log/nginx/access.log*']
• Run Filebeat setup
To set up a connection between filebeat and our Elasticsaerch cluster, we can follow this steps.
1) Check Filebeat status with sudo systemctl status filebeat command. (Make sure that Filebeat is in running status)
2) Run filebeat setup -e command to initialize setup between Filebeat to Elasticsaerch Clusters and Kibana.
After setup successful running. We can see data stream, index, and data view on Kibana.
• Data Stream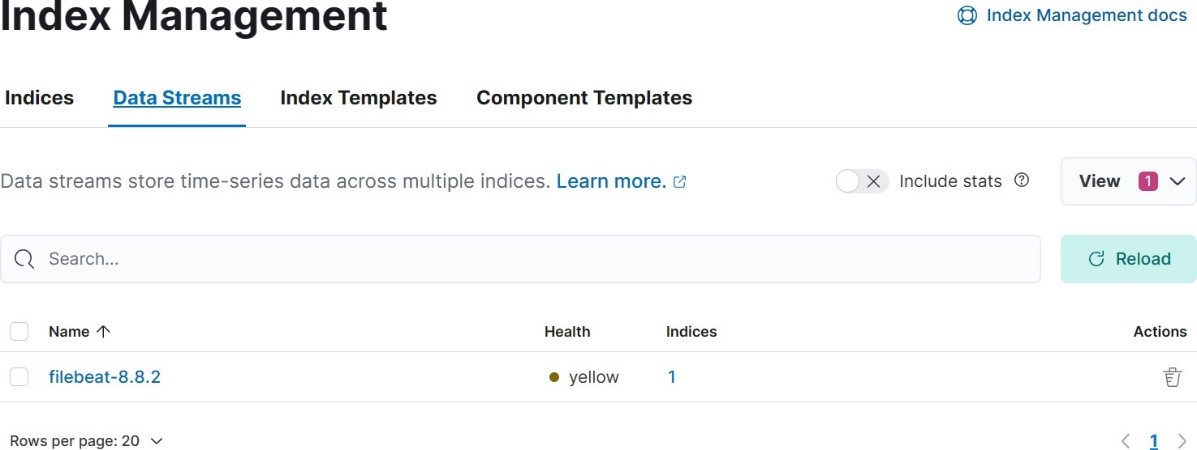
• Index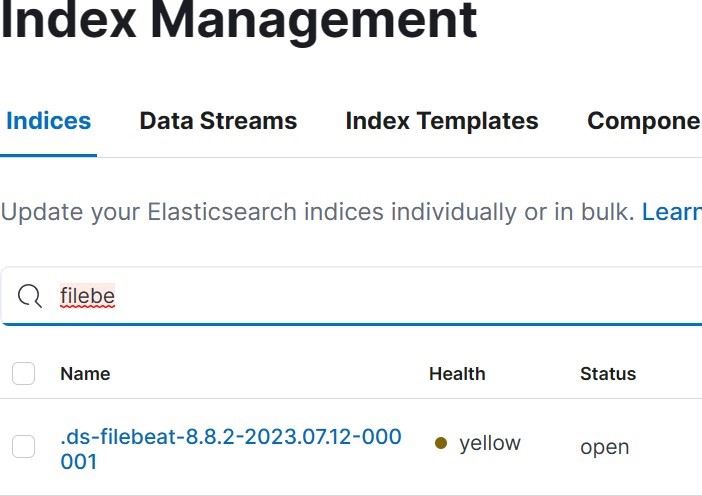
• Data View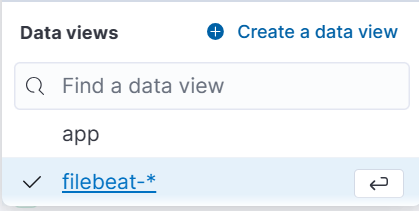
• Send request to Nginx server
We can send request by using:
1) Bash Command
while true; do curl -s nginx-ip > /dev/null; done
2) Python Script
import requests

nginx_server_ip = "http://xxx.xxx.xxx.xxx" #replace for _ in range(200):
response = requests.get(nginx_server_ip) print(f"Response status code: {response.status_code}")
• See Logs in Kibana
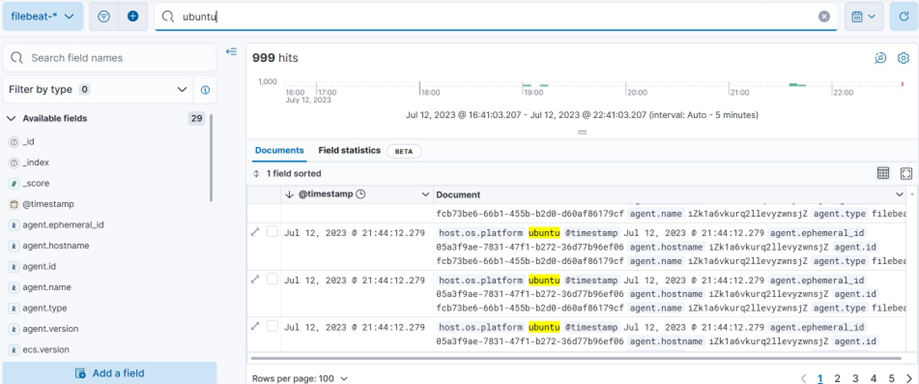
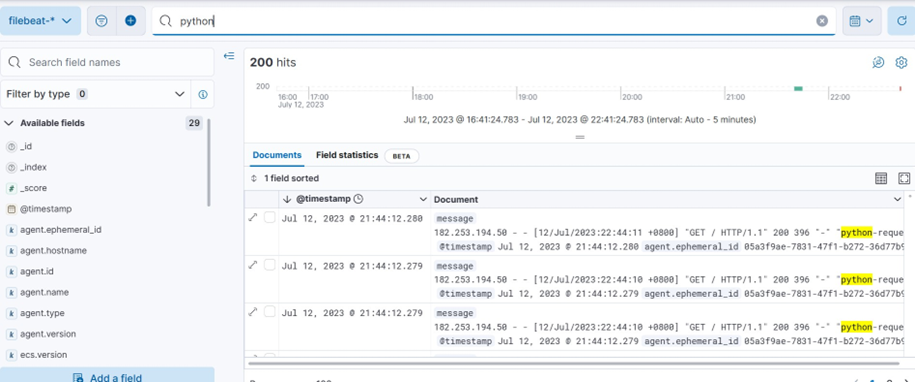
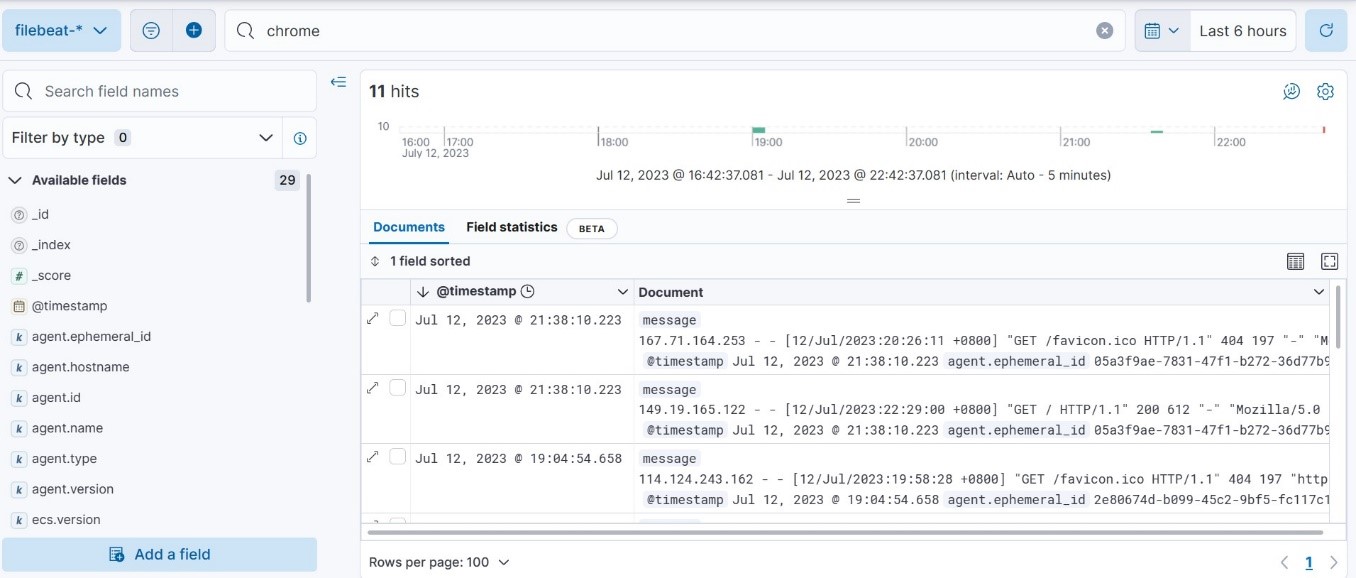
After we sent some requests, we can see the logs on Kibana. Go to Home → Analytic → Discover → choose filebeat-* data view.
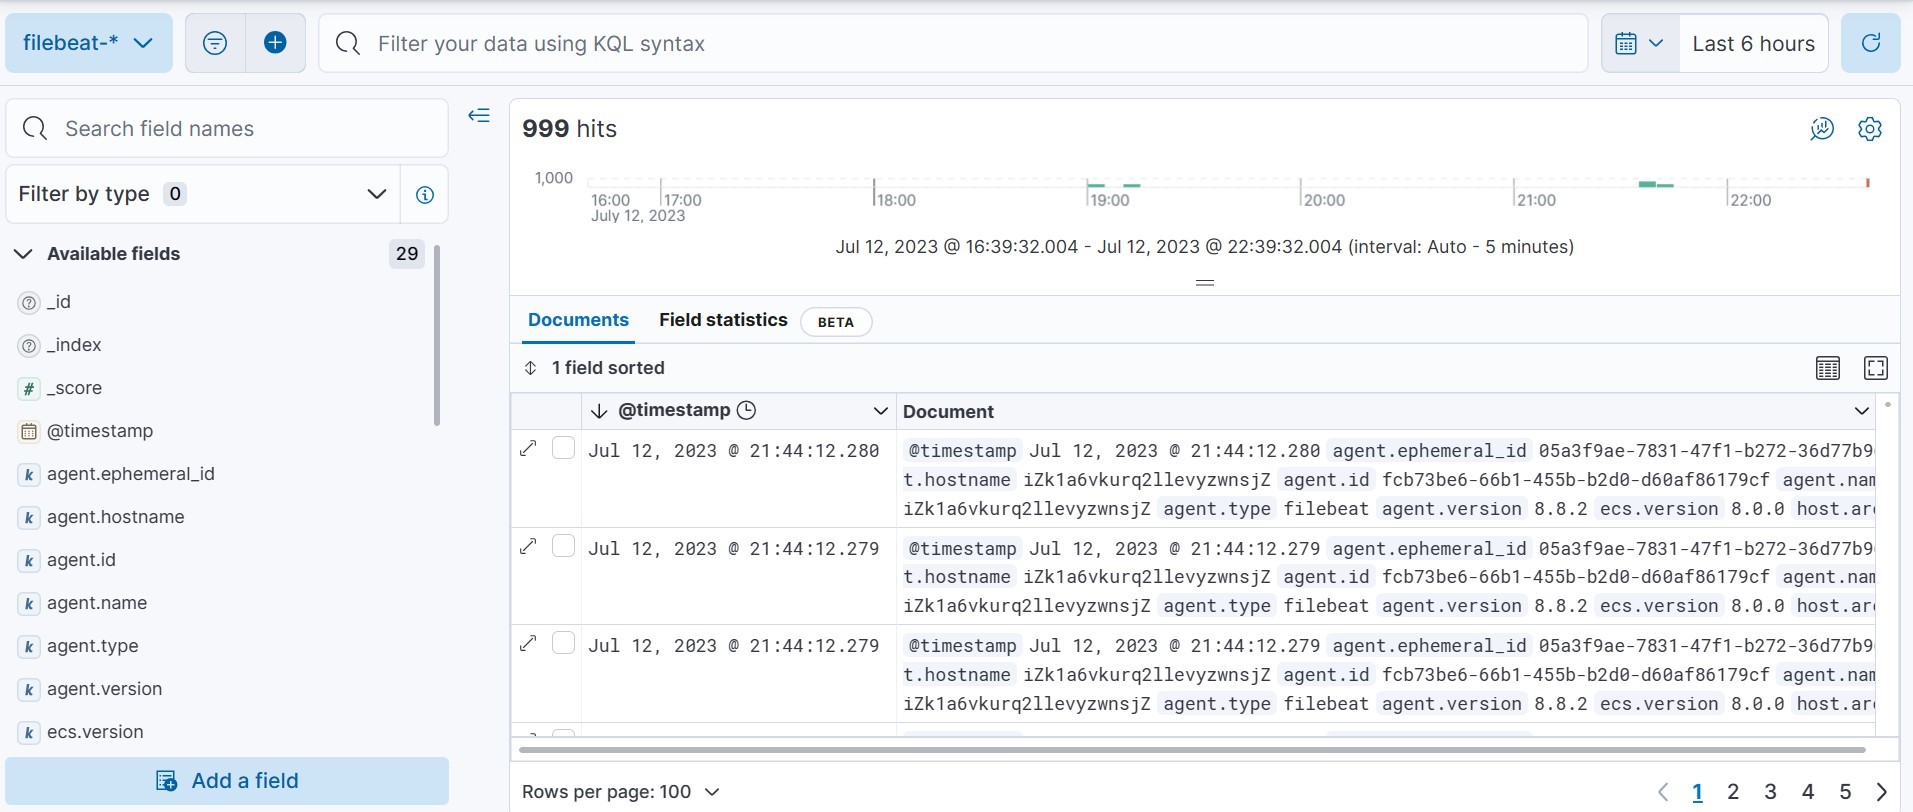
• Logs Visualization
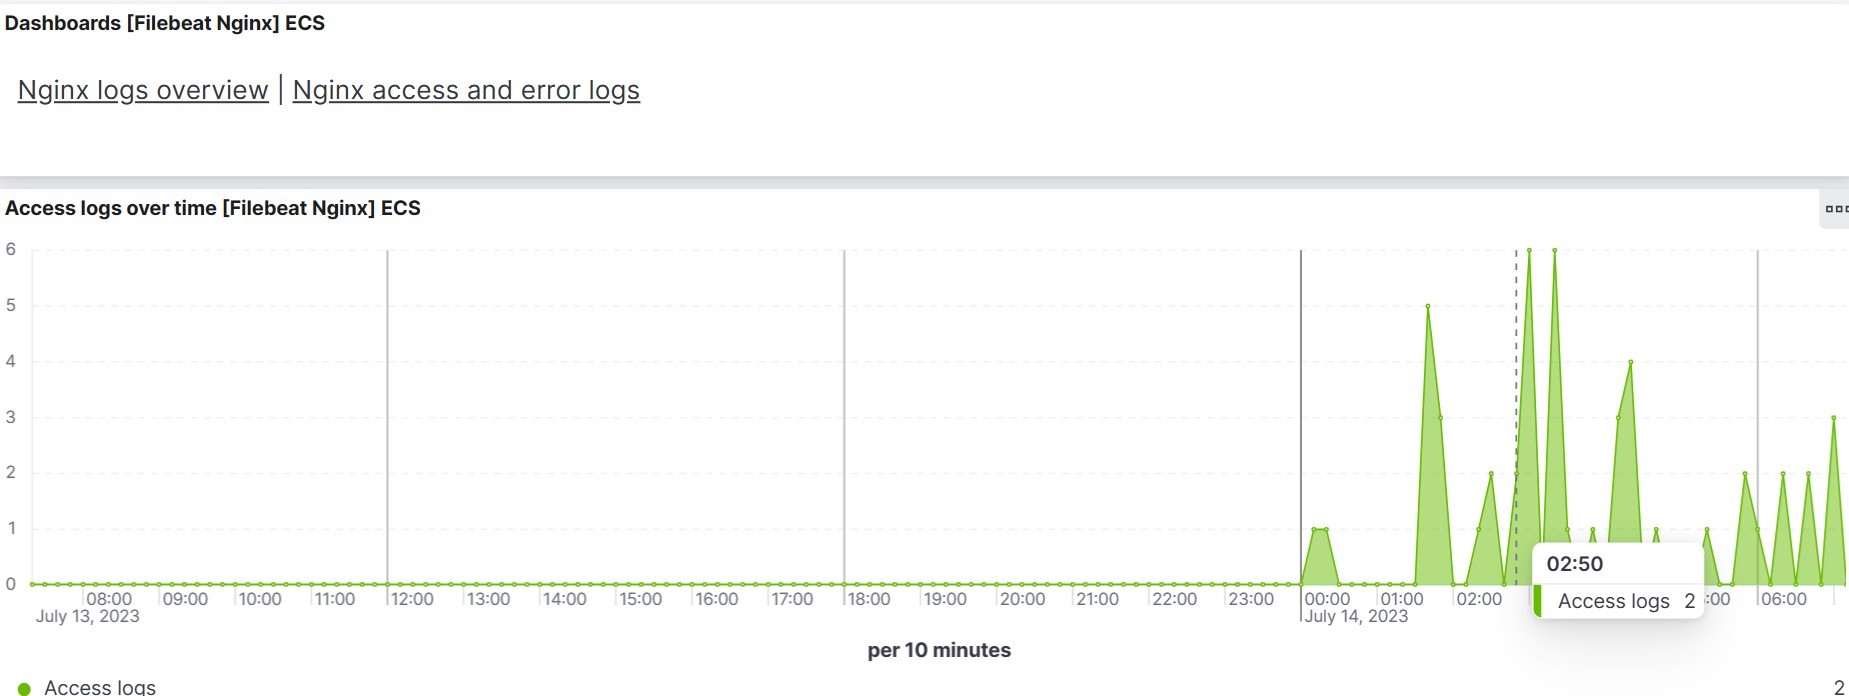
We can see the logs visualization on Kibana. Go to Home→ Analytic → Dashboard→ and search for [Filebeat Nginx] Overview.
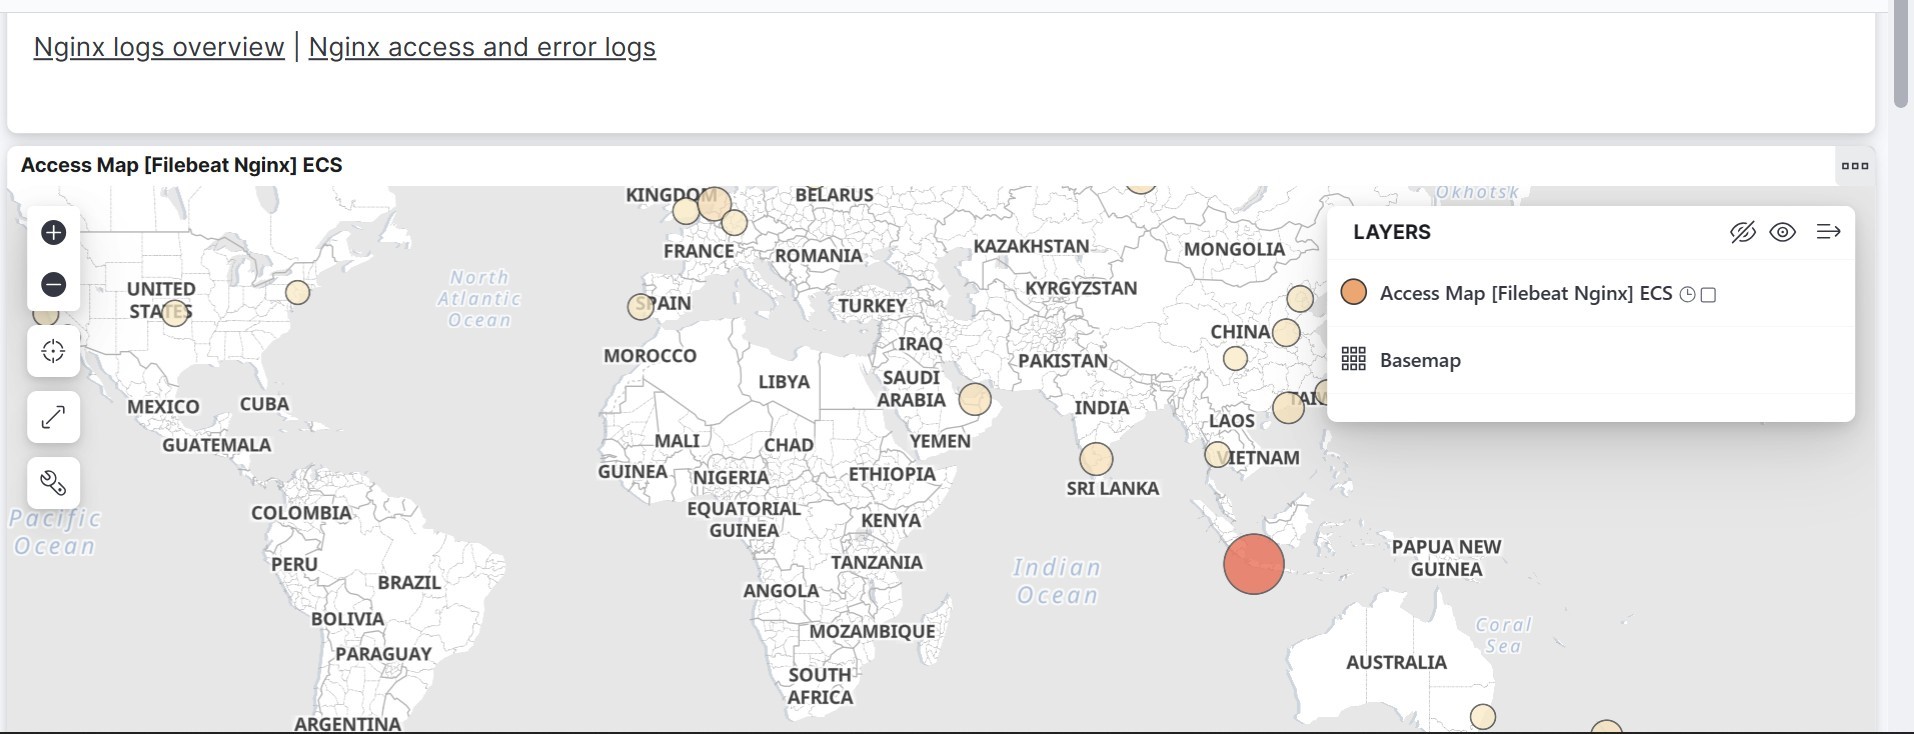

We can send multiple logs to Elasticsearch with Filebeat within one server.
• Enable system module
1) We can enable nginx module on filebeat with filebeat modules enable system command.
2) Go to /etc/filebeat/modules.d/nginx.yml
3) Write this configuration on system.yml file.
- module: system # Syslog syslog:
enabled: true
var.paths: ["/var/log/syslog*"] exclude_files: ['\.gz$']


# Authorization logs auth:
enabled: true
var.paths: ["/var/log/auth.log*"] exclude_files: ['\.gz$']
4) After that, we can restart Filebeat with systemctl restart filebeat
5) Wait unti Filebeat sends all of system indices.
• Logs Visualization
We can see the logs visualization on Kibana. Go to Home → Analytic → Dashboard→ and search for [Filebeat System] Syslog Dashboard
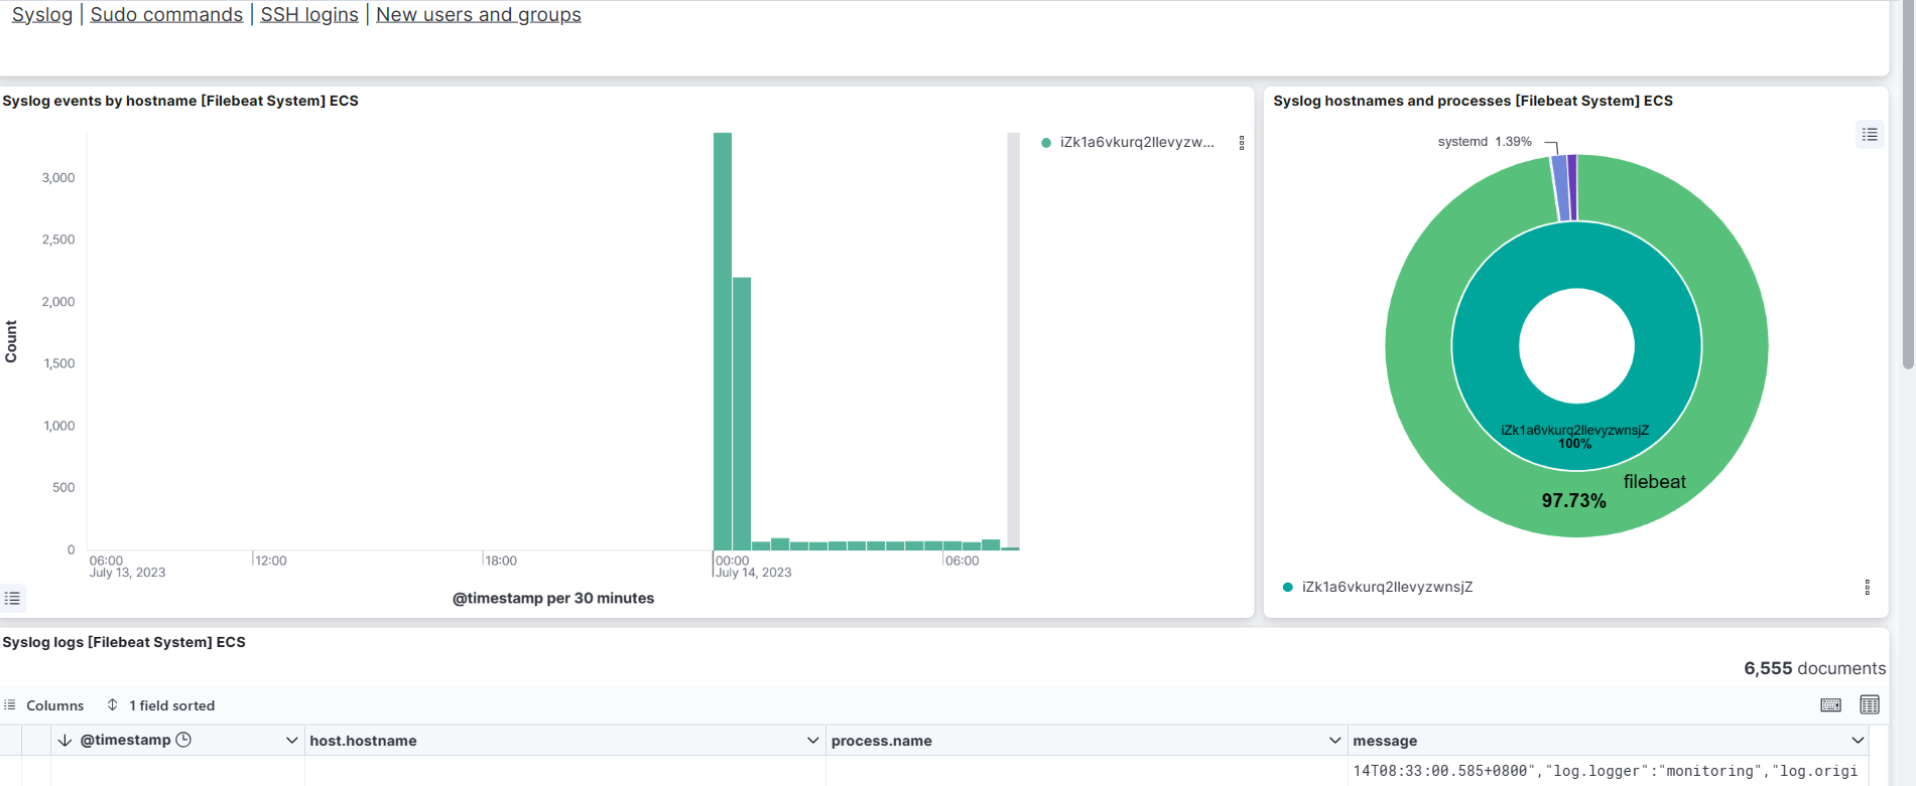
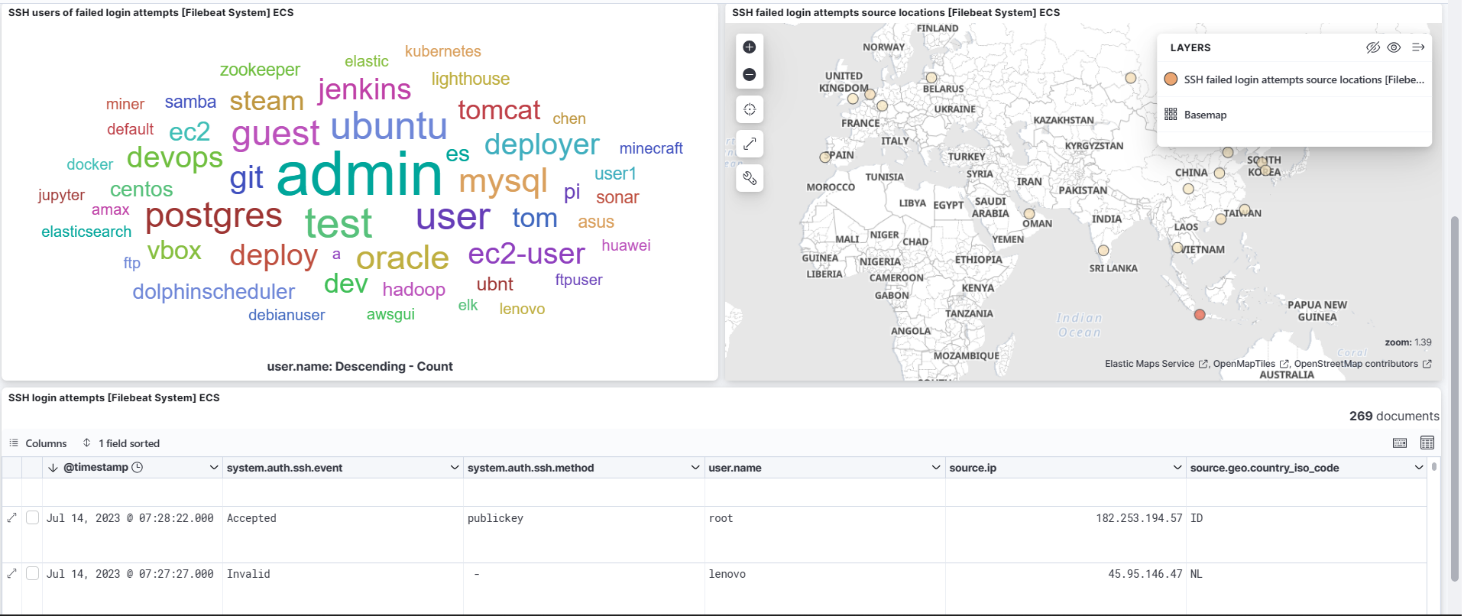
Overall, Filebeat can be serves as a reliable and efficient solution for collecting logs from remote applications and forwarding them to Elasticsearch cluster on Alibaba Cloud, enabling centralized log management, analysis, and monitoring for your system.
116 posts | 21 followers
FollowAlibaba Developer - April 22, 2021
Data Geek - July 25, 2024
Data Geek - July 23, 2024
Alibaba Clouder - January 5, 2021
Data Geek - July 16, 2024
Data Geek - July 11, 2024
116 posts | 21 followers
Follow Alibaba Cloud Elasticsearch
Alibaba Cloud Elasticsearch helps users easy to build AI-powered search applications seamlessly integrated with large language models, and featuring for the enterprise: robust access control, security monitoring, and automatic updates.
Learn More CloudBox
Fully managed, locally deployed Alibaba Cloud infrastructure and services with consistent user experience and management APIs with Alibaba Cloud public cloud.
Learn More Apsara Stack
Apsara Stack is a full-stack cloud solution created by Alibaba Cloud for medium- and large-size enterprise-class customers.
Learn MoreMore Posts by Alibaba Cloud Indonesia