通過配置Nginx內建的stub_status模組,您可以啟用專用的狀態頁即時顯示Nginx伺服器的關鍵計量,例如活躍的用戶端串連數(Active connections)、在讀取要求標頭(Reading)、發送響應(Writing)以及處於等待狀態(Waiting)的串連數。您可以通過Logtail外掛程式採集Nginx監控日誌並進行查詢分析,持續監控Nginx叢集的效能。
前提條件
已在伺服器上安裝Logtail。具體操作,請參見安裝Logtail(Linux系統)或安裝Logtail(Windows系統)。
目前支援Linux Logtail 0.16.0及以上版本,Windows Logtail 1.0.0.8及以上版本。
步驟一:配置stub_status模組
本文以Linux系統為例介紹操作步驟。
執行以下命令,安裝和啟動Nginx。
sudo yum install -y nginx sudo systemctl restart nginx執行以下命令確認Nginx已具備status功能。
nginx -V 2>&1 | grep -o with-http_stub_status_module返回以下資訊,表示已支援status功能。
with-http_stub_status_module配置Nginx伺服器。
開啟Nginx的設定檔,在
server {..}塊中添加以下代碼。關於nginx_status的更多資訊,請參見Nginx status。location /nginx_status { stub_status on; #啟用stub_status模組 access_log off; allow ${伺服器IP}; #允許訪問的伺服器IP deny all; # 拒絕所有其他 IP 位址訪問這個狀態頁面 }執行以下命令,驗證配置結果。
nginx -t
sudo systemctl restart nginx
curl http://${伺服器IP}/nginx_status
返回以下結果,表示配置成功。
Active connections: 1
server accepts handled requests
2507455 2507455 2512972
Reading: 0 Writing: 1 Waiting: 0
步驟二:採集Nginx監控日誌
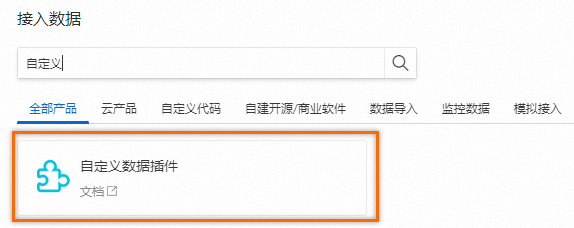
單擊控制台頁面右側的快速接入資料卡片。

在接入資料頁面,尋找自訂資料外掛程式並單擊。
選擇目標Project和Logstore,單擊下一步。
建立機器組。
如果已有可用的機器組,請單擊使用現有機器組。

如果沒有可用的機器組,請執行以下操作。
重要以本帳號下與Log ServiceProject同地區的ECS執行個體為例。對於本帳號其他地區的ECS執行個體、其他帳號的ECS執行個體、其他雲廠商的伺服器或自建IDC,建立機器組的步驟請參見建立使用者自訂標識機器組(推薦)或建立IP地址機器組。
在ECS機器頁簽,選擇目標ECS執行個體,單擊建立。在指定ECS執行個體上安裝Logtail。
安裝完成後,單擊確認安裝完畢。
在建立機器組頁面,輸入名稱,單擊下一步。通過IP地址、使用者自訂標識定義機器組。
確認目標機器組已在應用機器組地區,單擊下一步。
重要建立機器組後立刻應用,可能因為串連未生效,導致心跳為FAIL,您可單擊自動重試。如果還未解決,請參見Logtail機器組無心跳進行排查。
在資料來源設定頁簽中,粘貼以下代碼到外掛程式配置欄,其中${伺服器IP}請替換成您的伺服器IP地址,然後單擊下一步。
{ "inputs": [ { "type": "metric_http", "detail": { "IntervalMs": 60000, "Addresses": [ "http://${伺服器IP}/nginx_status", "http://${伺服器IP}/nginx_status", "http://${伺服器IP}/nginx_status" ], "IncludeBody": true } } ], "processors": [ { "type": "processor_regex", "detail": { "SourceKey": "content", "Regex": "Active connections: (\\d+)\\s+server accepts handled requests\\s+(\\d+)\\s+(\\d+)\\s+(\\d+)\\s+Reading: (\\d+) Writing: (\\d+) Waiting: (\\d+)[\\s\\S]*", "Keys": [ "connection", "accepts", "handled", "requests", "reading", "writing", "waiting" ], "FullMatch": true, "NoKeyError": true, "NoMatchError": true, "KeepSource": false } } ] }inputs為資料來源配置,必選項。
重要一個inputs中只允許配置一個類型的資料來源。
processors為處理配置,用於解析資料。可選項,您可以配置一種或多種處理方式。
如果當前的inputs配置無法滿足日誌解析需求,您可以在外掛程式配置中添加processors配置,即添加Logtail外掛程式處理資料。例如提取欄位、提取日誌時間、脫敏資料、過濾日誌等。更多資訊,請參見使用Logtail外掛程式處理資料。
重要參數說明如下表所示:
參數
類型
是否必須
說明
type
string
是
資料來源類型,固定為metric_http。
IntervalMs
int
是
每次請求的間隔,單位:ms。
Addresses
數組
是
配置為您需要監控的URL列表。
IncludeBody
boolean
否
是否採集請求體,預設值:false。如果為true,則採集後,將請求體內容存放在content欄位中。
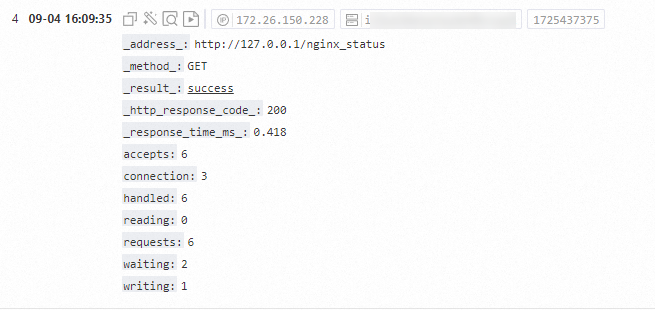
完成採集配置1分鐘後,即可查看日誌,範例如下所示。Log Service預設產生nginx_status儀錶盤,展示查詢和分析結果。
步驟三:查詢和分析日誌
在Project列表地區,單擊目標Project。

在頁簽中,單擊目標Logstore。

輸入查詢和分析語句,然後單擊最近15分鐘,設定查詢和分析的時間範圍。
更多資訊,請參見步驟一:配置索引。
查詢日誌
查詢某IP地址的相關資訊。
_address_: 10.10.0.0查詢回應時間超過100毫秒的請求。
_response_time_ms_ > 100查詢狀態代碼不為200的請求。
not _http_response_code_ : 200
分析日誌
每5分鐘統計一次waiting、reading、writing、connection的平均值。
*| select avg(waiting) as waiting, avg(reading) as reading, avg(writing) as writing, avg(connection) as connection, from_unixtime( __time__ - __time__ % 300) as time group by __time__ - __time__ % 300 order by time limit 1440統計最大等待串連數排名前十的伺服器。
*| select max(waiting) as max_waiting, _address_, from_unixtime(max(__time__)) as time group by address order by max_waiting desc limit 10統計IP地址數量。
* | select count(distinct(_address_)) as total統計請求失敗的IP地址數量。
not _result_ : success | select count(distinct(_address_))統計最近十次請求失敗的IP地址。
not _result_ : success | select _address_ as address, from_unixtime(__time__) as time order by __time__ desc limit 10每5分鐘統計一次請求總數。
*| select avg(handled) * count(distinct(_address_)) as total_handled, avg(requests) * count(distinct(address)) as total_requests, from_unixtime( __time__ - __time__ % 300) as time group by __time__ - __time__ % 300 order by time limit 1440每5分鐘統計一次平均請求延遲。
*| select avg(_response_time_ms_) as avg_delay, from_unixtime( __time__ - __time__ % 300) as time group by __time__ - __time__ % 300 order by time limit 1440統計請求成功的數量和失敗的數量。
not _http_response_code_ : 200 | select count(1)_http_response_code_ : 200 | select count(1)