TimeStream是Elasticsearch團隊自研,並結合Elastic社區時序類產品特性共建的時序引擎。Elasticsearch提供Aliyun-TimeStream時序增強功能外掛程式,支援通過API介面完成TimeStream索引的增刪改查,以及資料寫入和查詢。本文介紹如何使用TimeStream管理Elasticsearch時序資料。
背景資訊
Elasticsearch提供的TimeStream時序增強功能外掛程式,最佳化了Elasticsearch在儲存指標資料方面的DSL(Domain-Specific Language)查詢複雜且慢以及儲存成本過高等問題,詳細資料請參見TimeStream時序增強引擎介紹。本文主要介紹如何使用TimeStream,涉及到的API可通過查詢API文檔獲得完整資訊,詳細資料請參見TimeStream API功能介紹和TimeStream整合Prometheus介面。
前提條件
已建立Elasticsearch執行個體,且執行個體版本為通用商業版7.16及以上、核心版本為1.7.0及以上,或者執行個體版本為通用商業版7.10、核心版本為1.8.0及以上。具體操作請參見建立Elasticsearch執行個體。
管理時序索引
建立時序索引
PUT _time_stream/test_stream與直接通過Elasticsearch create index命令(PUT test_stream)建立的索引相比,通過TimeStream的建立索引介面建立的索引是DataStream索引,而不是一個具體的索引,並且自動整合了Elasticsearch在時序情境的最佳實務配置。
GET _time_stream/test_stream{
"time_streams" : {
"test_stream" : {
"name" : "test_stream",
"data_stream_name" : "test_stream",
"time_stream_config" : {
"labels_fields" : {
"includes" : [
"labels.*"
],
"excludes" : [ ]
},
"metrics_fields" : {
"includes" : [
"metrics.*"
],
"excludes" : [ ]
},
"label_prefix" : "labels.",
"metric_prefix" : "metrics.",
"downsample" : [ ]
},
"template_name" : ".timestream_test_stream",
"template" : {
"index_patterns" : [
"test_stream"
],
"template" : {
"settings" : {
"index" : {
"mode" : "time_series",
"codec" : "ali",
"refresh_interval" : "10s",
"ali_codec_service" : {
"enabled" : "true",
"source_reuse_doc_values" : {
"enabled" : "true"
}
},
"translog" : {
"durability" : "ASYNC"
},
"doc_value" : {
"compression" : {
"default" : "zstd"
}
},
"postings" : {
"compression" : "zstd"
},
"source" : {
"compression" : "zstd"
},
"routing_path" : [
"labels.*"
]
}
},
"mappings" : {
"numeric_detection" : true,
"dynamic_templates" : [
{
"labels_template_match_labels.*" : {
"path_match" : "labels.*",
"mapping" : {
"time_series_dimension" : "true",
"type" : "keyword"
},
"match_mapping_type" : "*"
}
},
{
"metrics_double_match_metrics.*" : {
"path_match" : "metrics.*",
"mapping" : {
"index" : "false",
"type" : "double"
},
"match_mapping_type" : "double"
}
},
{
"metrics_long_match_metrics.*" : {
"path_match" : "metrics.*",
"mapping" : {
"index" : "false",
"type" : "long"
},
"match_mapping_type" : "long"
}
}
],
"properties" : {
"@timestamp" : {
"format" : "epoch_millis||strict_date_optional_time",
"type" : "date"
}
}
}
},
"composed_of" : [ ],
"data_stream" : {
"hidden" : false
}
},
"version" : 1
}
}
}| 參數 | 說明 |
| index.mode | 取值time_series,表示建立的索引類型是time_series索引,系統會自動整合Elasticsearch在時序情境的最佳實務配置。 |
| index.codec | 取值ali,表示使用aliyun-codec索引壓縮外掛程式。與以下參數配合使用,可以極大減少磁碟儲存空間:
|
- 維度欄位:預設使用keyword類型,然後配置time_series_dimension=true,標識為維度欄位。index.mode=time_series會把所有time_series_dimension=true的欄位拼裝成一個時間軸id(_tsid)的內部欄位。
- 指標欄位:支援double和long類型,只儲存doc_values,不儲存索引。
- 自訂索引的shard數量
PUT _time_stream/test_stream { "template": { "settings": { "index": { "number_of_shards": "2" } } } } - 自訂索引的資料模型
PUT _time_stream/test_stream
{
  "template": {
    "settings": {
      "index": {
        "number_of_shards": "2"
      }
    }
  },
  "time_stream": {
    "labels_fields": ["labels_*"],
    "metrics_fields": ["metrics_*"]
}
更新時序索引
POST _time_stream/test_stream/_update
{
  "template": {
    "settings": {
      "index": {
        "number_of_shards": "4"
      }
    }
  }
}- 更新內容會全量覆蓋索引的配置,因此在執行更新命令時,需要保留無需更新的配置。建議通過
GET _time_stream/test_stream命令擷取索引的全量配置資訊,再在其基礎上進行修改。 - 更新時序索引配置後,新配置不會立即生效,需要等到索引進行一次rollover,產生新索引後,在新索引上生效。您可以通過
POST test_stream/_rollover命令手動執行rollover。
刪除時序索引
Delete _time_stream/test_stream使用時序索引
時序索引的使用方式與普通索引一致,具體說明如下。
寫入時序資料
POST test_stream/_doc
{
  "@timestamp": 1630465208722,
  "metrics": {
    "cpu.idle": 79.67298116109929,
    "disk_ioutil": 17.630910821570456,
    "mem.free": 75.79973639970004
  },
  "labels": {
    "disk_type": "disk_type2",
    "namespace": "namespaces1",
    "clusterId": "clusterId3",
    "nodeId": "nodeId5"
  }
}
寫入資料時,DataStream會根據@timestamp的值來決定寫到哪個索引,所以上述用例中@timestamp要設定在當前test_stream索引的時間區間上。
時間區間中的時間為UTC時間格式,例如2022-06-21T00:00:00.000Z。如果您所在時區為東8區(北京時間),需要在UTC時間上加8小時轉換為北京時間,轉換後對應的時間為2022-06-21T00:00:00.000+08:00,即2022-06-21T08:00:00.000。
查詢時序資料
GET test_stream/_searchGET _cat/indices/test_stream?v&s=i查詢時序索引指標
GET _time_stream/test_stream/_stats{
"_shards" : {
"total" : 2,
"successful" : 2,
"failed" : 0
},
"time_stream_count" : 1,
"indices_count" : 1,
"total_store_size_bytes" : 19132,
"time_streams" : [
{
"time_stream" : "test_stream",
"indices_count" : 1,
"store_size_bytes" : 19132,
"tsid_count" : 2
}
]
}使用Prometheus介面查詢資料
- 在Grafana控制台中配置通過在Grafana控制台中配置Prometheus資料來源,並在URL中指定
/_time_stream/prom/test_streamURI,直接將TimeStream索引作為Grafana的Prometheus資料來源使用,如下圖所示。
- 使用Prometheus API配置
使用Prometheus API,去掉返回的指標和維度欄位的關鍵字前尾碼。例如,使用預設的資料模型,指標首碼metric.會被去掉,維度首碼label.會被去掉。
如果自訂了資料模型,則需要額外配置前尾碼關鍵字,否則Prometheus API返回的就是實際的資料。配置前尾碼關鍵字的樣本如下。PUT _time_stream/{name} { "time_stream": { "labels_fields": "@labels.*_l", "metrics_fields": "@metrics.*_m", "label_prefix": "@labels.", "label_suffix": "_l", "metric_prefix": "@metrics.", "metric_suffix": "_m" } }
中繼資料查詢
- 查看test_stream索引中的所有指標。
GET /_time_stream/prom/test_stream/metadata預期結果如下。{ "status" : "success", "data" : { "cpu.idle" : [ { "type" : "gauge", "help" : "", "unit" : "" } ], "disk_ioutil" : [ { "type" : "gauge", "help" : "", "unit" : "" } ], "mem.free" : [ { "type" : "gauge", "help" : "", "unit" : "" } ] } } - 查看test_stream索引中的所有維度。
GET /_time_stream/prom/test_stream/labels預期結果如下。{ "status" : "success", "data" : [ "__name__", "clusterId", "disk_type", "namespace", "nodeId" ] } - 查看test_stream索引中,某個具體維度全部value。
GET /_time_stream/prom/test_stream/label/clusterId/values預期結果如下。{ "status" : "success", "data" : [ "clusterId1", "clusterId3" ] } - 查看test_stream索引中,cpu.idle指標全部的時間軸。
GET /_time_stream/prom/test_stream/series?match[]=cpu.idle預期結果如下。{ "status" : "success", "data" : [ { "__name__" : "cpu.idle", "disk_type" : "disk_type1", "namespace" : "namespaces2", "clusterId" : "clusterId1", "nodeId" : "nodeId2" }, { "__name__" : "cpu.idle", "disk_type" : "disk_type1", "namespace" : "namespaces2", "clusterId" : "clusterId1", "nodeId" : "nodeId5" }, { "__name__" : "cpu.idle", "disk_type" : "disk_type2", "namespace" : "namespaces1", "clusterId" : "clusterId3", "nodeId" : "nodeId5" } ] }
資料查詢
- 通過Prometheus instant query介面查詢資料
GET /_time_stream/prom/test_stream/query?query=cpu.idle&time=1655769837說明 time的單位為秒,不傳遞時,預設查詢最新5分鐘內的資料。返回結果為Prometheus query介面的資料格式,如下所示。{ "status" : "success", "data" : { "resultType" : "vector", "result" : [ { "metric" : { "__name__" : "cpu.idle", "clusterId" : "clusterId1", "disk_type" : "disk_type1", "namespace" : "namespaces2", "nodeId" : "nodeId2" }, "value" : [ 1655769837, "79.672981161" ] }, { "metric" : { "__name__" : "cpu.idle", "clusterId" : "clusterId1", "disk_type" : "disk_type1", "namespace" : "namespaces2", "nodeId" : "nodeId5" }, "value" : [ 1655769837, "79.672981161" ] }, { "metric" : { "__name__" : "cpu.idle", "clusterId" : "clusterId3", "disk_type" : "disk_type2", "namespace" : "namespaces1", "nodeId" : "nodeId5" }, "value" : [ 1655769837, "79.672981161" ] } ] } } - 通過Prometheus range query介面查詢資料
GET /_time_stream/prom/test_stream/query_range?query=cpu.idle&start=1655769800&end=16557699860&step=1m預期結果如下。{ "status" : "success", "data" : { "resultType" : "matrix", "result" : [ { "metric" : { "__name__" : "cpu.idle", "clusterId" : "clusterId1", "disk_type" : "disk_type1", "namespace" : "namespaces2", "nodeId" : "nodeId2" }, "value" : [ [ 1655769860, "79.672981161" ] ] }, { "metric" : { "__name__" : "cpu.idle", "clusterId" : "clusterId1", "disk_type" : "disk_type1", "namespace" : "namespaces2", "nodeId" : "nodeId5" }, "value" : [ [ 1655769860, "79.672981161" ] ] }, { "metric" : { "__name__" : "cpu.idle", "clusterId" : "clusterId3", "disk_type" : "disk_type2", "namespace" : "namespaces1", "nodeId" : "nodeId5" }, "value" : [ [ 1655769860, "79.672981161" ] ] } ] } }
使用DownSample功能
PUT _time_stream/test_stream
{
  "time_stream": {
    "downsample": [
      {
        "interval": "1m"
      },
      {
        "interval": "10m"
      },
      {
        "interval": "60m"
      }
    ]
  }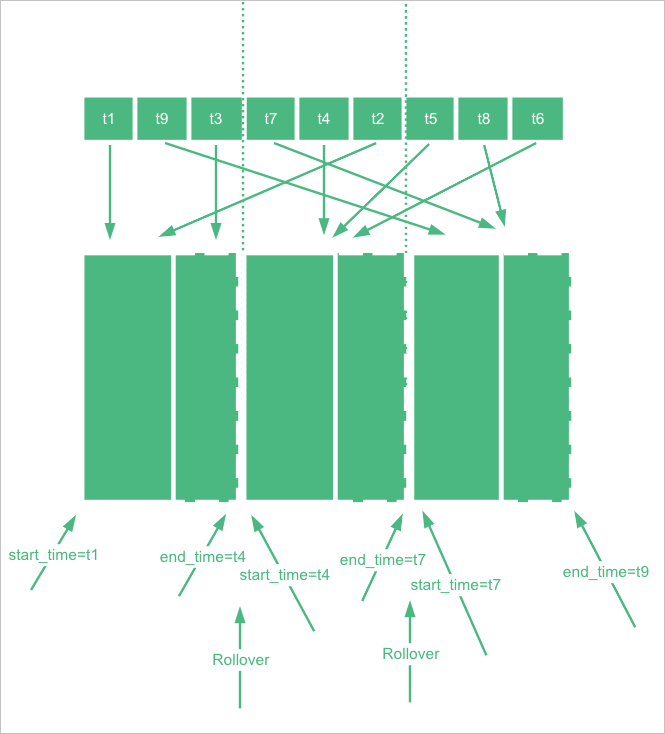
}- DownSample操作是對一個原始索引執行DownSample,產生DownSample索引。DownSample操作是在索引rollover後產生了一個新索引,然後舊索引過了一段時間,不再寫入資料時進行的。目前預設是目前時間比舊索引的end_time大兩小時才開始進行DownSample。為了類比這個效果,建立索引時可以手動指定start_time和end_time。重要 最新索引的end_time會被Elasticsearch修改為最新時間,影響DownSample示範,預設是5分鐘修改一次。DownSample示範操作要確保end_time不被修改,end_time值可通過
GET {index}/_settings命令查看。PUT _time_stream/test_stream { "template": { "settings": { "index.time_series.start_time": "2022-06-20T00:00:00.000Z", "index.time_series.end_time": "2022-06-21T00:00:00.000Z" } }, "time_stream": { "downsample": [ { "interval": "1m" }, { "interval": "10m" }, { "interval": "60m" } ] } } - 設定索引的end_time比目前時間至少小兩個小時,然後寫入一些資料(需要調整@timestamp為start_time和end_time之間的時間)。
POST test_stream/_doc { "@timestamp": 1655706106000, "metrics": { "cpu.idle": 79.67298116109929, "disk_ioutil": 17.630910821570456, "mem.free": 75.79973639970004 }, "labels": { "disk_type": "disk_type2", "namespace": "namespaces1", "clusterId": "clusterId3", "nodeId": "nodeId5" } } - 寫入一些資料後,需要更新TimeStream索引,去掉start_time和end_time。
POST _time_stream/test_stream/_update { "time_stream": { "downsample": [ { "interval": "1m" }, { "interval": "10m" }, { "interval": "60m" } ] } } - 對索引執行rollover命令。
POST test_stream/_rollover - rollover完成後,通過
GET _cat/indices/test_stream?v&s=i命令,查看test_stream產生的DownSample索引。預期結果如下。health status index uuid pri rep docs.count docs.deleted store.size pri.store.size green open .ds-test_stream-2022.06.21-000001 vhEwKIlwSGO3ax4RKn**** 1 1 9 0 18.5kb 12.1kb green open .ds-test_stream-2022.06.21-000001_interval_10m r9Tsj0v-SyWJDc64oC**** 1 1 1 0 15.8kb 7.9kb green open .ds-test_stream-2022.06.21-000001_interval_1h cKsAlMK-T2-luefNAF**** 1 1 1 0 15.8kb 7.9kb green open .ds-test_stream-2022.06.21-000001_interval_1m L6ocasDFTz-c89KjND**** 1 1 1 0 15.8kb 7.9kb green open .ds-test_stream-2022.06.21-000002 42vlHEFFQrmMAdNdCz**** 1 1 0 0 452b 226b
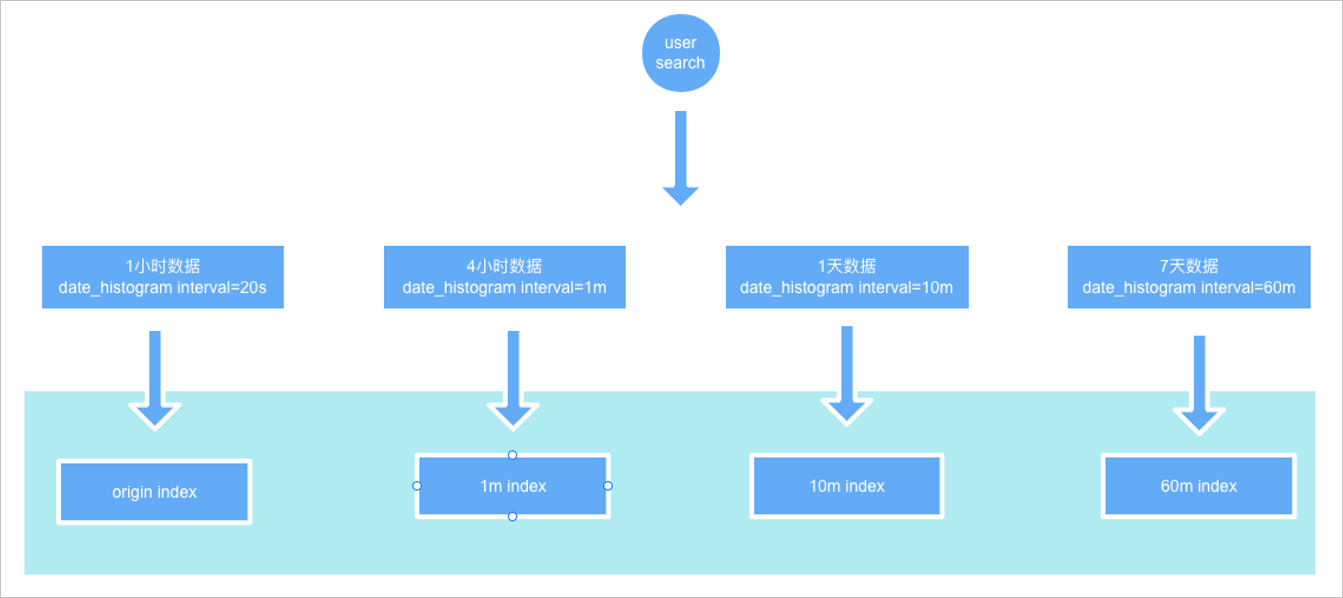
GET test_stream/_search?size=0&request_cache=false
{
  "aggs": {
    "1": {
      "terms": {
        "field": "labels.disk_type",
        "size": 10
      },
      "aggs": {
        "2": {
          "date_histogram": {
            "field": "@timestamp",
            "fixed_interval": "120m"
          }
        }
      }
    }
  }
}{
"took" : 15,
"timed_out" : false,
"_shards" : {
"total" : 2,
"successful" : 2,
"skipped" : 0,
"failed" : 0
},
"hits" : {
"total" : {
"value" : 1,
"relation" : "eq"
},
"max_score" : null,
"hits" : [ ]
},
"aggregations" : {
"1" : {
"doc_count_error_upper_bound" : 0,
"sum_other_doc_count" : 0,
"buckets" : [
{
"key" : "disk_type2",
"doc_count" : 9,
"2" : {
"buckets" : [
{
"key_as_string" : "2022-06-20T06:00:00.000Z",
"key" : 1655704800000,
"doc_count" : 9
}
]
}
}
]
}
}
}
根據hits.total.value=1可以看到,只命中了一條記錄。aggs結果的doc_count=9,表示實際索引資料量是9,因此可以看到使用者查詢的不是原始索引,而是DownSample索引。
如果將fixed_interval改為20s,那麼可以看到結果的hits.total.value=9,與aggs結果的doc_count結果一致,說明查詢到了原始索引。
由此可見,這些DownSample索引跟原始索引的settings和mappings是一致的,只是資料是按時間範圍做了降採樣。