Application Real-time Monitoring Service (ARMS) allows you to create alert rules. If an alert is triggered, the system sends alert notifications to the specified contact group based on the notification methods specified in the alert rule. This way, you can handle the alert at the earliest opportunity.
Prerequisites
- A monitoring task is created. For more information, see Create an application monitoring job.
- Contacts are created. Only contact groups can be set as the notification receiver of an alert.
Background information
By default, alert notifications are sent based on the following rules:
- To prevent you from receiving a large number of alert notifications in a short period of time, the system sends only one message for repeated alerts within 24 hours.
- If no repeated alerts are generated within 5 minutes, the system sends a recovery email to notify you that the alert is cleared.
- After a recovery email is sent, the system resets the alert status. If this alert arises again, it is deemed a new one.
An alert widget is essentially a data display method for datasets. When an alert widget is created, a dataset is also created to store the underlying data of the alert widget.
Create an application monitoring alert rule
To create an alert for an application monitoring task on Java Virtual Machine-Garbage Collection (JVM-GC) times in period-over-period comparison, perform the following steps:
- Log on to the ARMS console.
- In the left-side navigation pane, choose .
- On the Alert Policies page, choose in the upper-right corner.
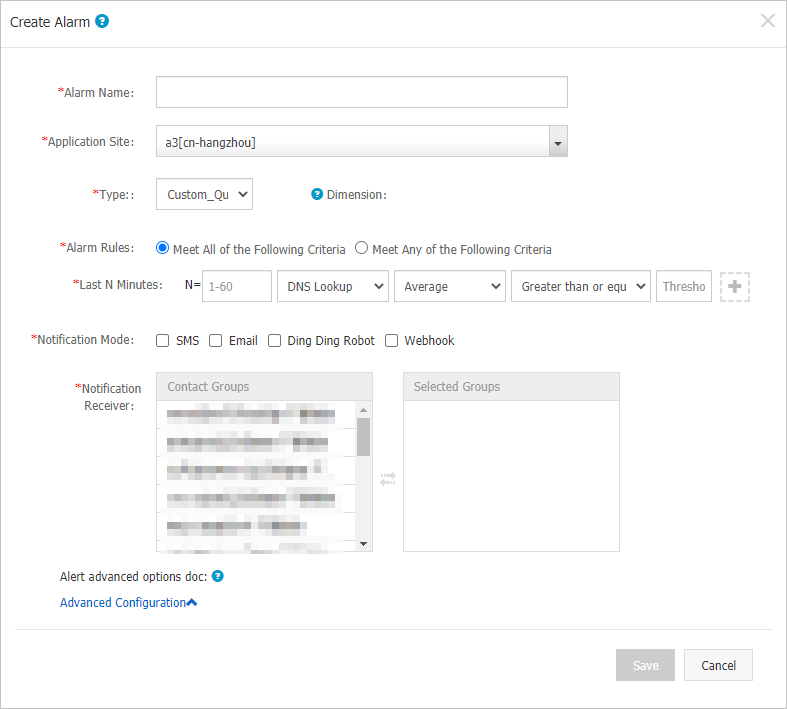
- In the Create Alarm dialog box, enter all required information and click Save.
- Specify a value for Last N Minutes to configure alert conditions. For example, if the average error rate in the last 5 minutes is greater than or equal to 100%, an alert is triggered. Note To add more alert rules, click the
 icon next to Last N Minutes.
- Specify a value for Last N Minutes to configure alert conditions. For example, if the average error rate in the last 5 minutes is greater than or equal to 100%, an alert is triggered.
Create a browser monitoring alert rule
To create a Page_Metric alert rule to monitor JS_Error_Rate and JS_Error_Count for a browser monitoring job, perform the following steps:
- In the left-side navigation pane, choose .
- On the Alert Policies page, choose in the upper-right corner.
- In the Create Alarm dialog box, enter all required information and click Save.
Create a Prometheus alert rule
To create an alert rule for a Prometheus monitoring job such as an alert on network receiving pressure, perform the following steps:
- You can select one of the two available methods to go to the Create Alarm dialog box.
- On the New DashBoard page of the Prometheus Grafana dashboard, click the icon to go to the ARMS Prometheus Create Alarm dialog box.
- In the left-side navigation pane of the console, choose . On the Alarm Policies page, choose in the upper-right corner.
- In the Create Alarm dialog box, enter all required information and click Save.

Description of basic fields
The following table describes the basic fields in the Create Alarm dialog box.
| Field | Meaning | Description |
|---|---|---|
| Application Site | The monitoring task that is created. | Select a value from the drop-down list. |
| Type | The type of the alert metric. | The metric types for the following three alerts are different:
|
| Dimension | The dimension for the specified metric (dataset). You can select None, =, or Traverse. |
|
| Last N Minutes | The system checks whether the data results in the last N minutes meet the trigger condition. | Valid values of N: 1 to 60. |
| Notification Mode | You can select Email, SMS, Ding Ding Robot, and Webhook. | You can select multiple notification methods. For information about how to configure a DingTalk chatbot alert, see Configure a DingTalk chatbot to send alert notifications. |
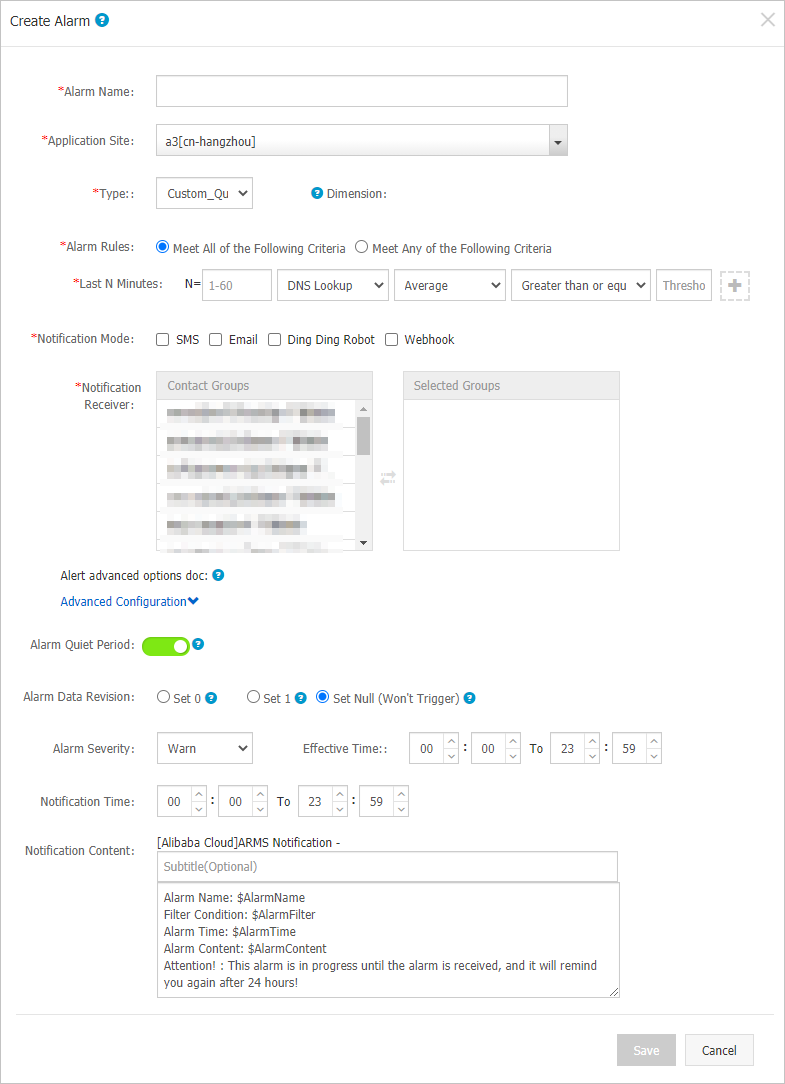
| Alarm Quiet Period | You can turn on or turn off Alarm Quiet Period. By default, the switch is turned on. |
|
| Alarm Severity | Valid values: Warn, Error, and Fatal. | N/A |
| Notification Time | The time range during which alert notifications can be sent. No alert notifications are sent outside of this time range, but alert events are recorded. | For more information about alert event records, see Manage alerts. |
| Notification Content | The custom content of the alert notification. | You can edit the default template. In the template, the following four variables must be specified: $AlarmName, $AlarmFilter, $AlarmTime, and $AlarmContent. The rest of the content can be customized. Other variables are not supported. |
Description of complex general fields: period-over-period comparison
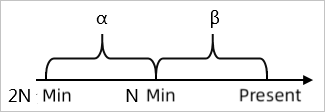
- N-minute-on-N-minute comparison: Assume that β is the data (optionally average, sum, maximum, or minimum) in the last N minutes, and α is the data generated between the Nth minute and the 2Nth minute. The N-minute-on-N-minute comparison is the percentage increase or decrease when β is compared with α.
- N-minute-on-N-minute hourly comparison: Assume that β is the data (optionally average, sum, maximum or minimum) in the last N minutes, and α is the data generated during the last N minutes in the previous hour. The N-minute-on-N-minute hourly comparison is the percentage increase or decrease when β is compared with α.

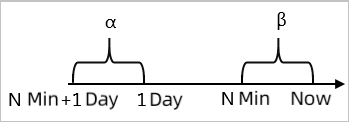
- N-minute-on-N-minute daily comparison: Assume that β is the data (optionally average, sum, maximum or minimum) in the last N minutes, and α is the data generated during the last N minutes at the same time in the previous day. The N-minute-on-N-minute daily comparison is the percentage increase or decrease when β is compared with α.
Description of complex general fields: Alarm Data Revision
You can set Alarm Data Revision to Set 0, Set 1, or Set Null (Won't Trigger). This feature allows you to fix data anomalies, such as no data, abnormal composite metrics, and abnormal period-over-period comparisons.
- Fill 0: fixes the checked value to 0.
- Fill 1: fixes the checked value to 1.
- Set Null (Won't Trigger): does not trigger the alert
Scenarios:
- Anomaly 1: no data
User A wants to use the alerting feature to monitor page views. When User A creates an alert rule in Browser Monitoring, User A specifies that an alert is triggered when N is 5, and the sum of page views is less than or equal to 10. If the page is not accessed, no data is reported, and no alert notification is sent. To resolve this issue, User A can select Fill 0 for the Alarm Data Revision Policy parameter. If no data is received, the system determines that zero data records are received. This meets the conditions specified in the alert rule, and an alert notification is sent.
- Anomaly 2: abnormal period-over-period comparisons
User C wants to use the alerting feature to monitor the CPU usage of a node. When User C creates an alert rule in Application Monitoring, User C specifies that an alert is triggered when N is 3, and the average CPU usage of the node decreases by 100% compared with that in the previous monitoring period. If the CPU fails in the last N minutes, the system cannot obtain α, which is used to calculate the period-over-period comparison result. In this case, the comparison result does not exist. No alert notification is sent. To resolve this issue, User C can select Fill 1 for the Alarm Data Revision Policy parameter. If α is not obtained, the system determines that the period-over-period comparison result is a decrease of 100%. This meets the conditions specified in the alert rule, and an alert notification is sent.
What to do next
You can query and delete alert records in alert management.