Fluid是開源Kubernetes原生的分布式資料集編排和加速引擎,主要服務於雲原生情境下的資料密集型應用,例如巨量資料應用、AI應用等。Fluid提供面嚮應用的資料集統一抽象、可擴充的資料引擎外掛程式、自動化資料操作、通用資料加速、運行時平台無關等核心功能。阿里雲Prometheus監控支援一鍵安裝Fluid組件,並提供開箱即用的監控大盤。本文介紹如何為Fluid開啟Prometheus監控。
前提條件
已為ACK叢集或ACK Serverless叢集開啟阿里雲Prometheus監控。具體操作,請參見使用阿里雲Prometheus監控。
已部署雲原生AI套件(選擇開啟Fluid資料加速功能)。具體操作,請參見部署雲原生AI套件。
如需使用Fluid控制面監控大盤的完整能力,請確保叢集中啟動並執行ack-fluid組件版本為0.9.7及以上。
如需使用Fluid JindoRuntime緩衝系統監控大盤的完整能力,請確保叢集中啟動並執行ack-fluid組件版本為1.0.11及以上。
使用限制
緩衝系統監控大盤僅支援對JindoRuntime類型(JindoCache緩衝引擎)的緩衝運行時組件進行監控。
步驟一:接入Fluid
登入ARMS控制台。
在左側導覽列單擊接入中心,然後在人工智慧地區單擊Fluid卡片。
在Fluid頁面的選擇Container Service叢集地區,選擇目的地組群。若顯示已經安裝Fluid組件,則無需再重複安裝。
在配置資訊地區配置參數,然後單擊確定,完成組件接入。
配置項
說明
接入名稱(非必填)
當前Fluid監控唯一名稱,可留空。
metrics採集間隔(秒)
監控資料擷取時間間隔。
已接入的組件可在ARMS控制台的接入管理頁面查看。
登入ARMS控制台。
在左側導覽列單擊接入管理,然後單擊已接入組件頁簽,選擇單擊Fluid組件的卡片。
在環境列表頁簽下,單擊操作列的查看詳情,即可查看目的地組群Fluid的組件、大盤警示規則等資訊。
步驟二:查看Fluid大盤資料
(推薦)從Container Service控制台查看Fluid大盤資料
登入Container Service管理主控台,在左側導覽列單擊叢集。
在叢集列表頁面,單擊已接入Fluid組件的ACK叢集或ACK Serverless叢集,然後在左側導覽列,選擇。
在Prometheus監控頁面,選擇,查看Fluid控制面監控大盤的詳情資料。
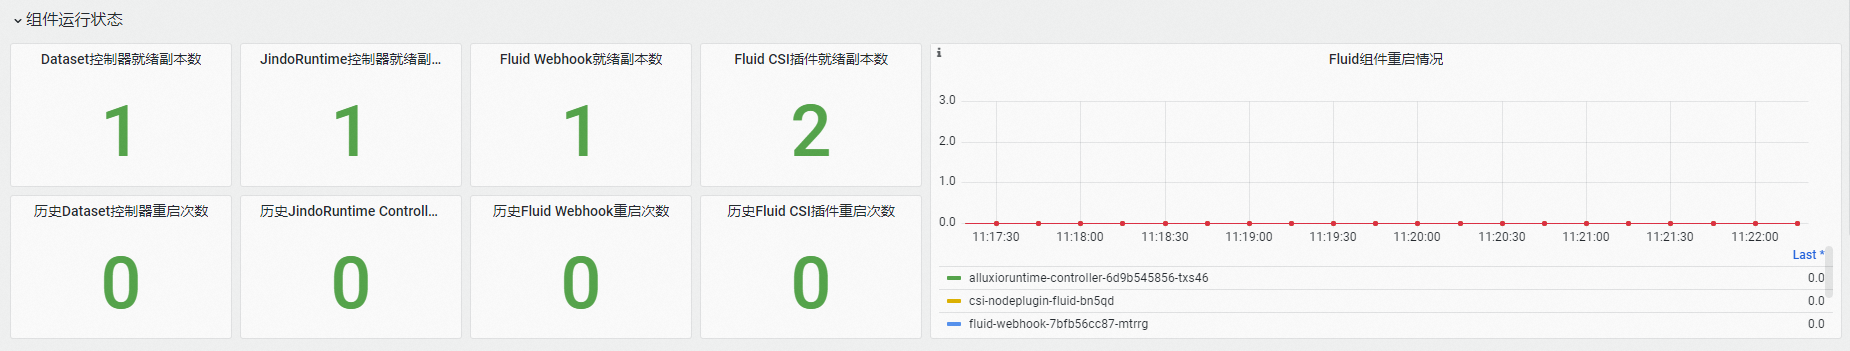
在Fluid控制面監控大盤中,您可以查看有關Fluid控制面組件的詳情資料,Prometheus監控提供的Fluid大盤資料包括Fluid組件運行狀態、Fluid控制器處理耗時、Fluid Webhook處理請求量QPS、請求處理時延,以及各組件資源使用量等等。更多詳細資料,請參見Fluid監控大盤參數說明。
在組件運行狀態地區,可查看Fluid控制面組件的就緒Pod數量,歷史重啟次數和歷史重啟時刻等資訊。
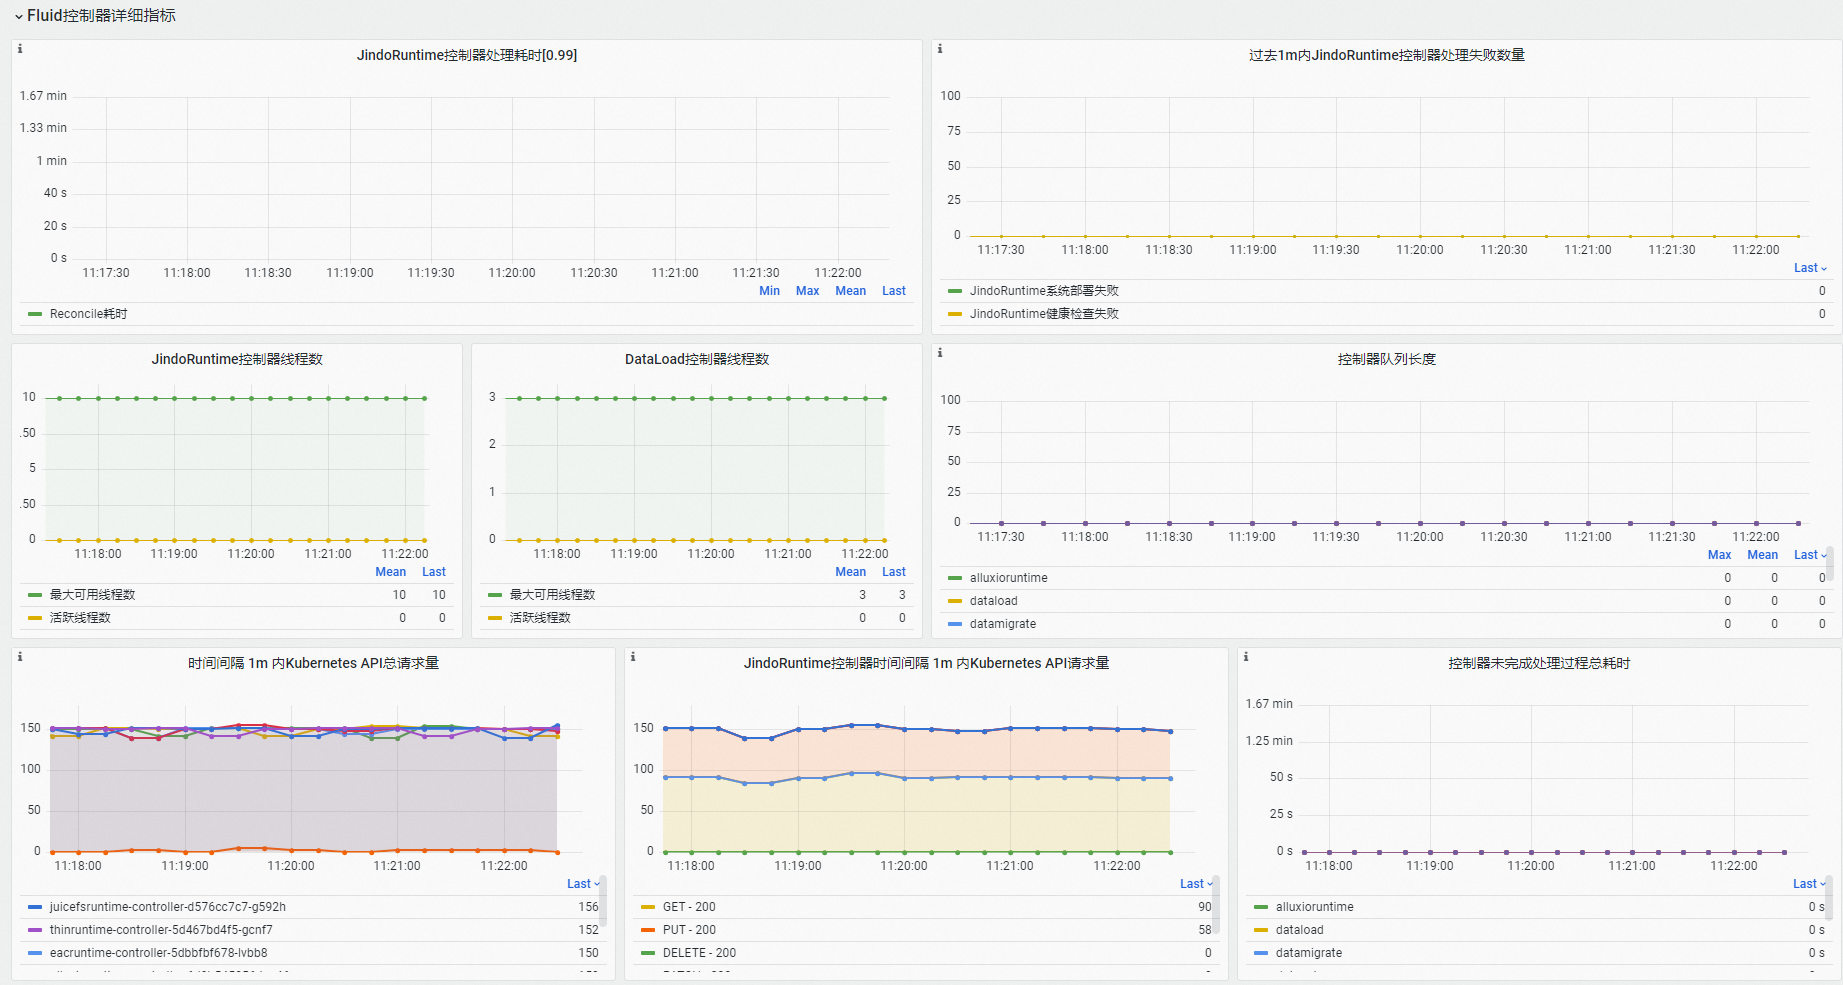
在Fluid控制器詳細指標地區,可查看Fluid控制器組件閑忙程度、處理失敗情況、Kubernetes API請求等資訊。
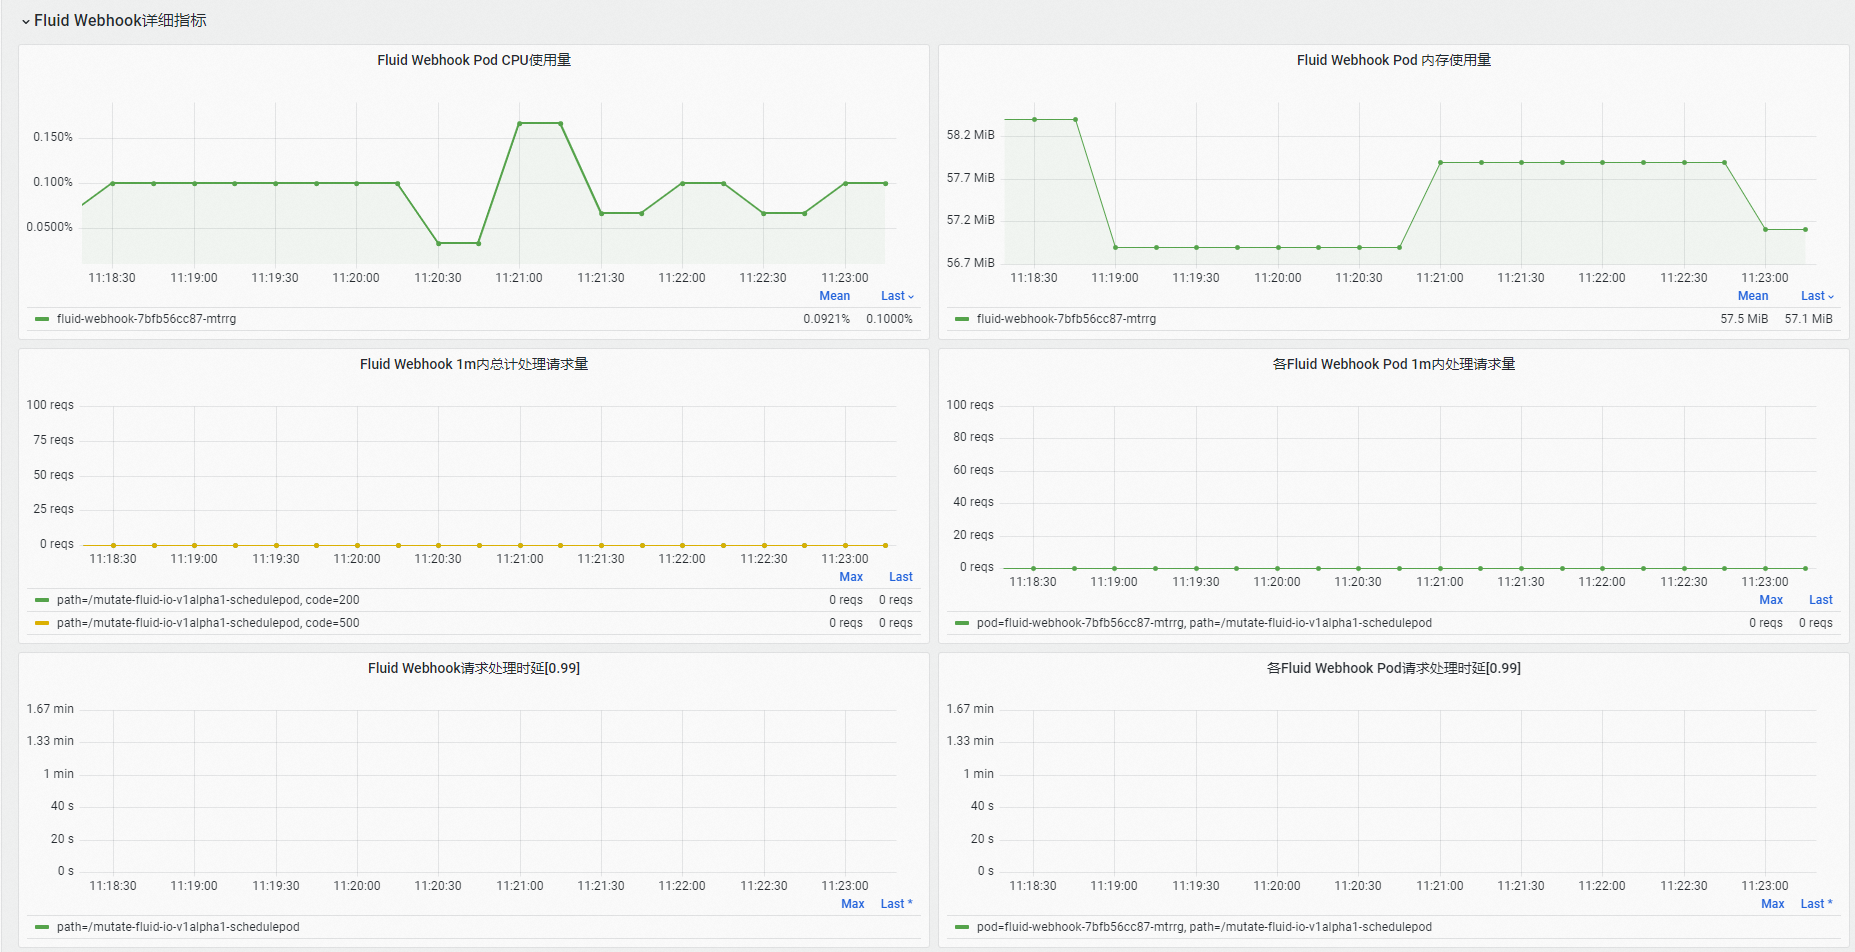
在Fluid Webhook詳細指標地區,可查看Fluid Webhook組件資源使用、請求處理數量以及請求處理時延等資訊。
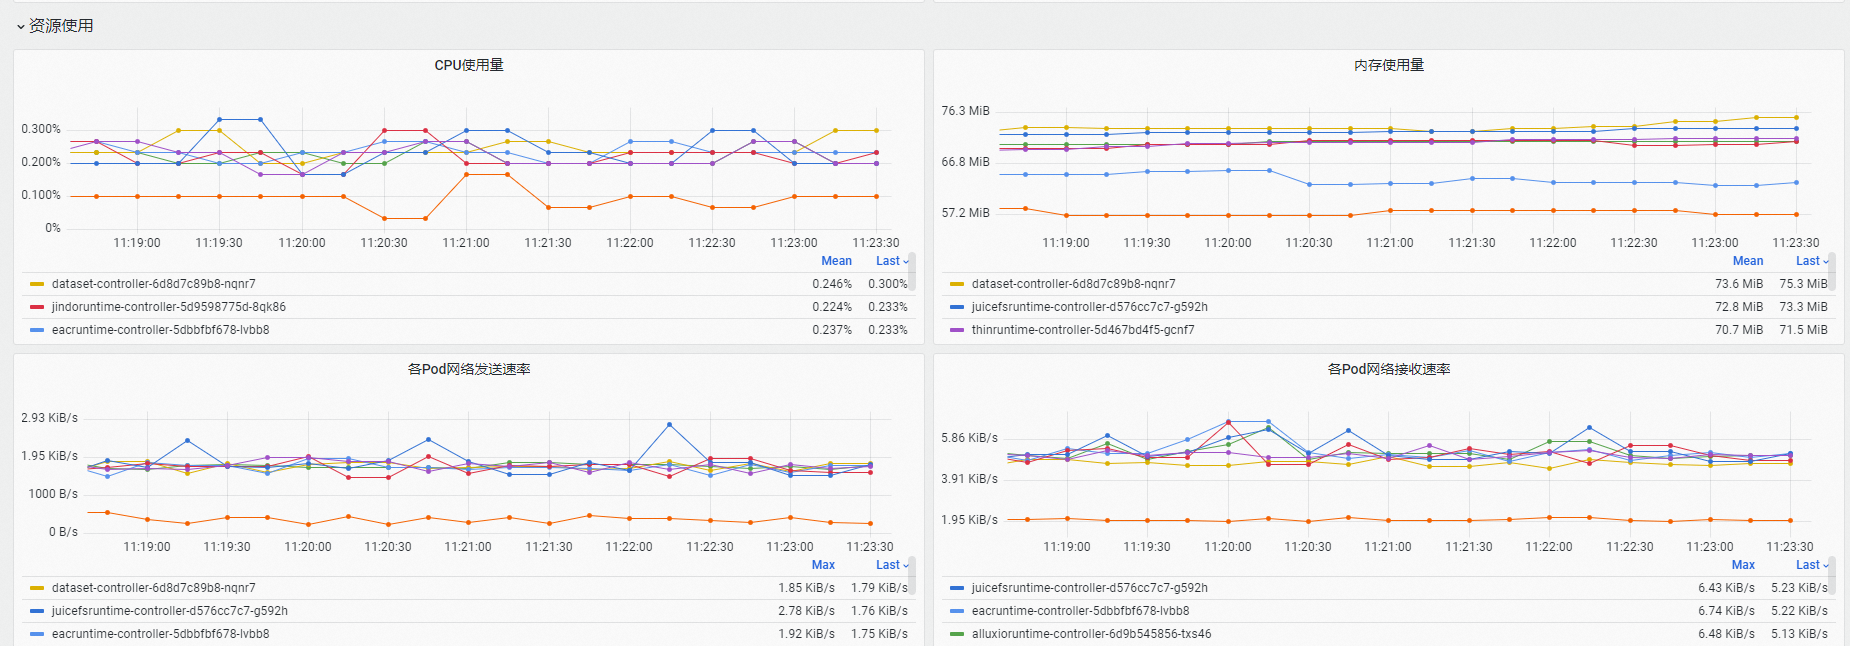
在資源使用地區,可查看Fluid控制面的全部組件的資源使用和網路收發速率等資訊。
在Prometheus監控頁面,選擇,查看Fluid JindoRuntime緩衝系統監控大盤的詳情資料。
在Fluid JindoRuntime緩衝系統監控大盤中,您可以查看有關Fluid JindoRuntime緩衝系統的詳情資料,大盤資料包括Fluid Dataset概覽、緩衝系統監控指標、FUSE用戶端監控指標等。更多詳細資料,請參見Fluid監控大盤參數說明。
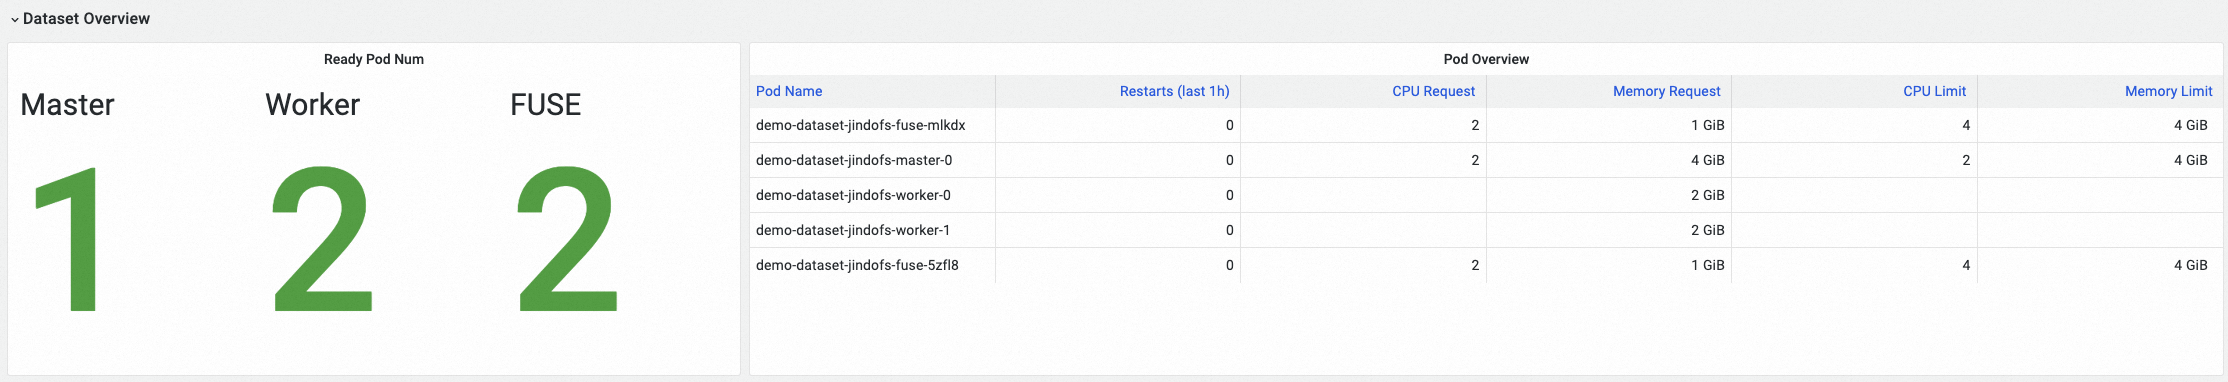
在Dataset Overview(資料集概覽)地區,可查看選中的Fluid資料集的概覽資訊,包括緩衝系統中正常啟動並執行Master組件Pod、Worker組件Pod、FUSE組件Pod的數量,以及各Pod的資源配置情況。
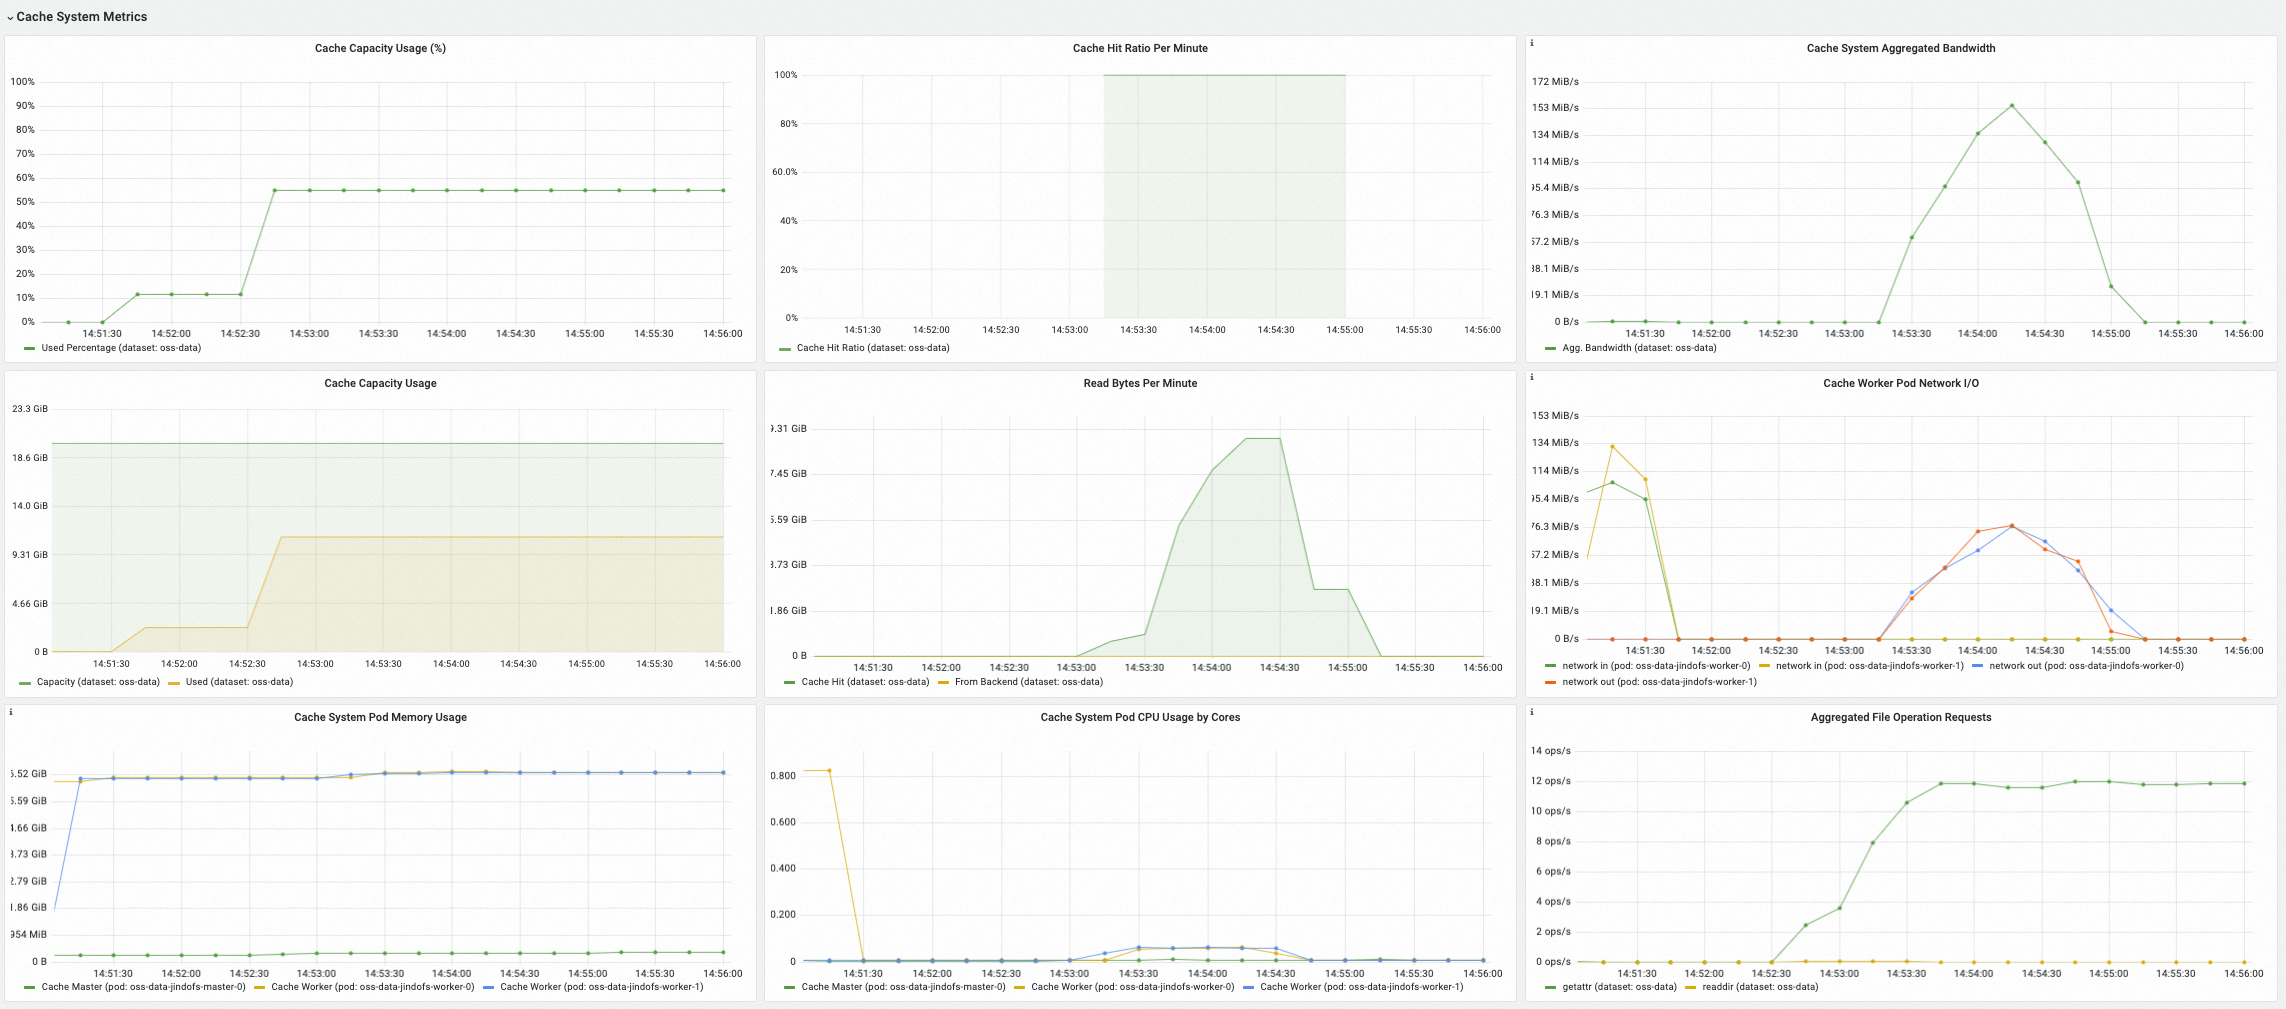
在Cache System Metrics(緩衝系統指標)地區,可查看選中的緩衝系統服務端指標,包括緩衝系統當前已使用的緩衝容量、快取命中率、緩衝系統彙總頻寬以及緩衝系統處理檔案元資訊操作的QPS等。
在FUSE Metrics (via CSI)(FUSE Pod用戶端指標)地區,可查看通過Fluid CSI外掛程式和FUSE Pod方式掛載的FUSE檔案系統的用戶端指標,包括各FUSE Pod的網路I/O情況、中繼資料操作延時和QPS、讀寫資料操作延時和QPS等。

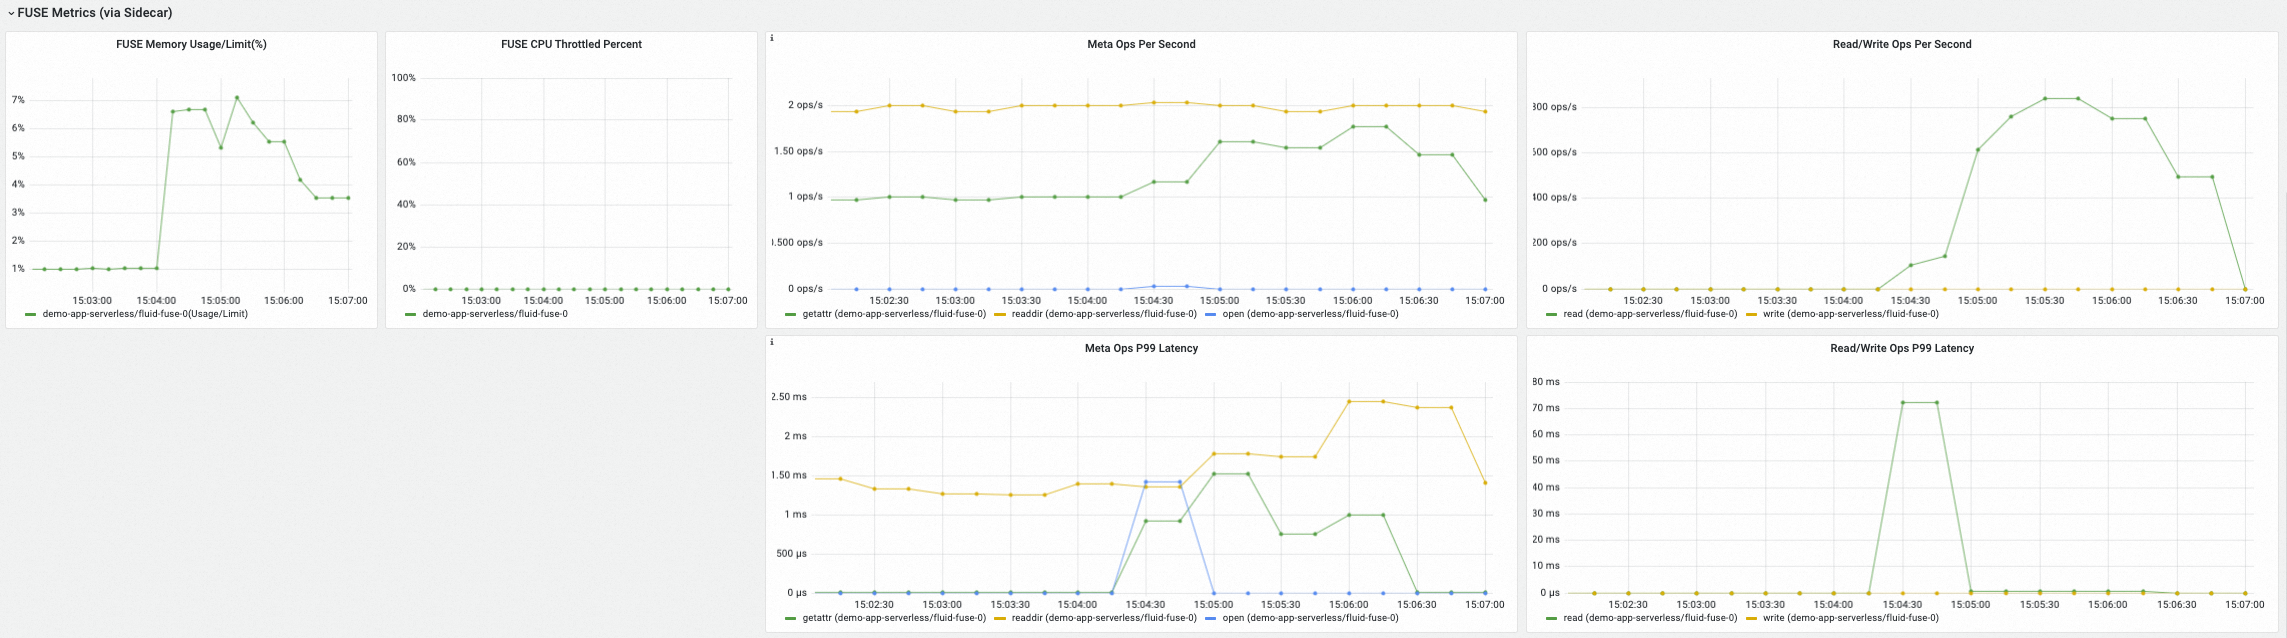
在FUSE Metrics (via Sidecar)(FUSE Sidecar容器用戶端指標)地區,可查看通過Fluid FUSE Sidecar方式掛載的FUSE檔案系統的用戶端指標,包括中繼資料操作延時和QPS、讀寫資料操作延時和QPS等。
從ARMS控制台查看Fluid大盤資料
登入ARMS控制台。
左側導覽列單擊接入管理,在組件類型地區選取項目Fluid,並單擊右側的大盤頁簽,然後單擊頁面底部的Fluid Control Plane,您可以查看Fluid控制面監控大盤的詳情資料。
在Fluid大盤中,您可以查看有關Fluid控制面組件的詳情資料,Prometheus監控提供的Fluid大盤資料包括Fluid組件運行狀態、Fluid控制器處理耗時、Fluid Webhook處理請求量QPS、請求處理時延,以及各組件資源使用量等等。更多詳細資料,請參見Fluid監控大盤參數說明。
在組件運行狀態地區,可查看Fluid控制面組件的就緒Pod數量,歷史重啟次數和歷史重啟時刻等資訊。
在Fluid控制器詳細指標地區,可查看Fluid控制器組件閑忙程度、處理失敗情況、Kubernetes API請求等資訊。
在Fluid Webhook詳細指標地區,可查看Fluid Webhook組件資源使用、請求處理數量以及請求處理時延等資訊。
在資源使用地區,可查看Fluid控制面的全部組件的資源使用和網路收發速率等資訊。
左側導覽列單擊接入管理,在組件類型地區選取項目Fluid,並單擊右側的大盤頁簽,然後單擊頁面底部的Fluid JindoRuntime Dashboard,您可以查看Fluid JindoRuntime緩衝系統監控大盤的詳情資料。
在Dataset Overview(資料集概覽)地區,可查看選中的Fluid資料集的概覽資訊,包括緩衝系統中正常啟動並執行Master組件Pod、Worker組件Pod、FUSE組件Pod的數量,以及各Pod的資源配置情況。
在Cache System Metrics(緩衝系統指標)地區,可查看選中的緩衝系統服務端指標,包括緩衝系統當前已使用的緩衝容量、快取命中率、緩衝系統彙總頻寬以及緩衝系統處理檔案元資訊操作的QPS等。
在FUSE Metrics (via CSI)(FUSE Pod用戶端指標)地區,可查看通過Fluid CSI外掛程式和FUSE Pod方式掛載的FUSE檔案系統的用戶端指標,包括各FUSE Pod的網路I/O情況、中繼資料操作延時和QPS、讀寫資料操作延時和QPS等。
在FUSE Metrics (via Sidecar)(FUSE Sidecar容器用戶端指標)地區,可查看通過Fluid FUSE Sidecar方式掛載的FUSE檔案系統的用戶端指標,包括中繼資料操作延時和QPS、讀寫資料操作延時和QPS等。
監控指標說明
Fluid控制面各組件使用的指標清單如下。
指標 | 類型 | 說明 |
dataset_ufs_total_size | Gauge | 當前叢集記憶體活的Dataset資來源物件掛載的資料集大小。 |
dataset_ufs_file_num | Gauge | 當前叢集記憶體活的Dataset資來源物件掛載的資料集檔案數量。 |
runtime_setup_error_total | Counter | 控制器Reconcile過程中啟動Runtime操作失敗數量。 |
runtime_sync_healthcheck_error_total | Counter | 控制器Reconcile過程中Runtime健全狀態檢查操作失敗數量。 |
controller_runtime_reconcile_time_seconds_bucket | Histogram | 控制器Reconcile流程耗時。 |
controller_runtime_reconcile_errors_total | Counter | 控制器Reconcile失敗數量。 |
controller_runtime_reconcile_total | Counter | 控制器已完成的Reconcile過程總數。 |
controller_runtime_max_concurrent_reconciles | Gauge | 控制器的最大可用Reconcile協程數量。 |
controller_runtime_active_workers | Gauge | 控制器當前處於活躍狀態的Reconcile協程數量。 |
workqueue_adds_total | Counter | 控制器Workqueue處理的Adds事件的數量。 |
workqueue_depth | Gauge | 控制器Workqueue當前隊列深度。 |
workqueue_queue_duration_seconds_bucket | Histogram | 待處理對象在控制器Workqueue中等待時間長度。 |
workqueue_work_duration_seconds_bucket | Histogram | 控制器歷史已完成的處理過程的時間長度分布。 |
workqueue_unfinished_work_seconds | Gauge | 控制器Workqueue中當前正在被處理,但還未處理完成的任務的總時間長度。 |
workqueue_longest_running_processor_seconds | Gauge | 控制器歷史處理過程最大時間長度。 |
rest_client_requests_total | Counter | 從狀態值(Status Code)、方法(Method)和主機(Host)維度分析的到的HTTP請求數。 |
rest_client_request_duration_seconds_bucket | Histogram | 從方法(Verb)和URL維度分析得到的HTTP請求時延。 |
controller_runtime_webhook_requests_in_flight | Gauge | Webhook當前正在處理的請求數量。 |
controller_runtime_webhook_requests_total | Counter | Webhook處理請求數量。 |
controller_runtime_webhook_latency_seconds_bucket | Histogram | Webhook處理請求時延。 |
process_cpu_seconds_total | Counter | CPU使用時間長度。 |
process_resident_memory_bytes | Gauge | 記憶體使用量量。 |
Fluid JindoRuntime緩衝監控大盤中JindoCache緩衝系統服務端暴露的指標清單如下。
指標清單 | 類型 | 解釋 |
jindocache_server_total_stsnodes_num | Gauge | 當前分布式緩衝存活的Worker組件副本數量。 |
jindocache_server_total_disk_cap | Gauge | 分布式緩衝系統中以磁碟介質(包含tmpfs等記憶體盤)的緩衝容量上限。 |
jindocache_server_total_used_disk_cap | Gauge | 分布式緩衝系統中已使用的磁碟介質(包含tmpfs等記憶體盤)緩衝空間。 |
jindocache_server_total_mem_cap | Gauge | 分布式緩衝系統中以進程記憶體為介質的緩衝容量上限。 |
jindocache_server_total_used_mem_cap | Gauge | 分布式緩衝系統中已使用的以進程記憶體為介質的緩衝空間。 |
jindocache_server_total_used_rocksdb_cap | Gauge | 分布式緩衝系統中已使用的RocksDB。 |
jindocache_server_backend_read_bytes_total | Gauge | 總計回源底層儲存讀取資料量大小,單位Byte。 回源底層儲存讀取指待讀資料不在JindoCache分布式緩衝中,需要回源底層儲存系統進行讀取的情況。 |
jindocache_server_backend_read_time_total | Gauge | 回源底層儲存讀取資料總耗時,單位微秒。 |
jindocache_server_backend_readop_num_total | Gauge | 總計回源底層儲存讀取資料次數,對應 JindoCache緩衝中 Block 個數。 |
jindocache_server_backend_read_bytes_time_total_window | Gauge | 一分鐘內回源底層儲存讀取資料耗時,單位微秒。 |
jindocache_server_backend_read_bytes_total_window | Gauge | 一分鐘內回源底層儲存讀取總資料量大小,單位Byte。 |
jindocache_server_remote_read_bytes_total | Gauge | 總計同叢集內遠端快取命中讀取資料量大小,單位Byte。 遠端快取命中指待讀資料在JindoCache分布式緩衝中,但是快取資料與應用不在相同節點的情況。 |
jindocache_server_remote_read_time_total | Gauge | 總計同叢集內遠端快取命中讀取資料總耗時,單位微秒。 |
jindocache_server_remote_readop_num_total | Gauge | 總計同叢集內遠端快取命中讀取次數。 |
jindocache_server_remote_read_bytes_time_total_window | Gauge | 一分鐘內遠端快取命中讀取總資料耗時,單位微秒。 |
jindocache_server_remote_read_bytes_total_window | Gauge | 一分鐘內遠端快取命中讀取總資料量大小,單位Byte。 |
jindocache_server_local_read_bytes_total | Gauge | 總計同叢集內本機快取命中讀取資料量大小,單位Byte。 本機快取命中指待讀資料在JindoCache分布式緩衝中,並且快取資料與應用在相同節點的讀取情況。 |
jindocache_server_local_read_time_total | Gauge | 總計同叢集內本機快取命中讀取資料總耗時,單位微秒。 |
jindocache_server_local_readop_num_total | Gauge | 總計同叢集內本機快取命中讀取次數。 |
jindocache_server_local_read_bytes_time_total_window | Gauge | 一分鐘內本機快取命中讀取總資料耗時,單位微秒。 |
jindocache_server_local_read_bytes_total_window | Gauge | 一分鐘內本機快取命中讀取總資料量大小,單位Byte。 |
jindocache_server_ns_filelet_op_count_total | Gauge | JindoCache Master組件側統計的檔案元資訊操作(包括getAttr操作和listStatus操作)總數。 |
jindocache_server_ns_filelet_op_time_total | Gauge | JindoCache Master組件側統計的處理檔案元資訊操作(包括getAttr操作和listStatus操作)的總耗時。 |
jindocache_server_ns_get_attr_op_total | Gauge | JindoCache Master組件側統計的getAttr操作總數。 |
jindocache_server_ns_get_attr_time_total | Gauge | JindoCache Master組件側統計的處理getAttr操作的總耗時。 |
jindocache_server_ns_get_attr_fallback_op_total | Gauge | JindoCache Master組件回源底層儲存系統擷取檔案元資訊的總次數。 |
jindocache_server_ns_list_status_op_total | Gauge | JindoCache Master組件側統計的listStatus操作總數。 |
jindocache_server_ns_list_status_time_total | Gauge | JindoCache Master組件側統計的處理listStatus操作的總耗時。 |
jindocache_server_ns_list_status_fallback_op_total | Gauge | JindoCache Master組件回源底層儲存系統擷取檔案清單的總次數。 |
jindocache_server_dist_get_attr_op_num_total | Gauge | JindoCache用戶端側統計的getAttr操作總數。 |
jindocache_server_dist_get_attr_time_total | Gauge | JindoCache用戶端側統計的處理getAttr操作的總耗時。 |
jindocache_server_dist_list_dir_op_num_total | Gauge | JindoCache用戶端側統計的listStatus操作總數。 |
jindocache_server_dist_list_dir_time_total | Gauge | JindoCache用戶端側統計的處理listStatus操作的總耗時。 |
Fluid JindoRuntime緩衝監控大盤中JindoCache緩衝系統FUSE用戶端暴露的指標清單如下。
指標清單 | 類型 | 解釋 |
jindo_fuse_open_count | Gauge | Jindo FUSE用戶端open操作次數。 |
jindo_fuse_open_latency | Gauge | Jindo FUSE用戶端open操作P50分位延遲。 |
jindo_fuse_open_latency_80 | Gauge | Jindo FUSE用戶端open操作P80分位延遲。 |
jindo_fuse_open_latency_90 | Gauge | Jindo FUSE用戶端open操作P90分位延遲。 |
jindo_fuse_open_latency_99 | Gauge | Jindo FUSE用戶端open操作P99分位延遲。 |
jindo_fuse_open_latency_999 | Gauge | Jindo FUSE用戶端open操作千分之999分位延遲。 |
jindo_fuse_open_latency_9999 | Gauge | Jindo FUSE用戶端open操作萬分之9999分位延遲。 |
jindo_fuse_getattr_count | Gauge | Jindo FUSE用戶端getAttr操作次數。 |
jindo_fuse_getattr_latency | Gauge | Jindo FUSE用戶端getAttr操作P50分位延遲。 |
jindo_fuse_getattr_latency_80 | Gauge | Jindo FUSE用戶端getAttr操作P80分位延遲。 |
jindo_fuse_getattr_latency_90 | Gauge | Jindo FUSE用戶端getAttr操作P90分位延遲。 |
jindo_fuse_getattr_latency_99 | Gauge | Jindo FUSE用戶端getAttr操作P99分位延遲。 |
jindo_fuse_getattr_latency_999 | Gauge | Jindo FUSE用戶端getAttr操作千分之999分位延遲。 |
jindo_fuse_getattr_latency_9999 | Gauge | Jindo FUSE用戶端getAttr操作萬分之9999分位延遲。 |
jindo_fuse_readdir_count | Gauge | Jindo FUSE用戶端readDir操作次數。 |
jindo_fuse_readdir_latency | Gauge | Jindo FUSE用戶端readDir操作P50分位延遲。 |
jindo_fuse_readdir_latency_80 | Gauge | Jindo FUSE用戶端readDir操作P80分位延遲。 |
jindo_fuse_readdir_latency_90 | Gauge | Jindo FUSE用戶端readDir操作P90分位延遲。 |
jindo_fuse_readdir_latency_99 | Gauge | Jindo FUSE用戶端readDir操作P99分位延遲。 |
jindo_fuse_readdir_latency_999 | Gauge | Jindo FUSE用戶端readDir操作千分之999分位延遲。 |
jindo_fuse_readdir_latency_9999 | Gauge | Jindo FUSE用戶端readDir操作萬分之9999分位延遲。 |
jindo_fuse_read_count | Gauge | Jindo FUSE用戶端read操作次數。 |
jindo_fuse_read_latency | Gauge | Jindo FUSE用戶端read操作P50分位延遲。 |
jindo_fuse_read_latency_80 | Gauge | Jindo FUSE用戶端read操作P80分位延遲。 |
jindo_fuse_read_latency_90 | Gauge | Jindo FUSE用戶端read操作P90分位延遲。 |
jindo_fuse_read_latency_99 | Gauge | Jindo FUSE用戶端read操作P99分位延遲。 |
jindo_fuse_read_latency_999 | Gauge | Jindo FUSE用戶端read操作千分之999分位延遲。 |
jindo_fuse_read_latency_9999 | Gauge | Jindo FUSE用戶端read操作萬分之9999分位延遲。 |
jindo_fuse_write_count | Gauge | Jindo FUSE用戶端write操作次數。 |
jindo_fuse_write_latency | Gauge | Jindo FUSE用戶端write操作P50分位延遲。 |
jindo_fuse_write_latency_80 | Gauge | Jindo FUSE用戶端write操作P80分位延遲。 |
jindo_fuse_write_latency_90 | Gauge | Jindo FUSE用戶端write操作P90分位延遲。 |
jindo_fuse_write_latency_99 | Gauge | Jindo FUSE用戶端write操作P99分位延遲。 |
jindo_fuse_write_latency_999 | Gauge | Jindo FUSE用戶端write操作千分之999分位延遲。 |
jindo_fuse_write_latency_9999 | Gauge | Jindo FUSE用戶端write操作萬分之9999分位延遲。 |
相關文檔
關於Fluid更多資訊,請參見資料加速Fluid概述。
關於Fluid監控面板參數說明,請參見Fluid監控大盤參數說明。