Tablestore コンソールを使用して、インスタンス、データテーブル、セカンダリインデックス、または多次元インデックスのモニタリングデータを表示できます。たとえば、インスタンスのクエリ/秒 (QPS)、行数、トラフィック統計、および容量単位 (CU) を表示できます。また、データテーブル、セカンダリインデックス、または多次元インデックスの平均アクセスレイテンシと QPS を表示することもできます。さらに、ストレージボリューム、予約済み読み取り CU 数、行数など、多次元インデックスのメータリングデータを表示することもできます。
前提条件
RAM ユーザーとして Tablestore のモニタリングデータを表示する場合は、以下の前提条件が満たされていることを確認してください。
AliyunOTSFullAccessポリシーまたはAliyunOTSReadOnlyAccessポリシーが RAM ユーザーにアタッチされています。[aliyunotsfullaccess] ポリシーは、RAM ユーザーに Tablestore へのフルアクセスを許可します。[aliyunotsreadonlyaccess] ポリシーは、RAM ユーザーに Tablestore への読み取り専用アクセスを許可します。詳細については、「RAM ユーザーに権限を付与する」をご参照ください。AliyunCloudMonitorFullAccessポリシーまたはAliyunCloudMonitorReadOnlyAccessポリシーが RAM ユーザーにアタッチされています。[aliyuncloudmonitorfullaccess] ポリシーは、CloudMonitor へのフルアクセスを RAM ユーザーに許可します。[aliyuncloudmonitorreadonlyaccess] ポリシーは、CloudMonitor への読み取り専用アクセスを RAM ユーザーに許可します。詳細については、「RAM ユーザーに権限を付与する」をご参照ください。
きめ細かい方法で権限を管理するために、カスタムポリシーを作成することもできます。詳細については、「カスタムポリシーを作成する」をご参照ください。
使用上の注意
使用可能な Tablestore メトリックは、リソースタイプによって異なります。詳細については、「メトリック」をご参照ください。
モニタリングデータ統計の収集が遅れる場合があります。
インスタンスのモニタリングデータを表示する
サービスモニタリングデータを表示する
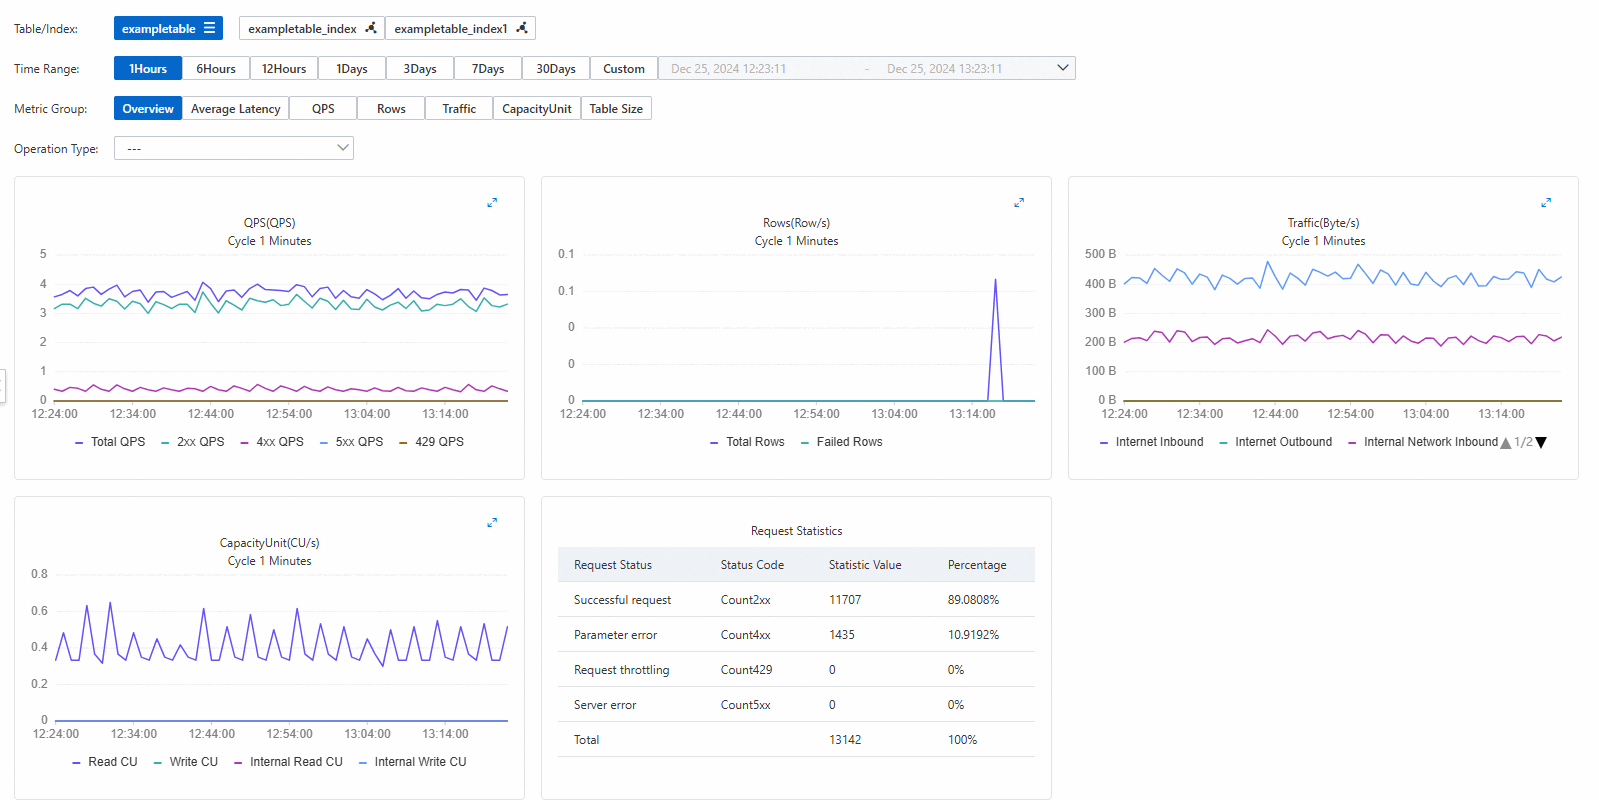
Tablestore コンソールで、QPS、行数、トラフィック統計、CU などのインスタンスのモニタリングデータを表示できます。
[インスタンス管理] ページに移動します。
Tablestore コンソール にログインします。
上部のナビゲーションバーで、リージョンとリソースグループを選択します。
[概要] ページで、管理するインスタンスの名前をクリックするか、インスタンスの [アクション] 列の [インスタンスの管理] をクリックします。
[インスタンス管理] ページで、[インスタンスモニタリング] タブをクリックし、時間範囲を指定します。
プリセットの時間範囲を選択するか、カスタムの時間範囲を指定できます。 時間範囲は 30 日を超えることはできません。
表示するモニタリングデータを指定します。
デフォルトでは、メトリックグループには [概要] が選択されています。 [操作タイプ] に値を指定して、指定した操作タイプに関するすべてのメトリックグループのモニタリングデータを表示できます。
チャートの右上隅にある
 アイコンをクリックすると、拡大表示されたチャートでモニタリングデータを表示できます。
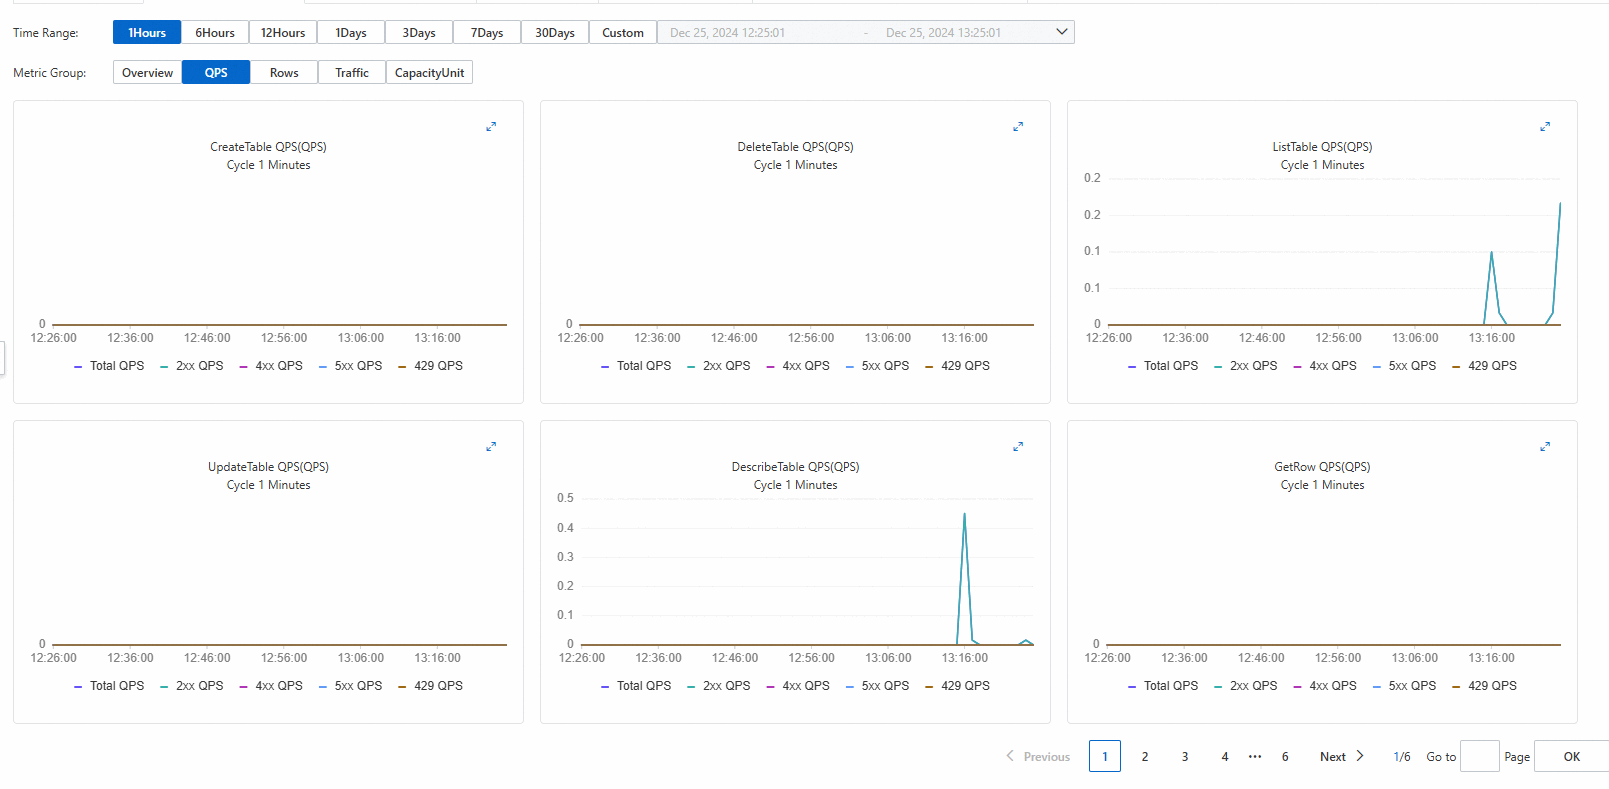
特定のメトリックグループに基づいてすべての操作タイプのモニタリングデータを表示する場合は、[メトリックグループ] を必要なメトリックグループに設定します。 たとえば、メトリックグループを QPS に設定できます。 次の図は、QPS に基づくすべての操作タイプのモニタリングデータを示しています。

リソースのモニタリングデータの表示(Wide Column モデルを使用する場合)
データテーブルまたはインデックスのモニタリングデータの表示
Tablestore コンソールで、データテーブル、セカンダリインデックス、または 多次元インデックス の平均アクセス待機時間、QPS、行数、トラフィック統計などのモニタリングデータを表示できます。
操作タイプは、モニタリングデータを表示するリソースのタイプによって異なります。
[インスタンス管理] ページに移動します。
Tablestore コンソール にログインします。
上部のナビゲーションバーで、リージョンとリソースグループを選択します。
[概要] ページで、管理するインスタンスの名前をクリックするか、インスタンスの [アクション] 列の [インスタンスの管理] をクリックします。
テーブル[インスタンスの詳細] タブの
 監視 セクションで、管理するデータテーブルの 列の アイコンをクリックします。
[モニタリング指標] タブで、データテーブル、セカンダリインデックス、または 多次元インデックス を選択します。
時間範囲を指定します。
プリセットの時間範囲を選択するか、カスタムの時間範囲を指定できます。 時間範囲は 30 日を超えることはできません。
表示するモニタリングデータを指定します。
デフォルトでは、メトリックグループとして [概要] が選択されています。 [操作タイプ] に値を指定して、指定した操作タイプに関するすべてのメトリックグループのモニタリングデータを表示できます。
グラフの右上隅にある
 アイコンをクリックすると、拡大表示されたグラフでモニタリングデータを表示できます。説明
多次元インデックス は、テーブルサイズ メトリックグループをサポートしていません。

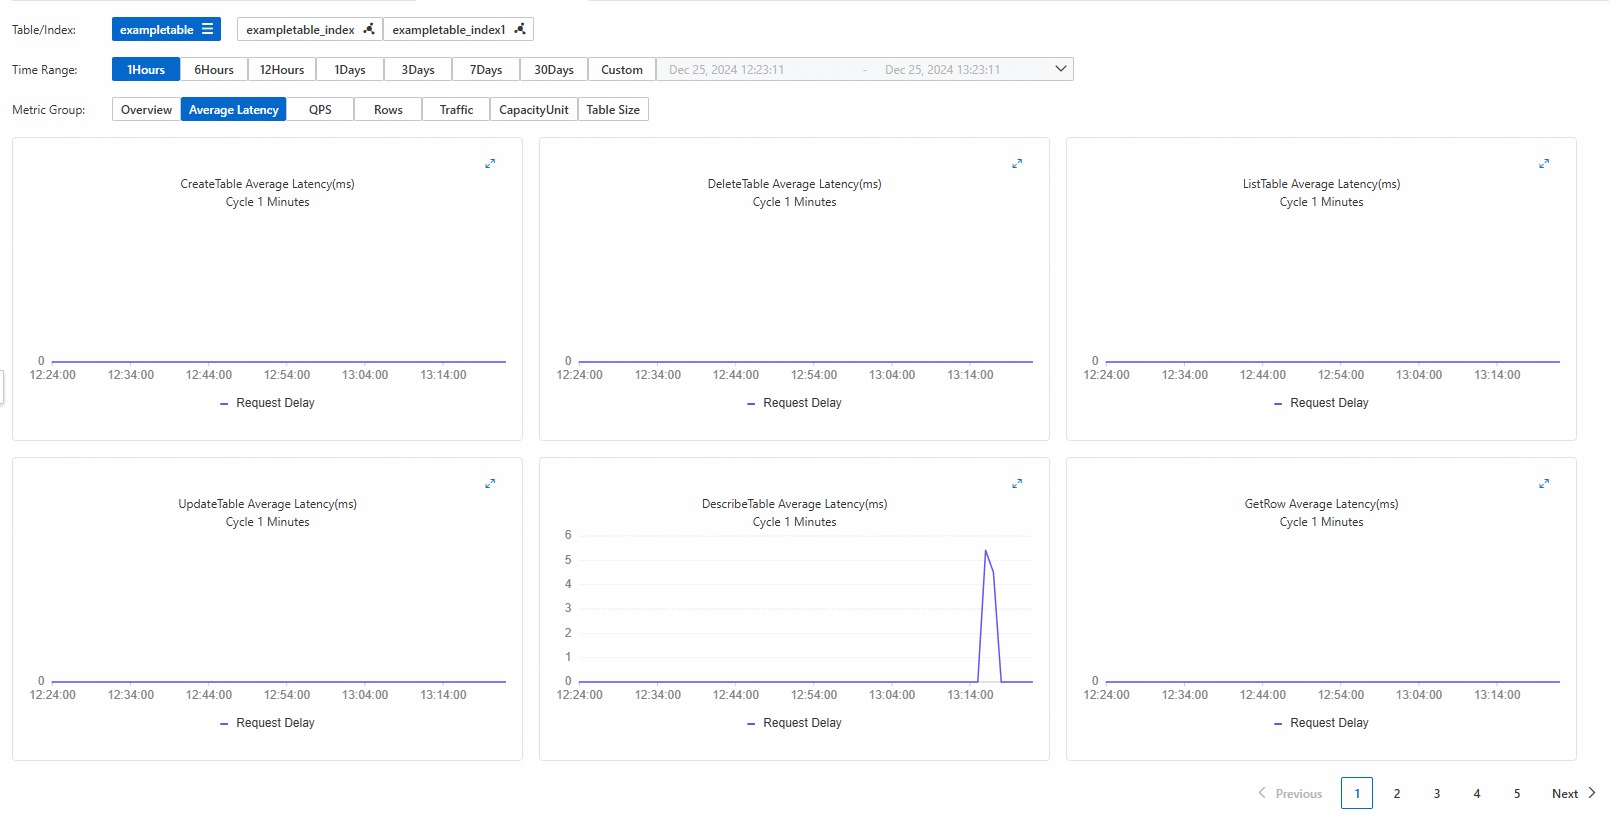
特定のメトリックグループに基づいてすべての操作タイプのモニタリングデータを表示する場合は、メトリックグループ を必要なメトリックグループに設定します。 たとえば、メトリックグループを平均待機時間に設定できます。 次の図は、平均アクセス待機時間に基づくすべての操作タイプのモニタリングデータを示しています。

多次元インデックス の計測データの表示
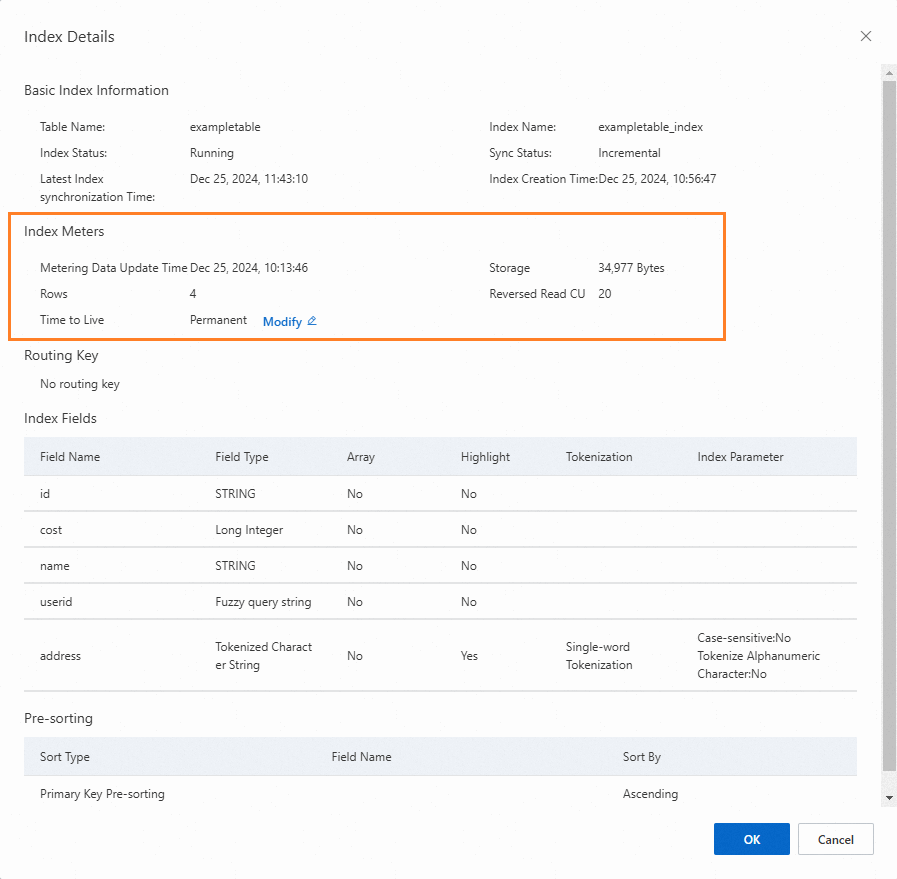
Tablestore コンソールで、多次元インデックス のストレージボリューム、予約済み読み取り CU、行数などの計測データを表示できます。
[インスタンス管理] ページに移動します。
Tablestore コンソール にログインします。
上部のナビゲーションバーで、リージョンとリソースグループを選択します。
[概要] ページで、管理するインスタンスの名前をクリックするか、インスタンスの [アクション] 列の [インスタンスの管理] をクリックします。
[インスタンスの詳細] タブの [テーブル] セクションで、管理するデータテーブルの [アクション] 列の [インデックス] をクリックします。
[インデックス] タブで、管理する 多次元インデックス の [アクション] 列の [インデックスの詳細] をクリックします。
[インデックスの詳細] ダイアログボックスの [インデックスメーター] セクションで、多次元インデックス のストレージボリューム、行数、および予約済み読み取り CU を表示します。

リソースのモニタリングデータの表示 (TimeSeries モデルを使用する場合)
TimeSeries モデルを使用する場合、時系列テーブルのモニタリングデータのみを表示できます。
Tablestore コンソールで時系列テーブルのサイズを表示できます。
[インスタンス管理] ページに移動します。
Tablestore コンソール にログインします。
上部のナビゲーションバーで、リージョンとリソースグループを選択します。
[概要] ページで、管理するインスタンスの名前をクリックするか、インスタンスの [アクション] 列の [インスタンスの管理] をクリックします。
[時系列テーブル][インスタンスの詳細] タブの
 監視 セクションで、管理する時系列テーブルの 列の アイコンをクリックします。
[モニタリング指標] タブで、時間範囲を指定します。
定義済みの時間範囲を選択するか、カスタムの時間範囲を指定できます。 時間範囲は 30 日を超えることはできません。
モニタリングデータを表示します。
メトリックグループは [テーブルサイズ] のみに設定できます。 チャートの右上隅にある
 アイコンをクリックすると、拡大表示されたチャートでモニタリングデータを表示できます。
FAQ
コンソールでモニタリングデータを表示するときに NoPermission エラーメッセージが表示された場合はどうすればよいですか。