Cilium Tetragon is an open source network monitoring and security tool that provides capabilities such as network traffic monitoring and real-time log analysis. After you use Tetragon to collect runtime logs from a container to the required directory of the container, you can use Logtail to deliver the logs to a Logstore for query and analysis.
Limits
You can use Logtail to deliver logs collected by Tetragon only in Kubernetes and Docker environments.
The kernel version of the Linux operating system in which Tetragon runs must be 4.19 or later.
1. Configure Tetragon
After you configure Tetragon, logs that are collected by Tetragon are stored in the /var/run/cilium/tetragon/tetragon.log directory of your container.
1.1 Install Tetragon
For more information about how to install Tetragon in Kubernetes environments, see Quick Kubernetes Install.
For more information about how to install Tetragon in Docker environments, see Quick Local Docker Install.
1.2 Configure security policies for Tetragon
For more information, see Security Sensitive Events.
2. Configure Logtail components
Logtail components deliver the collected logs that are stored in the /var/run/cilium/tetragon/tetragon.log directory to a Simple Log Service Logstore.
2.1 Install Logtail components
For more information about how to install Logtail components in Alibaba Cloud Kubernetes clusters and self-managed Kubernetes clusters, see Install Logtail components in an ACK cluster and Install Logtail components in a self-managed Kubernetes cluster.
For more information about how to install Logtail components in Docker environments, see Step 1 in Collect logs from standard Docker containers.
2.2 Create a Logtail configuration
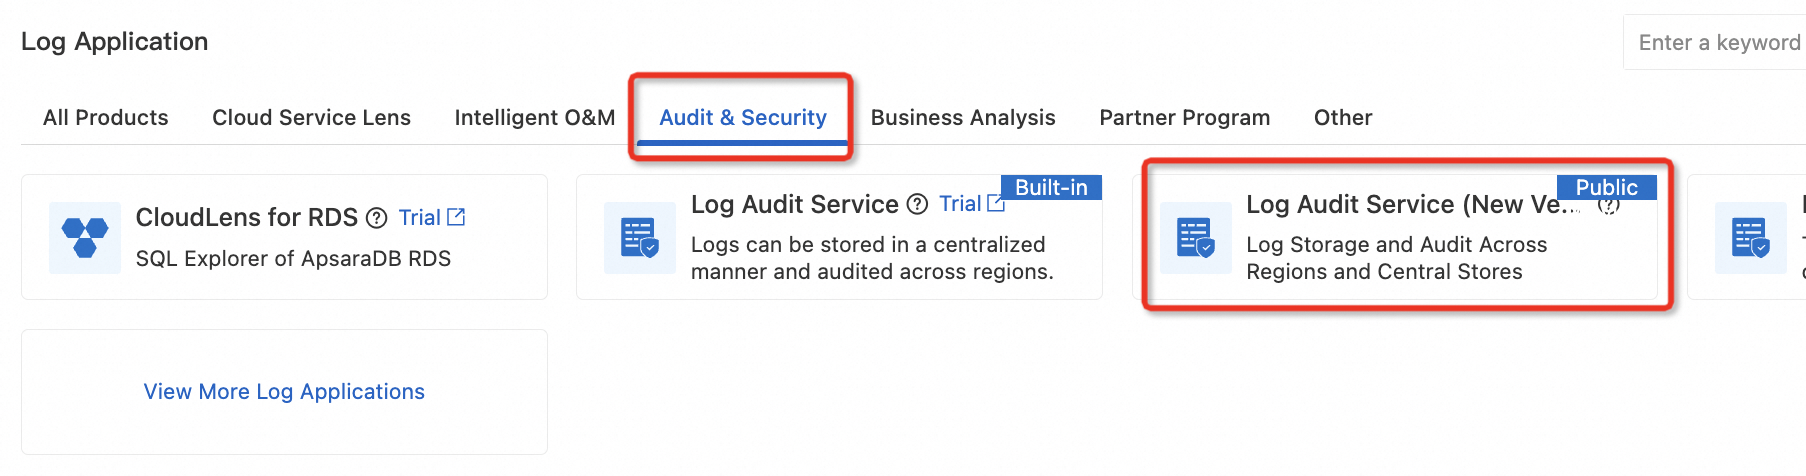
Log on to the Simple Log Service console. In the Log Application section, click the Audit & Security tab. Then, click Log Audit Service (New Version).
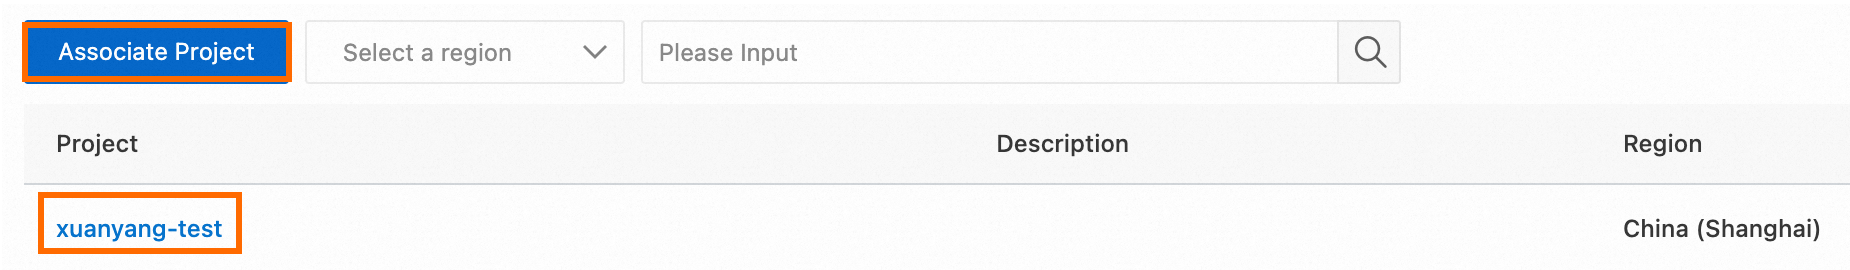
On the Log Audit Service (New Version) page, click an associated project. Alternatively, click Associate Project to associate a project with Log Audit Service.
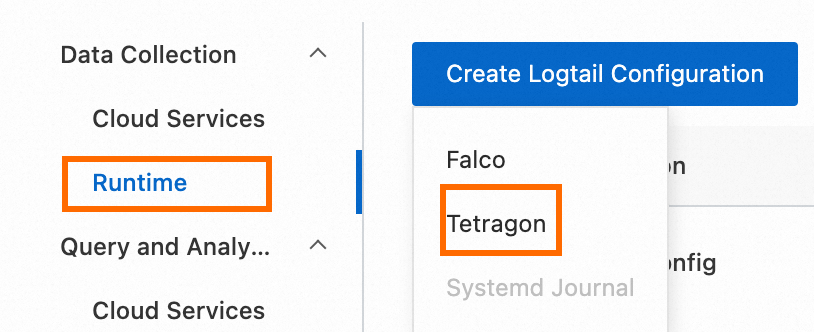
In the left-side navigation pane, choose Data Collection > Runtime. On the page that appears, click Create Logtail Configuration and select Tetragon from the drop-down list.
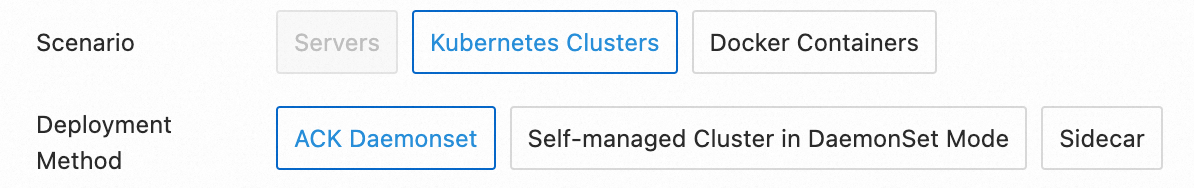
In the Machine Group Configurations step of the Import Data wizard, configure the Scenario and Deployment Method parameters.
In the Logtail Configuration step of the Import Data wizard, use the default parameter settings and click Complete. You can also modify the parameters. For more information, see the Console tab in the Create a Logtail configuration section of the Collect text logs from Kubernetes containers in DaemonSet mode and Collect text logs from Kubernetes containers in Sidecar mode topics.
2.3 Verify configuration results
After you configure the Logtail components, Simple Log Service automatically creates the following resources in the associated project:
A Logtail configuration named
tetragon-pipelineconfig.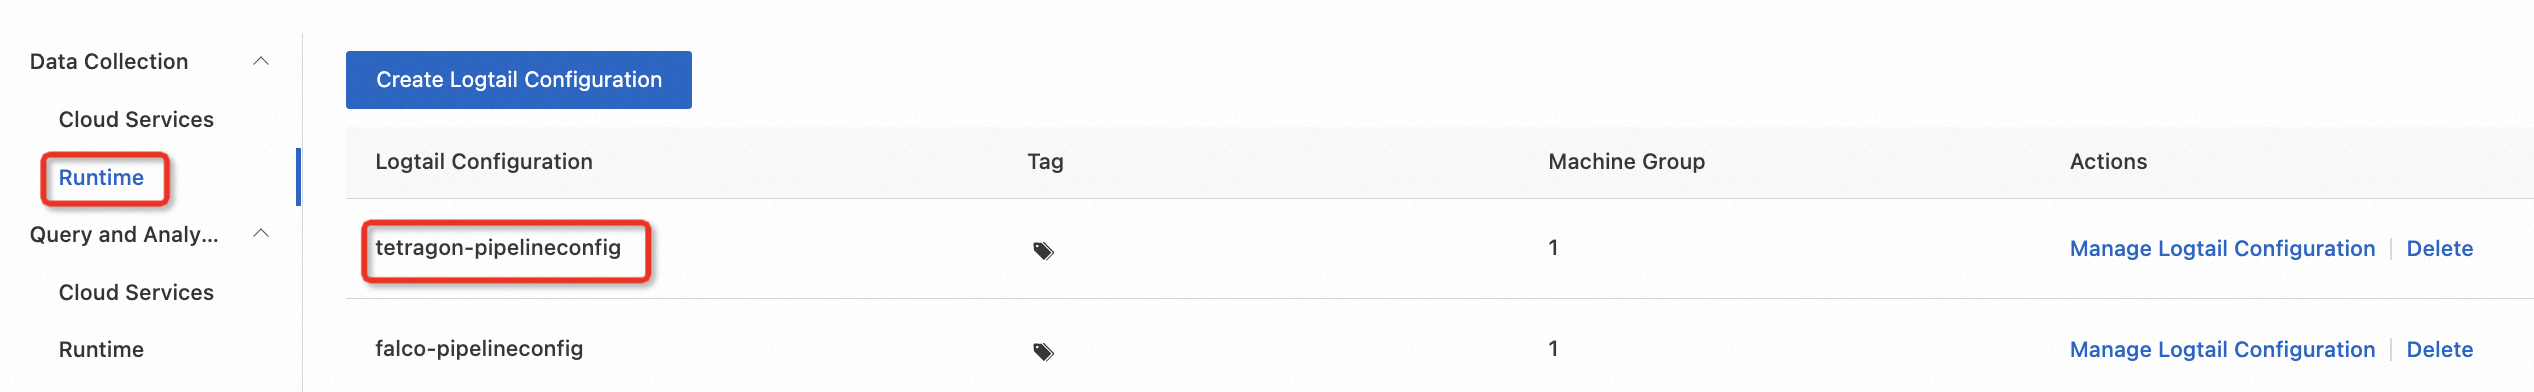
A Logstore named
tetragon-log.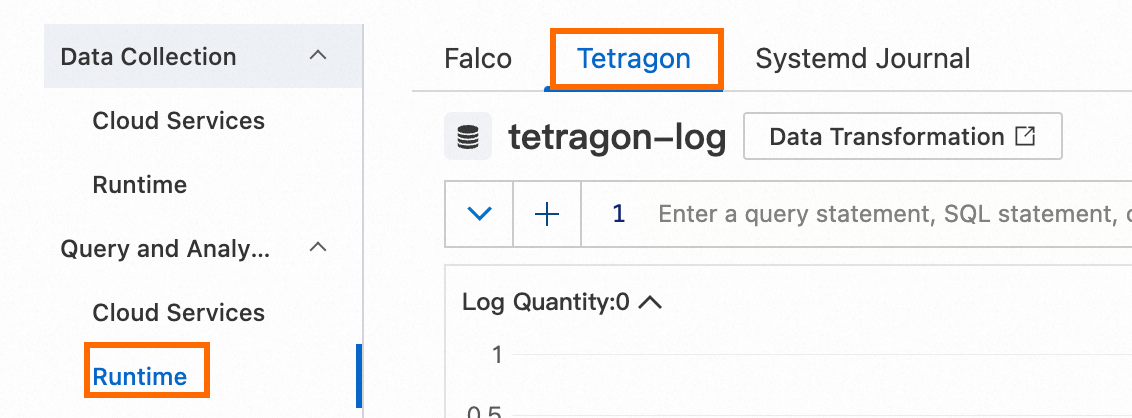
3. Query and analyze logs
In the left-side navigation pane, choose Query and Analysis > Runtime. On the page that appears, click the Tetragon tab. For more information about the fields in the logs collected by Tetragon, see Fields in Tetragon runtime logs. For more information about the search syntax, see Search syntax.
References
For more information about the fields in the logs collected by Tetragon, see Fields in Tetragon runtime logs.
After Tetragon collects logs, you can view the total numbers of runtime events, file events, and network events in the report center. For more information, see Report center.
After Tetragon collects logs, you can create custom alert rules for the collected logs. You can also create alert rules from built-in alert rule templates. For more information, see Alert management.