This topic describes the common syntax of Markdown charts and how to add a Markdown chart to a Simple Log Service dashboard.
Prerequisites
Data is collected to Simple Log Service. For more information, see Data collection overview.
A dashboard is created. For more information, see Create a dashboard.
Overview
Simple Log Service allows you to add Markdown charts to a dashboard. If you want to modify charts, you must use the Markdown syntax. You can insert text, such as background information, chart descriptions, notes, and extension information, into Markdown charts to optimize information presentation. You can insert saved searches or the dashboard links of other projects to navigate to other query pages. You can also insert custom images and videos to supplement your dashboard information.
Configuration effect
Markdown chart type | Sample Markdown chart | References |
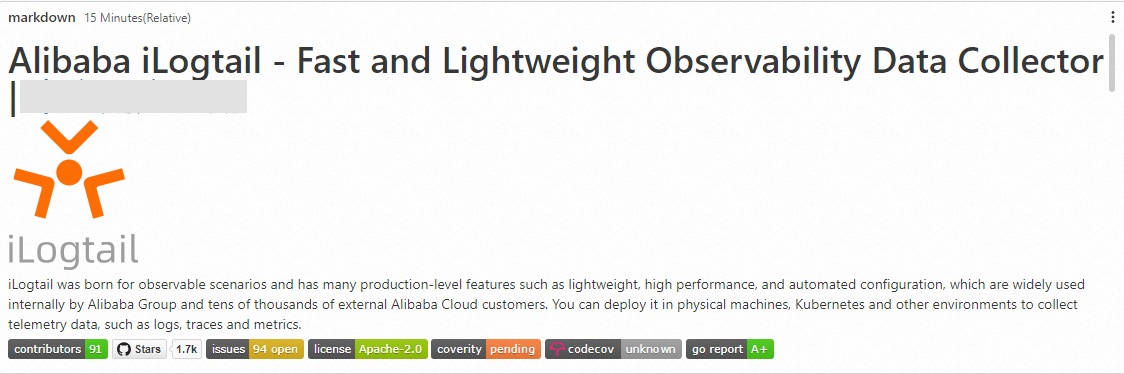
Basic Markdown chart |
| |
Query and analysis result-based Markdown chart |
| Configure a Markdown chart based on query and analysis results |

Configure a basic Markdown chart
Log on to the Simple Log Service console. In the Projects section, click the project you want.
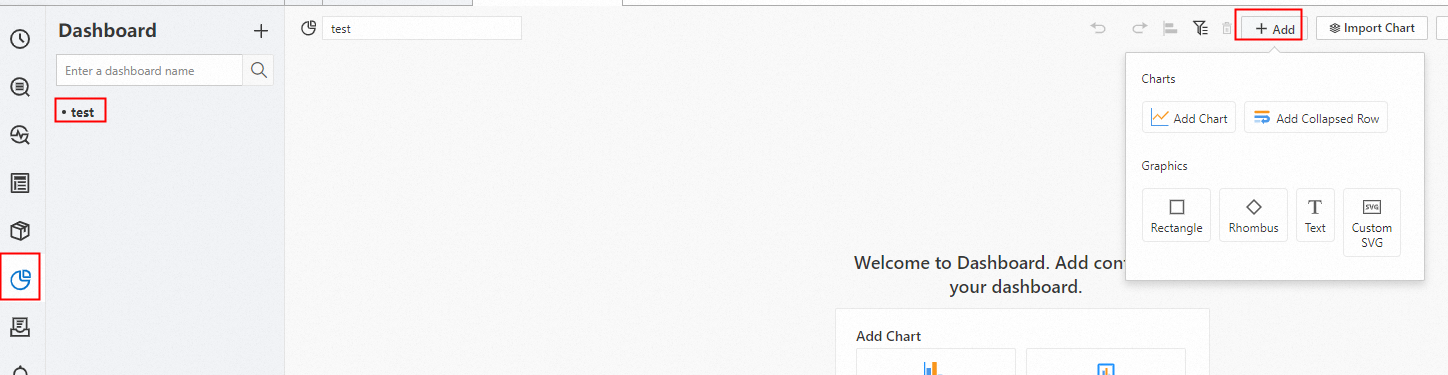
In the left-side navigation pane, choose Dashboard > Dashboards. In the dashboard list, click the dashboard you want. In the upper-right corner of the dashboard page, click Edit. In edit mode, click Add > Add Chart.
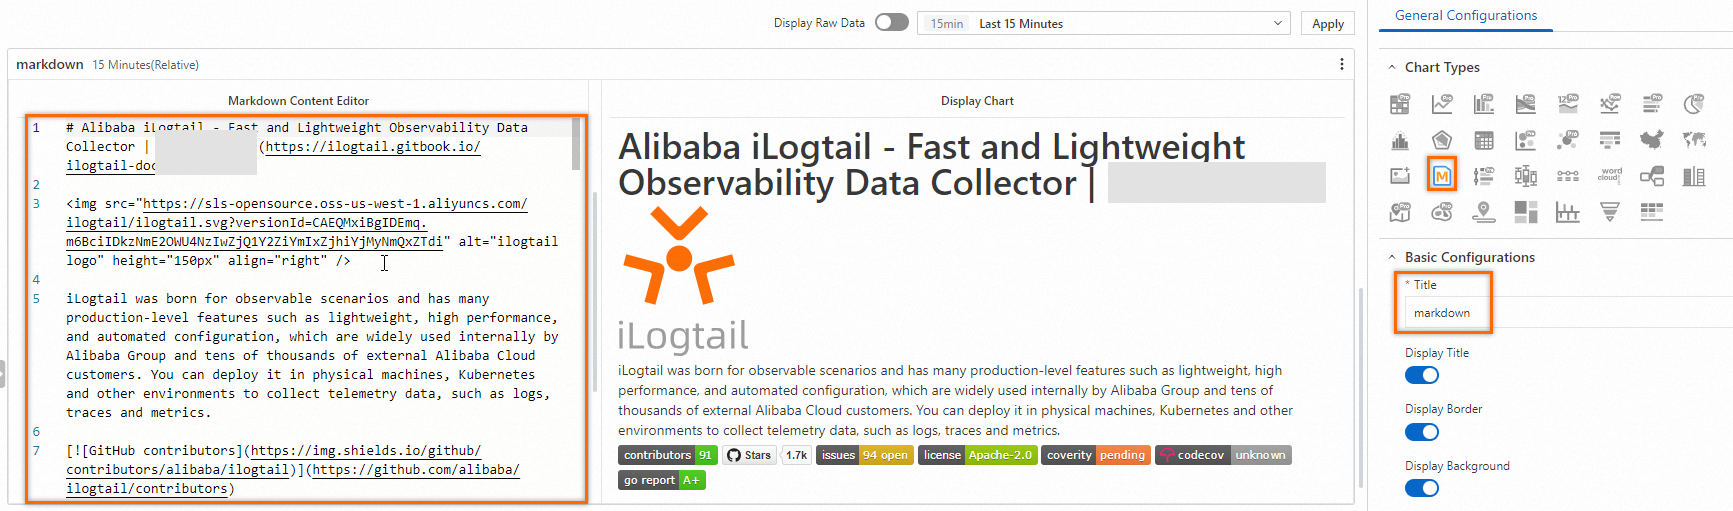
On the right side of the Edit Chart page, select Markdown Pro in the Chart Types section and configure the Title parameter in the Basic Configurations section based on the following figure. On the left side of the Edit Chart page, specify the content in the Markdown Content Editor section and view the configuration effect of the Markdown chart in the Display Chart section.
Configuration on the General Configurations tab
You can configure global settings for a Markdown chart on the General Configurations tab.
Basic Configurations
Parameter
Description
Title
The title of the chart.
Display Title
If you turn on Display Title, the title of the chart is displayed.
Display Border
If you turn on Display Border, the borders of the chart are displayed.
Display Background
If you turn on Display Background, the background color of the chart is displayed.
Display Time
If you turn on Display Time, the query time range of the chart is displayed.
Fixed Time
If you turn on Fixed Time, the query time range of the chart is independent of the global time range of the dashboard.
Parameters in the Markdown Configurations section
Parameter
Description
Center Method
The alignment mode of the Markdown chart. Valid values:
Horizontally Center
Vertically Center
Common Markdown syntax
Title
Markdown syntax
# Level-1 heading
## Level-2 heading
### Level-3 heading
Preview

Link
Markdown syntax
### Table of contents

[Chart description](https://www.alibabacloud.com/help/doc-detail/69313.htm)

[Dashboard](https://www.alibabacloud.com/help/doc-detail/59324.htm)
Preview
Image
Markdown syntax
<div align=center>

![Alt txt][id]

With a reference later in the document defining the URL location

[id]: https://octodex.github.com/images/dojocat.jpg  "The Dojocat"
Preview
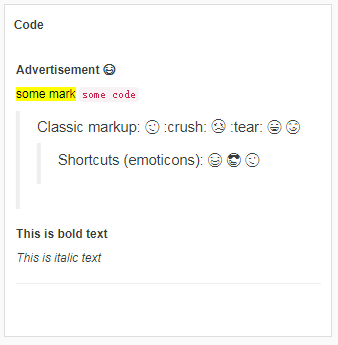
Special tag
Markdown syntax
---

__Advertisement :)__

==some mark==   `some code`
> Classic markup: :wink: :crush: :cry: :tear: :laughing: :yum:
>> Shortcuts (emoticons): :-)  8-) ;)

__This is bold text__

*This is italic text*

---
Preview