If you want to monitor the metric trend for a log field in a logstore, use the e_to_metric function to convert the log field to a metric in a metricstore. Then view the metric trend in the metricstore. This topic describes how to convert a field of a NGINX access log to a metric.
Background information
The operational data of applications is classified into logs, traces, and metrics. A log indicates a discrete event. A trace indicates an event that contains a call chain. A metric indicates an event that contains numeric measurements. Logs, traces, and metrics are events. A system that can store events can store the preceding types of data. Simple Log Service (SLS) provides the following types of stores for data storage:
Logstore
Logstores in SLS are used to collect, store, and query logs. For more information, see Logstore.
MetricStore
Metricstores in SLS are used to collect, store, and query metrics. metricstores are optimized based on metrics. Use the PromQL syntax that is provided by Prometheus to query metrics. For more information, see Metricstore.
For most applications, a log contains more information than a metric. Metrics can be considered as logs in a specific format. SLS allows you to convert logs to metrics. Use one of the following methods to convert logs to metrics:
Use the Scheduled SQL feature of SLS to aggregate logs to generate metrics. For more information, see Process and store data from a logstore to a metricstore.
Use the e_to_metric function for data transformation to convert log fields in a logstore to metrics. For more information, see e_to_metric function.
Scenarios
An enterprise created a logstore named nginx-demo in the China (Hangzhou) region to store NGINX access logs.
The enterprise wants to monitor the trends of the request duration and response duration of requests for related hosts and visualize the trends in dashboards. The request_time and upstream_response_time fields indicate the request duration and response duration. To meet the requirements, you must convert the request_time and upstream_response_time fields in the logs of the logstore to metrics and add the Host tag.
body_bytes_sent:1750
host:www.example.com
http_referer:www.guide.example.com
http_user_agent:Mozilla/5.0 (Macintosh; U; Intel Mac OS X 10_6_6; it-it) AppleWebKit/533.20.25 (KHTML, like Gecko) Version/5.0.4 Safari/533.20.27
http_x_forwarded_for:203.0.113.10
remote_addr:203.0.113.10
remote_user:p288
request_length:13741
request_method:GET
request_time:71
request_uri:/request/path-1/file-1
status:200
time_local:11/Aug/2021:06:52:27
upstream_response_time:0.66
Prerequisites
Logs are collected. For more information, see Data collection overview.
Step 1: Create a metricstore
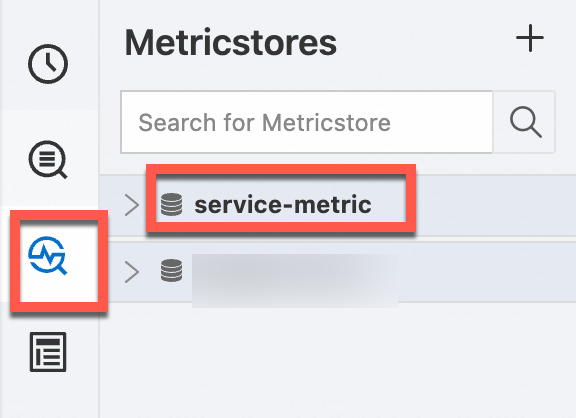
Create a metricstore named service-metric to store the metrics that are returned after data transformation.
Log on to the Simple Log Service console.
In the Projects section, click the one you want.

On the tab, click the + icon.
In the Create Metricstore panel, configure the following parameters and click OK.
Parameter
Description
Metricstore Name
The name of the metricstore. The name must be unique in the project to which the metricstore belongs. After the metricstore is created, you cannot change the name of the metricstore.
Data Retention Period
The retention period of the collected metrics in the metricstore.
If you select Specified Days for Data Retention Period, specify how many days you want to store metrics based on your business requirements. Valid values: 1 to 3000. Unit: days.
WarningAfter the retention period ends, metrics are automatically deleted.
If you shorten the data retention period, SLS deletes all expired metrics within 1 hour. The data volume that is displayed for Usage Details on the homepage of the SLS console is updated the next day. For example, if you change the data retention period from 5 days to 1 day, SLS deletes the metrics of the previous four days within 1 hour.
If you select Permanent Storage for Data Retention Period, SLS permanently stores the collected metrics in the metricstore.
NoteIf you query the data retention period by calling an SDK and the returned result is 3650, metrics are permanently stored.
Shards
The number of shards. SLS provides shards that allow you to read and write data. Each shard supports a write capacity of 5 MB/s and 500 writes/s and a read capacity of 10 MB/s and 100 reads/s. You can create up to 10 shards in each metricstore. You can create up to 200 shards in each project. For more information, see Shard.
Automatic Sharding
If you turn on Automatic Sharding, SLS increases the number of shards when the existing shards cannot accommodate the data that is written. For more information, see Manage shards.
Maximum Shards
If you turn on Automatic Sharding, you must configure this parameter to specify the maximum number of readwrite shards that can be created. Maximum value: 256.
Step 2: Create a data transformation job
Use the e_to_metric function to create a data transformation job and store the transformation results to the metricstore that is created in Step 1. For more information, see e_to_metric.
In the upper-right corner of the Data Transformation page, select a query time range. Make sure that the log that you want to manage is displayed on the Raw Logs tab.
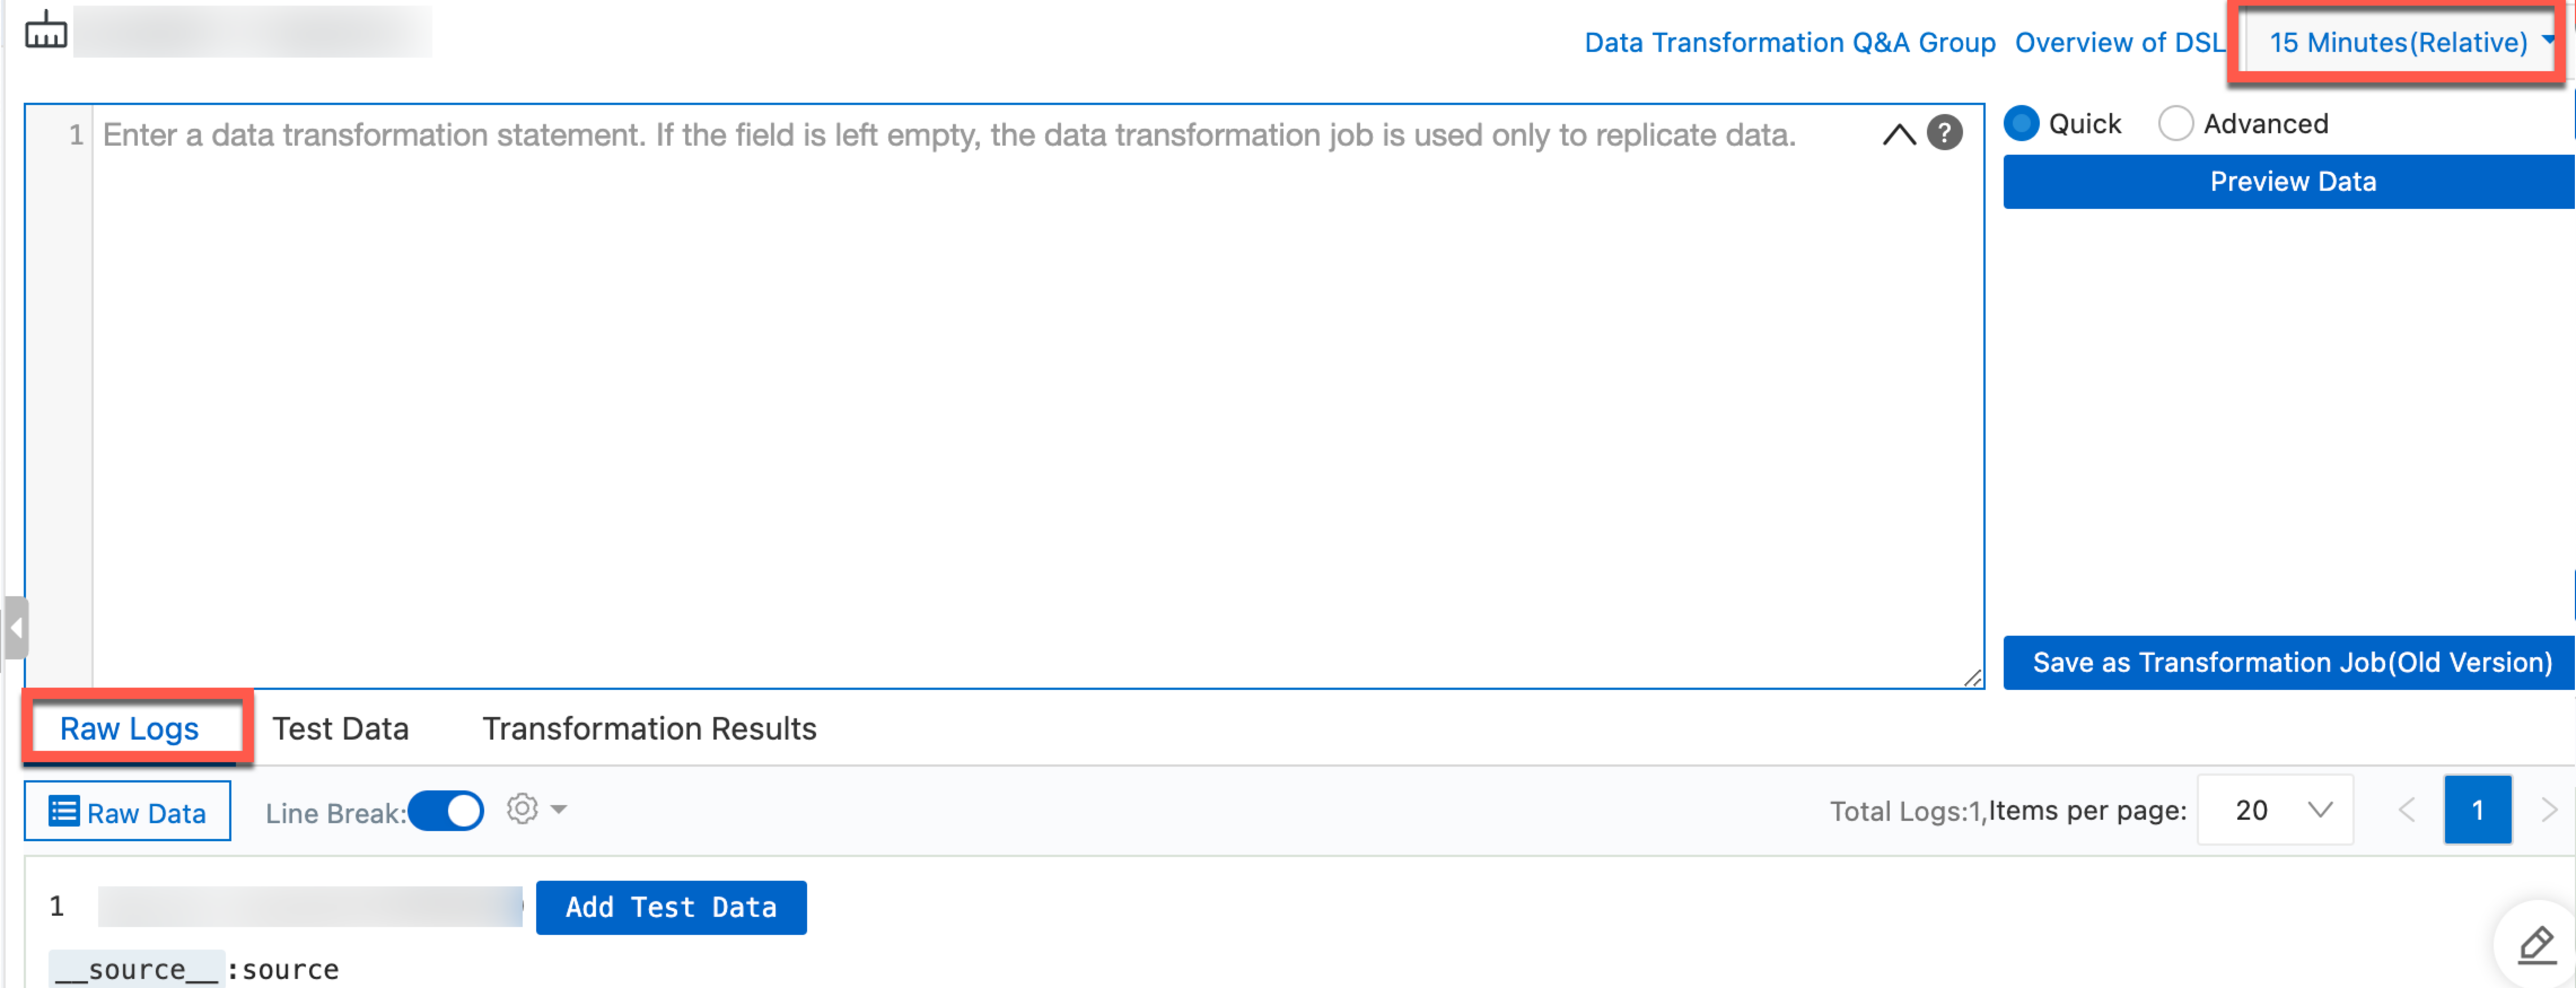
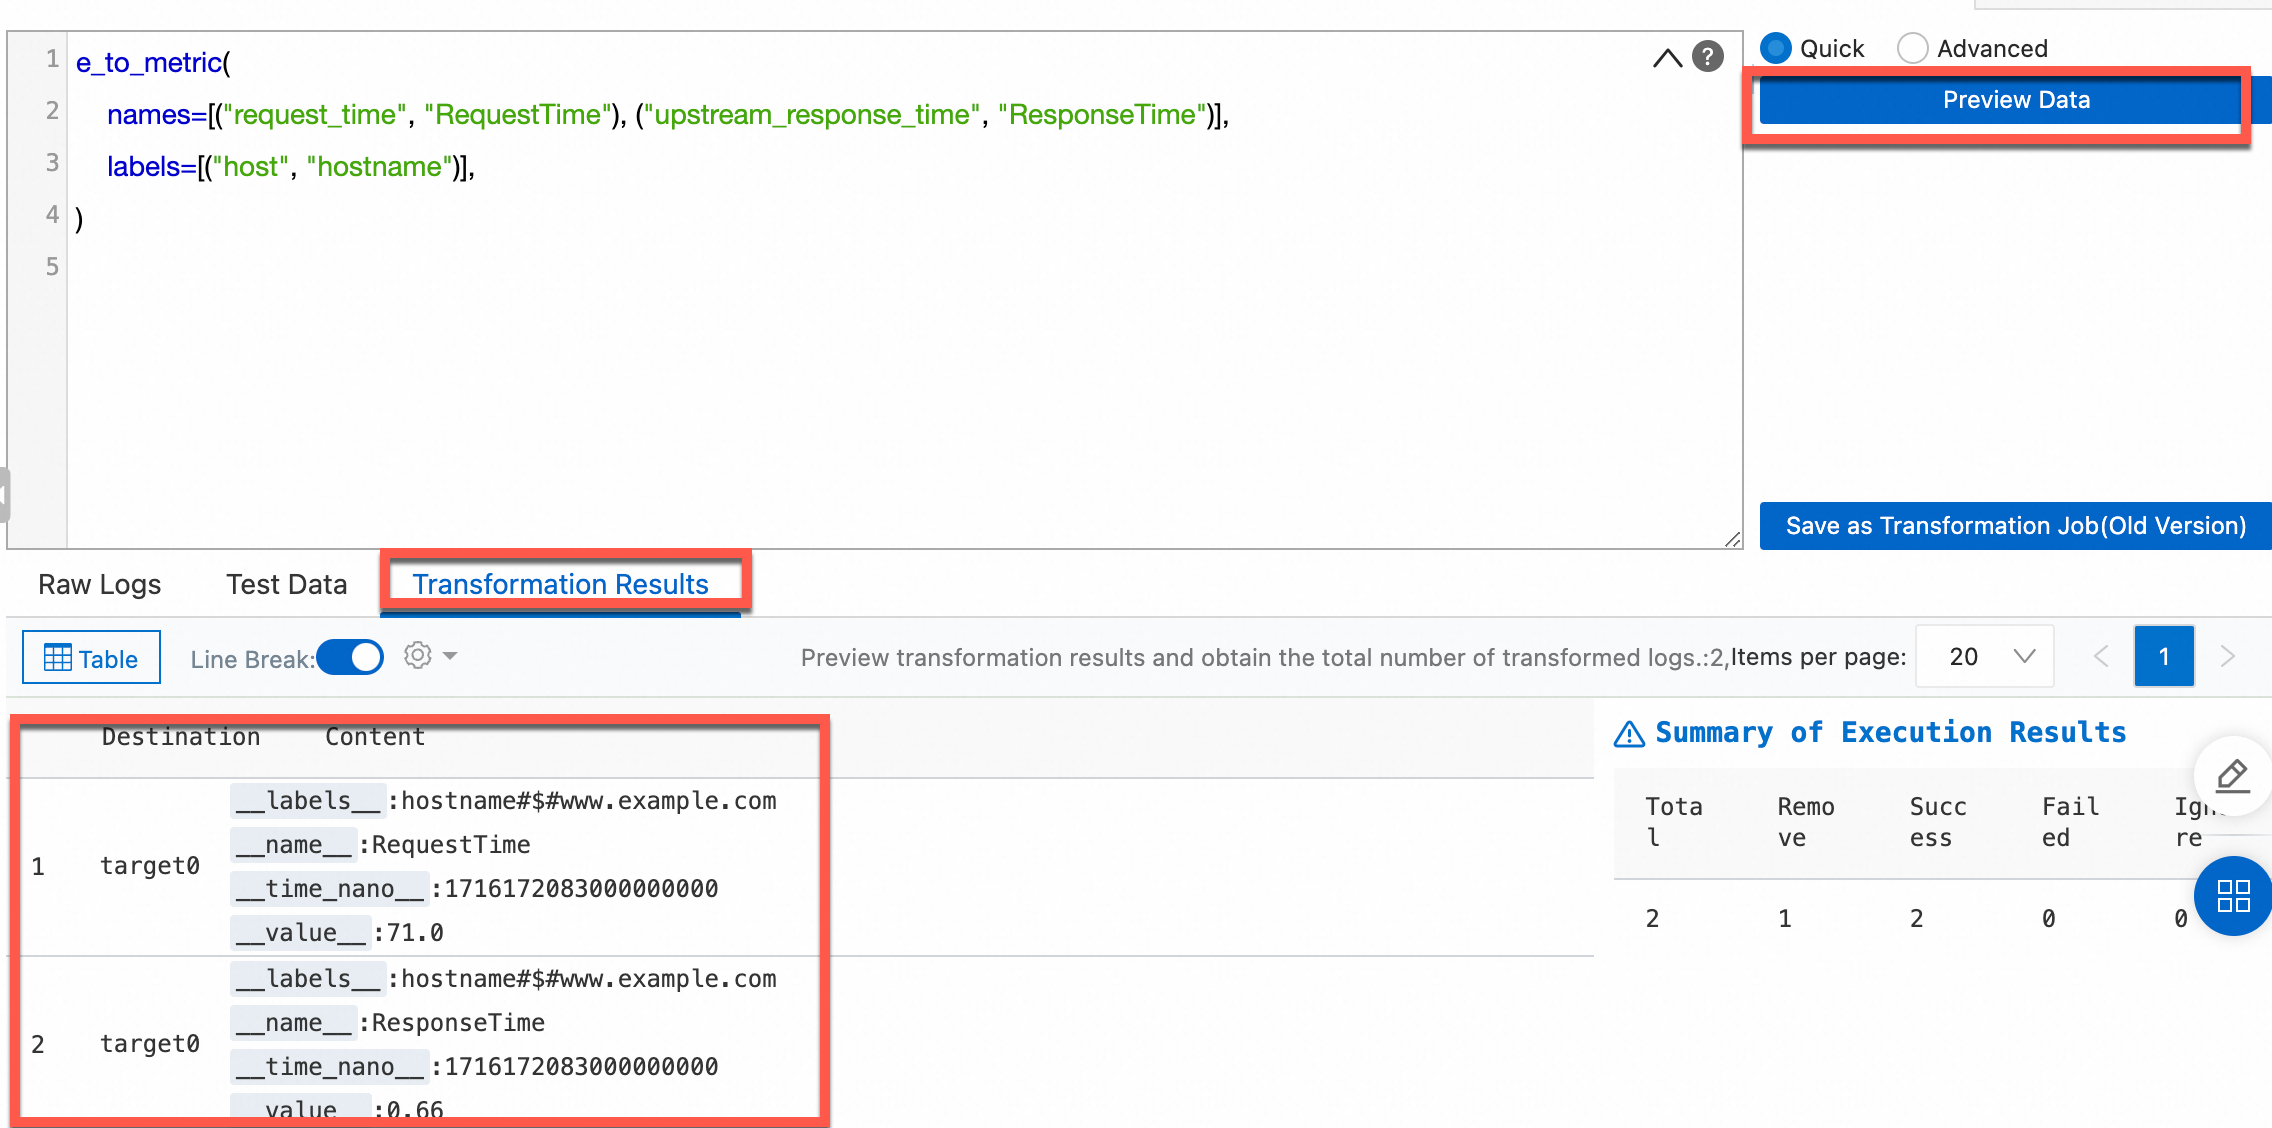
In the code editor, enter a data transformation statement. Convert the
request_timeandupstream_response_timefields in the logs of the logstore to metrics. Rename thehostfield tohostnameand specify hostname as the labels field.e_to_metric( names=[("request_time", "RequestTime"), ("upstream_response_time", "ResponseTime")], labels=[("host", "hostname")], )Click Preview Data to view results on the Transformation Results tab.
Create a data transformation job.
Click Save as Transformation Job.
In the Create Data Transformation Job panel, configure the parameters and click OK. The following table describes the parameters. For more information about the parameters, see Create a data transformation job.
Parameter
Description
Job Name, Display Name
The job name must be unique. You can specify a custom display name. Example: log2metric.
Authorization Method
Select Default Role to read data from the source logstore.
Storage Destination
Destination Name
The name of the storage destination. Example: log2metric.
Destination Region
The region of the project to which the destination metricstore belongs. Example: China (Hangzhou).
Destination Project
The name of the project to which the destination metricstore belongs.
Target Store
The name of the destination metricstore in which transformation results are stored. Example: service-metric.
Authorization Method
Select Default Role to write transformation results to the service-metric metricstore.
Time Range for Data Transformation
Time Range
Select All.
View the progress of the data transformation job.
Step 3: Query the metrics
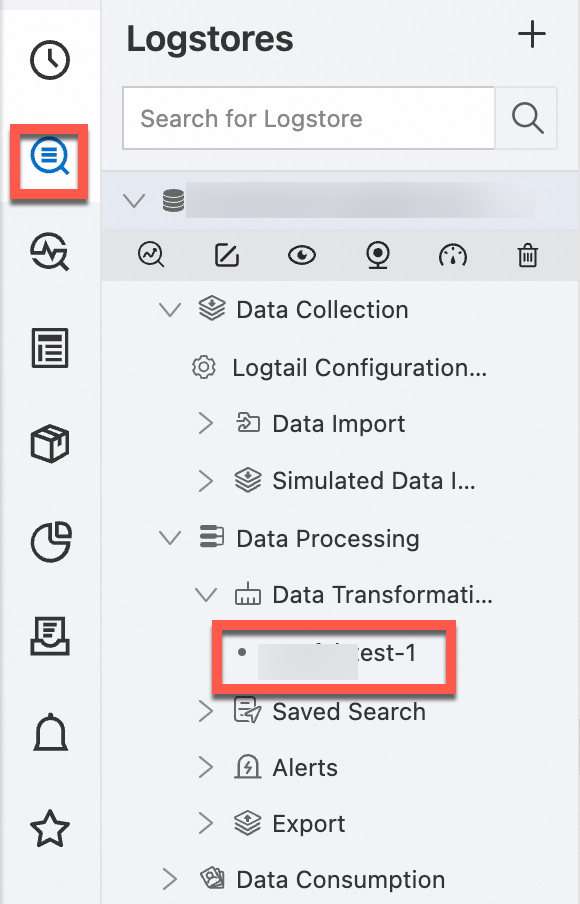
In the left-side navigation pane, choose . Then, select the destination metricstore.
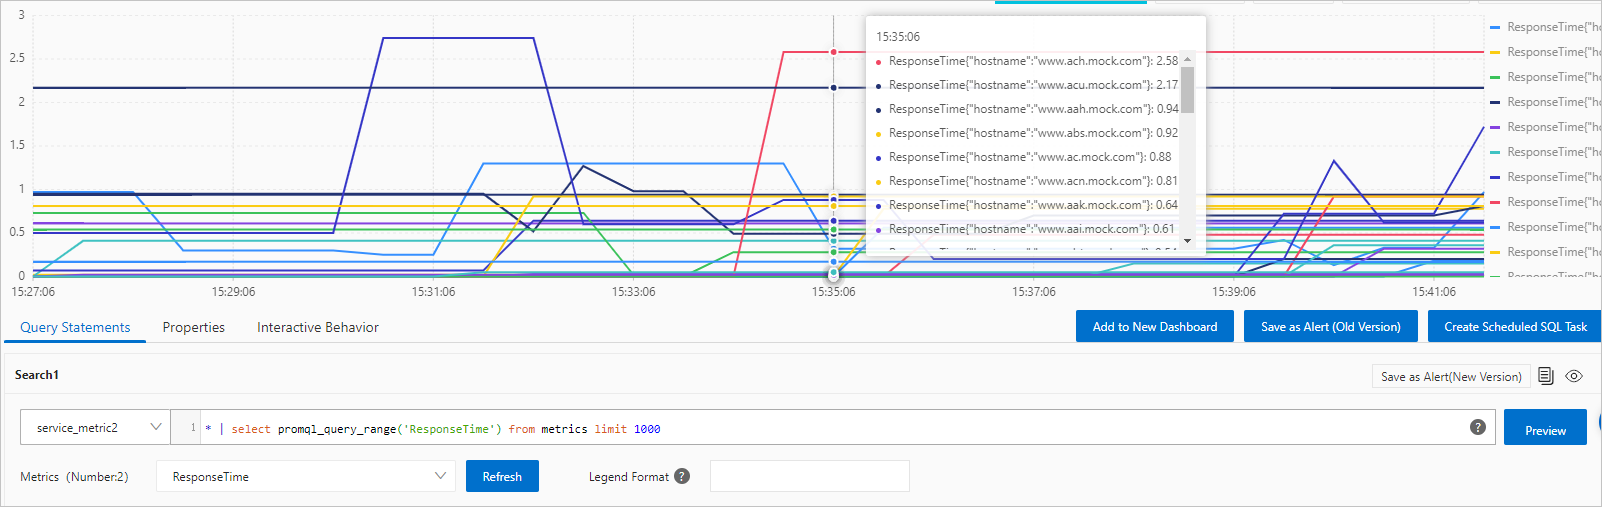
In the upper-right corner of the page that appears, click 15 Minutes(Relative) and specify a time range for data query and analysis.
NoteThe query and analysis results may contain metrics that are generated 1 minute earlier or later than the specified time range.
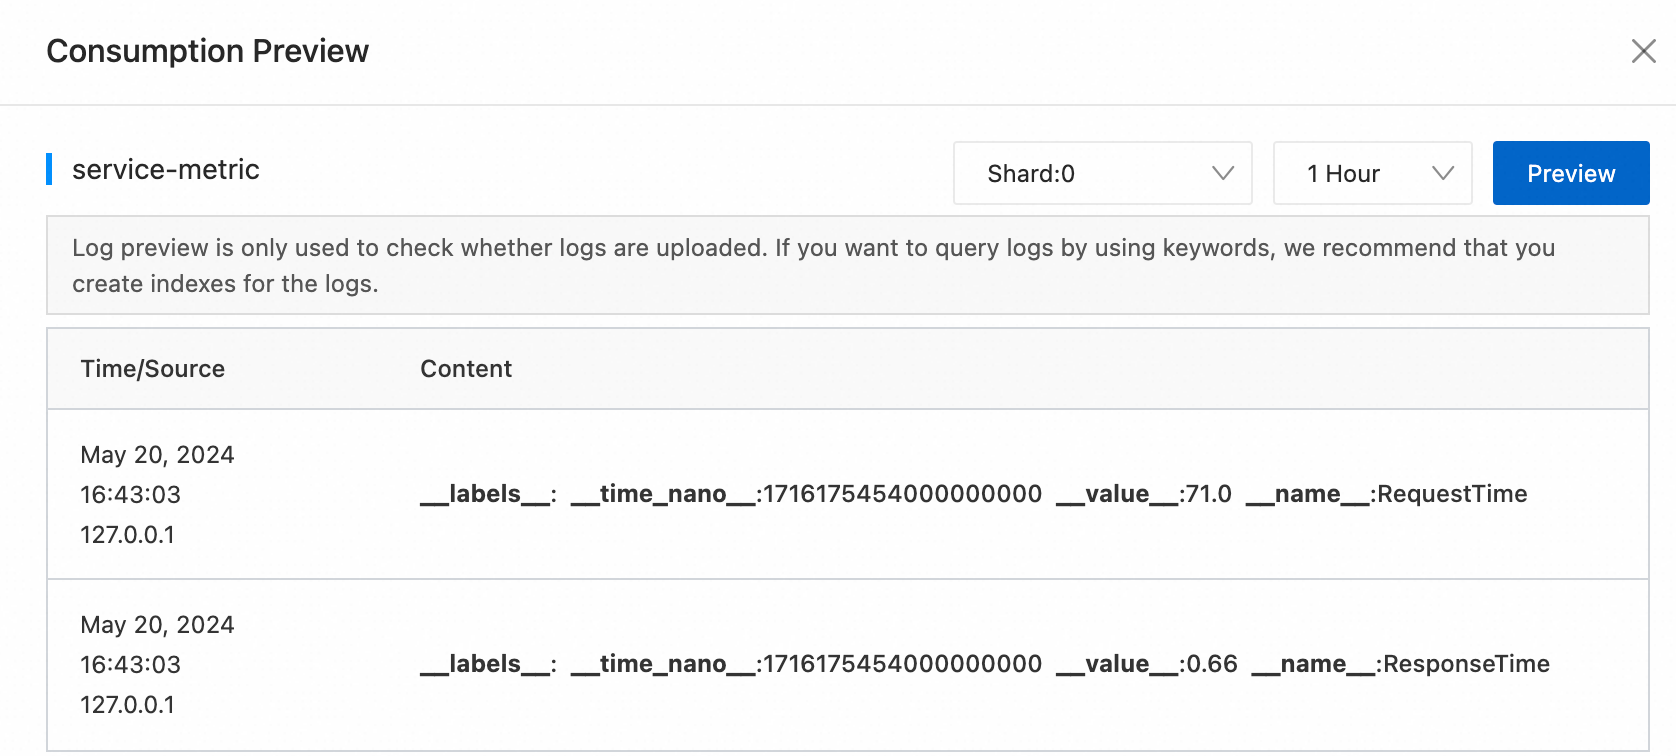
Click Preview Raw Data. In the panel that appears, select a time range and check whether the required logs are uploaded.
Enter a query statement by using one of the following methods. For more information about how to query metrics, see Query and analyze metric data.
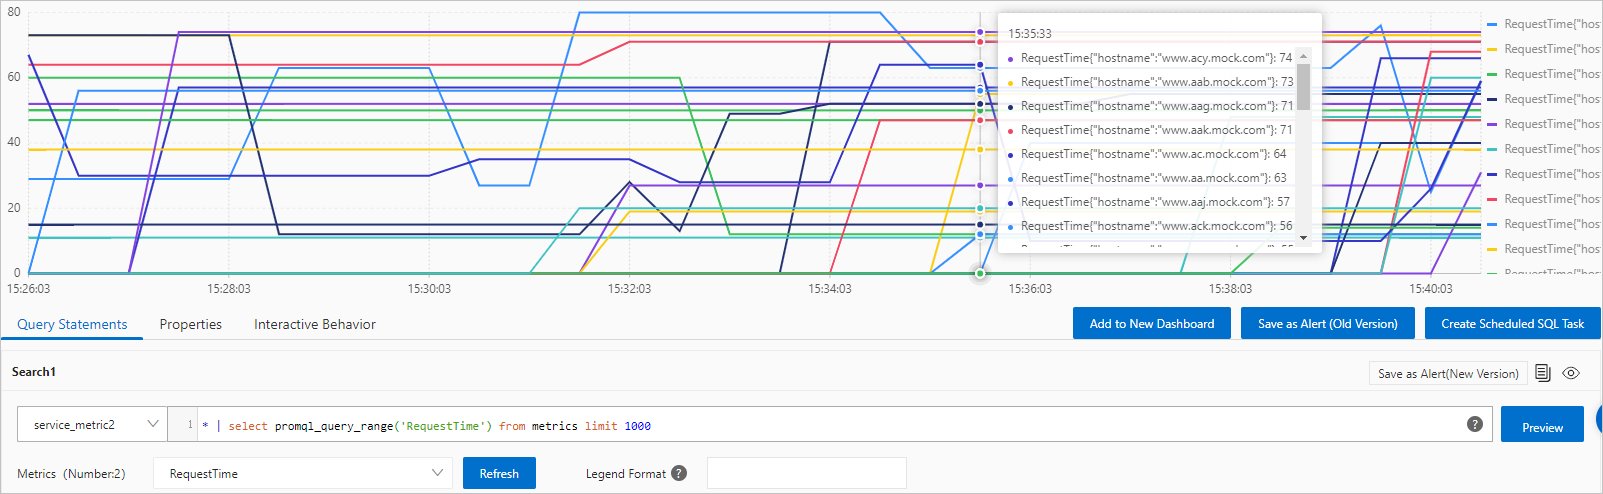
Enter a PromQL statement and click Execute Now.
You can add multiple query statements. Simple Log Service displays the results of multiple query statements in a time series chart.
Click Metrics Explore. In the dialog box that appears, find the metric that you want to use and click the
 icon in the Actions column. Simple Log Service automatically generates a query statement.
 In the dialog box of Metrics Explore, you can also find a metric and click Continue to Explore in the Actions column to specify label values. Simple Log Service automatically generates query statements based on your settings. For more information, see Metric exploration.
The trends of the request time of requests for each host
The trends of the response time of requests for each host