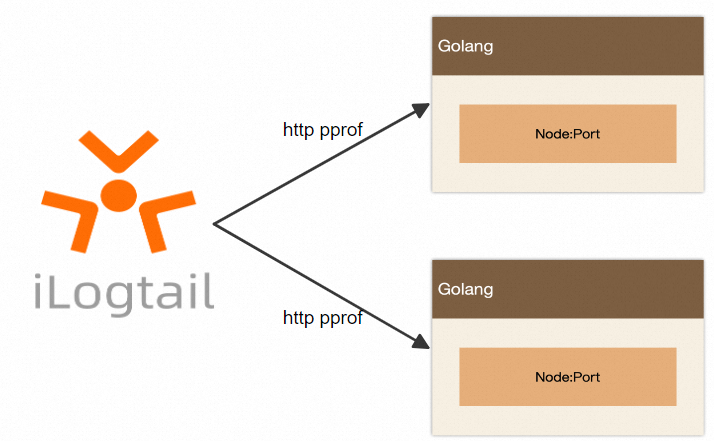
pprof is a profiling tool of Go. It is used to analyze and improve the performance of Go programs and provides performance data on Go programs. Use the Golang Pull module of the Full-stack Observability application provided by Simple Log Service to collect the performance data provided by pprof from Go programs. You can also analyze and view the collected data in the application.
A proprietary commercial agent for the Go language is available, providing code-less instrumentation with a richer feature set and enhanced stability. For more information, see Monitor Go applications.
Prerequisites
A Full-stack Observability instance is created. For more information, see Create an instance.
Usage notes
Only Linux Logtail V1.7 or later is supported.
How it works
Go provides a built-in exposure mechanism for the performance data provided by pprof. After you enable the built-in exposure mechanism in a Go program, Logtail can obtain the performance data over HTTP.

Preparations
Before you collect pprof performance data from Go programs, you must enable an exposure mechanism. Use the following code to enable the built-in exposure mechanism. You can also configure and enable a custom exposure mechanism. Make sure that the pprof performance data is exposed at the following address: {host}:{port}/debug/pprof/Port. In the following code, pprof performance data is exposed on port 8080.
package main

import (
	"net/http"
	_ "net/http/pprof"
)

func main() {

	// do something...

	_ = http.ListenAndServe(":8080", nil)
}
Create a Logtail configuration
Log on to the Simple Log Service console.
In the Log Application section, click the Intelligent O&M tab. Then, click Full-stack Observability.
On the Simple Log Service Full-stack Observability page, click the instance you want.
In the left-side navigation pane, click Performance Monitoring.
Click Enable if this is your first time to use Performance Monitoring in the instance.
In the left-side navigation tree, click Data Import. On the Data Access Configurations page, find Golang Pull.
The first time you create a Logtail configuration for host monitoring data, turn on the switch to go to the configuration page. If you created a Logtail configuration, click the
 icon to go to the configuration page.
 Create a machine group.
If a machine group is available, click Use Existing Machine Groups.
If no machine groups are available, perform the following steps to create a machine group. In this example, an Elastic Compute Service (ECS) instance is used.
On the ECS Instances tab, select Manually Select Instances. Then, select the ECS instance that you want to use and click Create.
For more information, see Install Logtail on an ECS instance.
ImportantIf you want to use an ECS instance that belongs to a different Alibaba Cloud account from Simple Log Service, a server from a third-party cloud service provider, or a server in a data center, you must manually install Linux Logtail V1.7 or later on the server. For more information, see Install Logtail on a Linux server. After you install Logtail, you must manually configure a user identifier on the server. For more information, see Configure a user identifier.
After Logtail is installed, click Complete Installation.
In the Create Machine Group step, configure the Name parameter and click Next.
Simple Log Service allows you to create IP address-based machine groups and custom identifier-based machine groups. For more information, see Create an IP address-based machine group and Create a custom identifier-based machine group.
ImportantMake sure that the server on which you want to install Logtail can connect to the server from which you want to collect performance data.
Confirm that the machine group is displayed in the Applied Server Groups section and click Next.
ImportantIf you apply a machine group immediately after you create the machine group, the heartbeat status of the machine group may be FAIL. This issue occurs because the machine group is not connected to Simple Log Service. To resolve this issue, you can click Automatic Retry. If the issue persists, see What do I do if no heartbeat connections are detected on Logtail?
In the Specify Data Source step, configure the following parameters and click Complete.
Parameter
Description
Config Name
The name of the Logtail configuration.
Cluster
The name of the cluster.
After you configure this parameter, Simple Log Service adds a
cluster=Cluster nametag to the performance data that is collected by using the Logtail configuration.ImportantMake sure that the cluster name is unique. Otherwise, data conflicts may occur.
Service
The name of the service. All instances that are specified in the Static Instance Array parameter belong to this service. For example, if you set the Service parameter to sls-mall, all instances that are specified in the Static Instance Array parameter belong to the sls-mall service.
Profile Whitelist
The type of data that you want to collect.
Collection Interval
The interval at which data is collected. Unit: seconds.
Timeout Period
The timeout period for data collection. Unit: seconds.
Maximum Body Size
The maximum size of data that can be collected. Unit: KB.
Static Instance Array
The information about the instances. The information includes the following configuration items:
Host Address: the address of the host.
Port: the port number.
Labels: the label that you want to add to the instance.
ImportantDo not enter service as a label key.
After you complete the configuration, Simple Log Service automatically creates assets such as Metricstores. For more information, see Assets.
Next steps
After you collect the pprof performance data from Go programs to Full-stack Observability, use the performance monitoring feature to troubleshoot performance issues. For more information, see Data query and Data comparison.