NGINX logs record important information that can be used for website O&M. Simple Log Service allows you to collect NGINX logs in NGINX configuration mode and analyze the collected logs from multiple dimensions. You can create Logtail configurations to collect logs. This topic describes how to create a Logtail configuration in NGINX configuration mode in the Simple Log Service console.
Solution overview
In NGINX configuration mode, Logtail structures the log content based on the log format specified by the log_format parameter. Before you collect NGINX access logs, you must configure the log_format and access_log parameters in the /etc/nginx/nginx.conf file. The log_format parameter specifies the log format, and the access_log parameter specifies the storage path to the NGINX log files.
Log format and storage path
In the following example, the default values of the log_format and access_log parameters are used:
log_format main  '$remote_addr - $remote_user [$time_local] "$request" '
                 '$request_time $request_length '
                 '$status $body_bytes_sent "$http_referer" '
                 '"$http_user_agent"';

access_log  /var/log/nginx/access.log  main;
The following table describes the log fields.
Field
Description
remote_addr
The IP address of the client.
remote_user
The username that is used by the client to send the request.
time_local
The system time of the server. The value must be enclosed in brackets [].
request
The URI and the HTTP protocol of the request.
request_time
The time that is required to process the request. Unit: seconds.
request_length
The length of the request. The request line, request headers, and request body are all counted.
status
The status of the request.
body_bytes_sent
The number of bytes in the response that is sent to the client. The response header is not counted.
http_referer
The URL of the source web page.
http_user_agent
The browser information of the client.
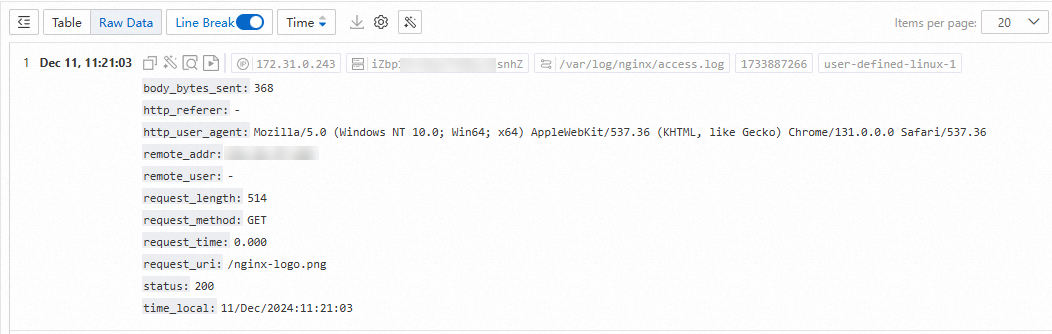
Raw log
Log that is generated by NGINX based on the log format specified by the log_format parameter:
192.168.1.1 - - [11/Dec/2024:11:21:03 +0800] "GET /nginx-logo.png HTTP/1.1" 0.000 514 200 368 "-" "Mozilla/5.0 (Windows NT 10.0; Win64; x64) AppleWebKit/537.36 (KHTML, like Gecko) Chrome/131.0.0.0 Safari/537.36"Log collected to the Simple Log Service Logstore:
Prerequisites
A machine group is created, and servers are added to the machine group. For more information, see Create a custom identifier-based machine group and Create an IP address-based machine group.
Your server can connect to port 80 and port 443 of remote servers to ensure that Logtail can send logs to Simple Log Service.
The server from which you want to collect logs continuously generates logs. Logtail collects only incremental logs. If a log file on your server is not updated after a Logtail configuration is delivered and applied to the server, Logtail does not collect logs from the file. For more information, see Collection process.
Procedure
Log on to the Simple Log Service console.
In the Projects section, click the project you want.
On the tab, click the logstore you want.
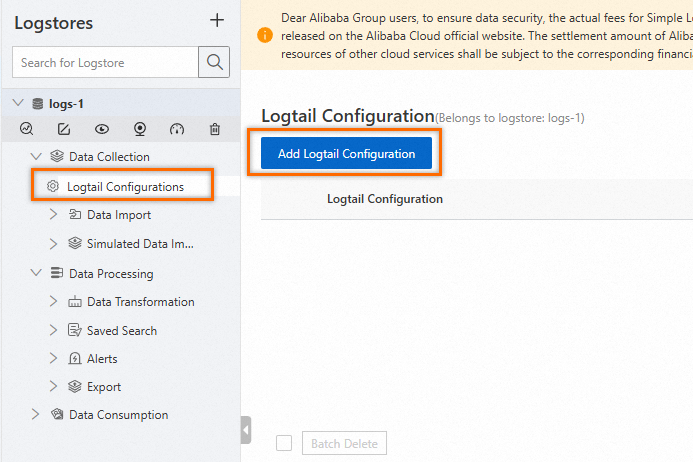
Click the drop-down arrow to the left of the Logstore, and then click Logtail Configurations. On the Logtail Configuration page, click Add Logtail Configuration.
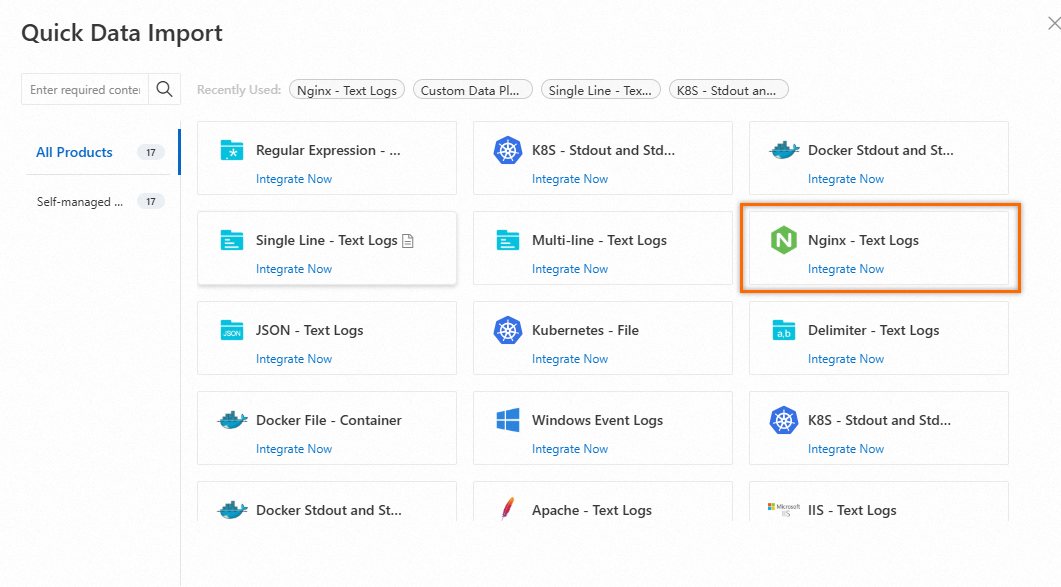
In the Quick Data Import dialog box, choose .
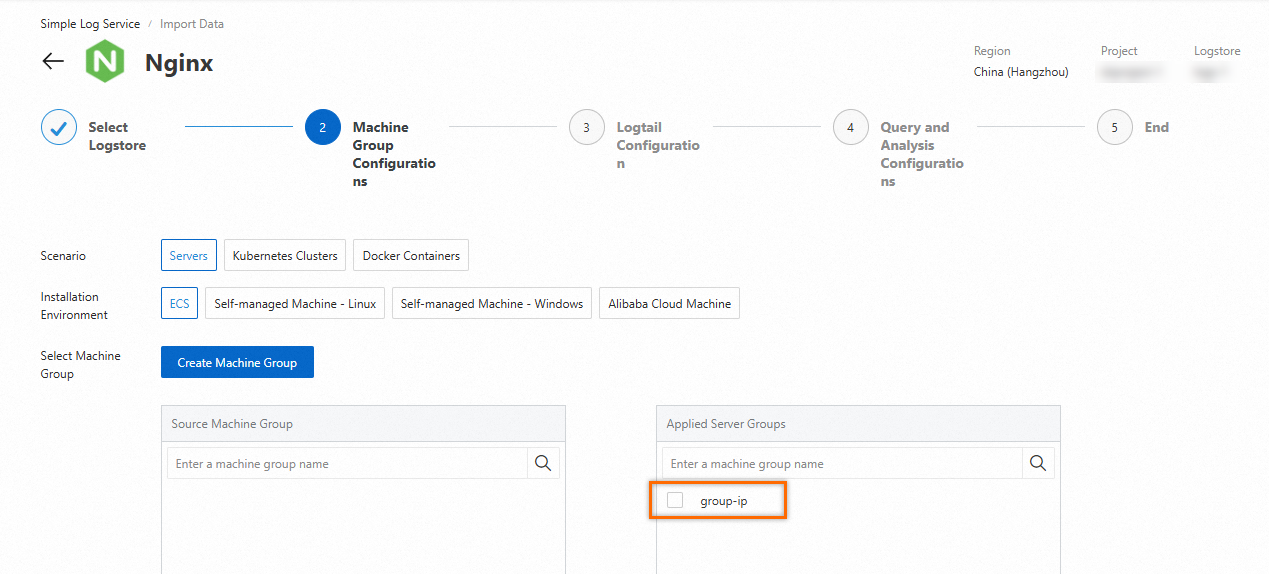
In the Machine Group Configurations step of the Import Data wizard, select the created machine group.
In the Logtail Configuration step of the Import Data wizard, configure the following parameters:
Configuration Name: The name of the Logtail configuration. Example:
nginx-logs.File Path: The storage path to the NGINX log files. For example, if you specify
/var/log/nginx/**/access*, Simple Log Service collects logs from the NGINX log files whose names are prefixed withaccessin the/var/log/nginxdirectory and the recursive subdirectories of the directory.Processor Configurations: Click Data Parsing (NGINX Mode). In the Processor dialog box, configure the NGINX Log Configuration parameter. In most cases, the value of the NGINX Log Configuration parameter is prefixed with log_format. Simple Log Service automatically extracts fields. Example:
log_format main  '$remote_addr - $remote_user [$time_local] "$request" '
                 '$request_time $request_length '
                 '$status $body_bytes_sent "$http_referer" '
                 '"$http_user_agent"';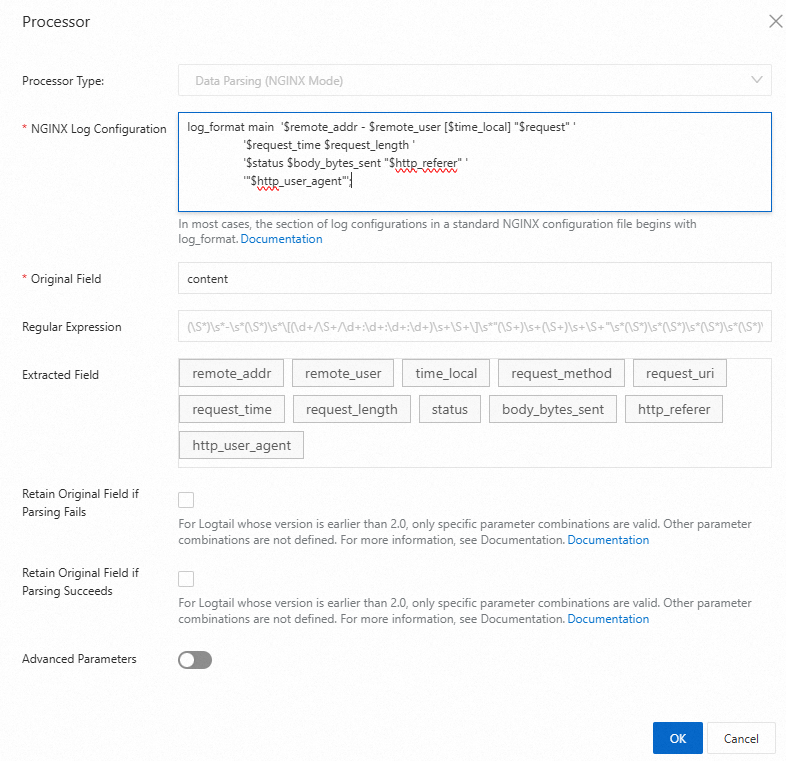
Retain the default values for other parameters. For more information, see Collect text logs from servers.
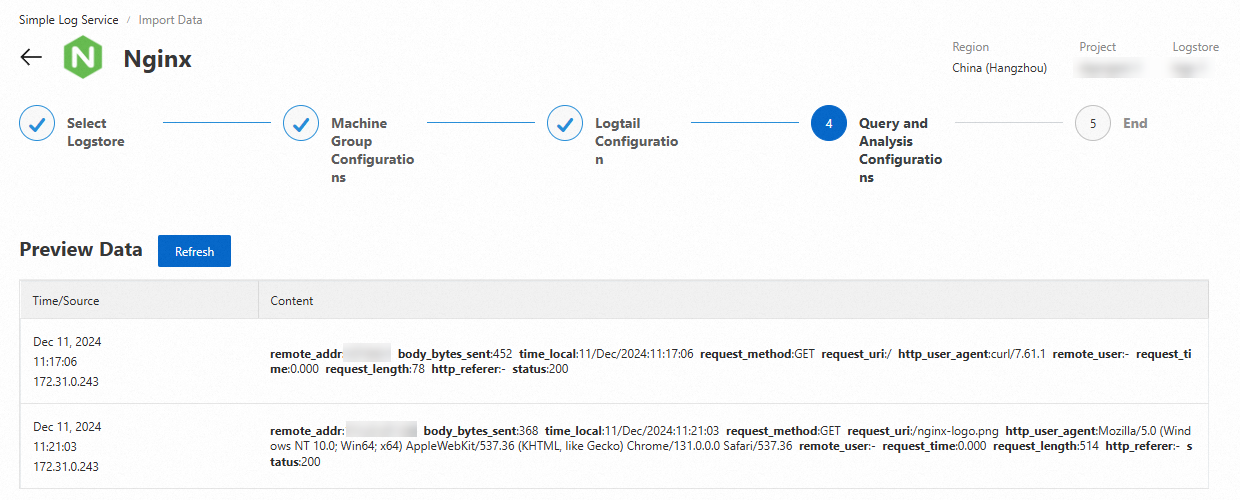
In the Query and Analysis Configurations step of the Import Data wizard, click Refresh to preview the collected logs.
Click Next to close the wizard. You can click Query Log. Then, you are navigated to the query and analysis page of your Logstore. You must wait approximately 1 minute for the indexes to take effect. Then, you can view the collected logs on the Raw Logs tab. For more information, see Guide to log query and analysis.
References
Simple Log Service provides the automatic diagnostic tool of Logtail for Linux servers. You can use the tool to identify and resolve issues in an efficient manner. For more information, see How do I use the automatic diagnostic tool of Logtail?
If the preview page is blank or no data is displayed on the query page when you use Logtail to collect logs, you can troubleshoot the issue by following the instructions provided in What do I do if errors occur when I use Logtail to collect logs?
When you use Logtail to collect logs, errors may occur. For example, the regular expression-based data parsing fails, the file path is invalid, or the traffic exceeds the processing capabilities of shards. You can view Logtail-based data collection errors by following the instructions provided in How do I view Logtail collection errors? For more information about the common errors in data collection, see How do I troubleshoot the common errors that may occur when Simple Log Service collects logs?
By default, you can use only one Logtail configuration to collect logs from a log file. You can also use multiple Logtail configurations to collect logs from a log file. For more information, see How do I collect multiple copies of logs in a file?
You can collect logs from servers in a corporate intranet to Simple Log Service. For more information, see Collect logs from servers in a corporate intranet.
If the storage paths to the logs that are generated by different servers are the same or the log files have the same name, and you want to distinguish the logs that are generated by different servers, you can follow the instructions provided in Machine Group Topic. You can also distinguish the logs that are generated for different users or instances. For more information, see File Path Extraction.
You can analyze, diagnose, and optimize access to a website. You can also configure alerts for website access logs. For more information, see Collect and analyze NGINX access logs.