After a workflow is executed, you can view the metrics about the workflow in the CloudFlow console or in the CloudMonitor console. You can also configure alert rules to monitor the statuses of the workflow. For example, you can configure an alert rule that sends an alert to the alert contact group when a workflow fails up to a specific number of times or exceeds a performance threshold. This topic describes how to view metrics and configure alert rules.
View metrics
View metrics in the CloudFlow console
Log on to the CloudFlow console. In the top navigation bar, select a region.
On the Workflows page, click the target workflow.
On the workflow details page, click the Metrics tab and set a time range. The tab displays metric cards for the selected time range.
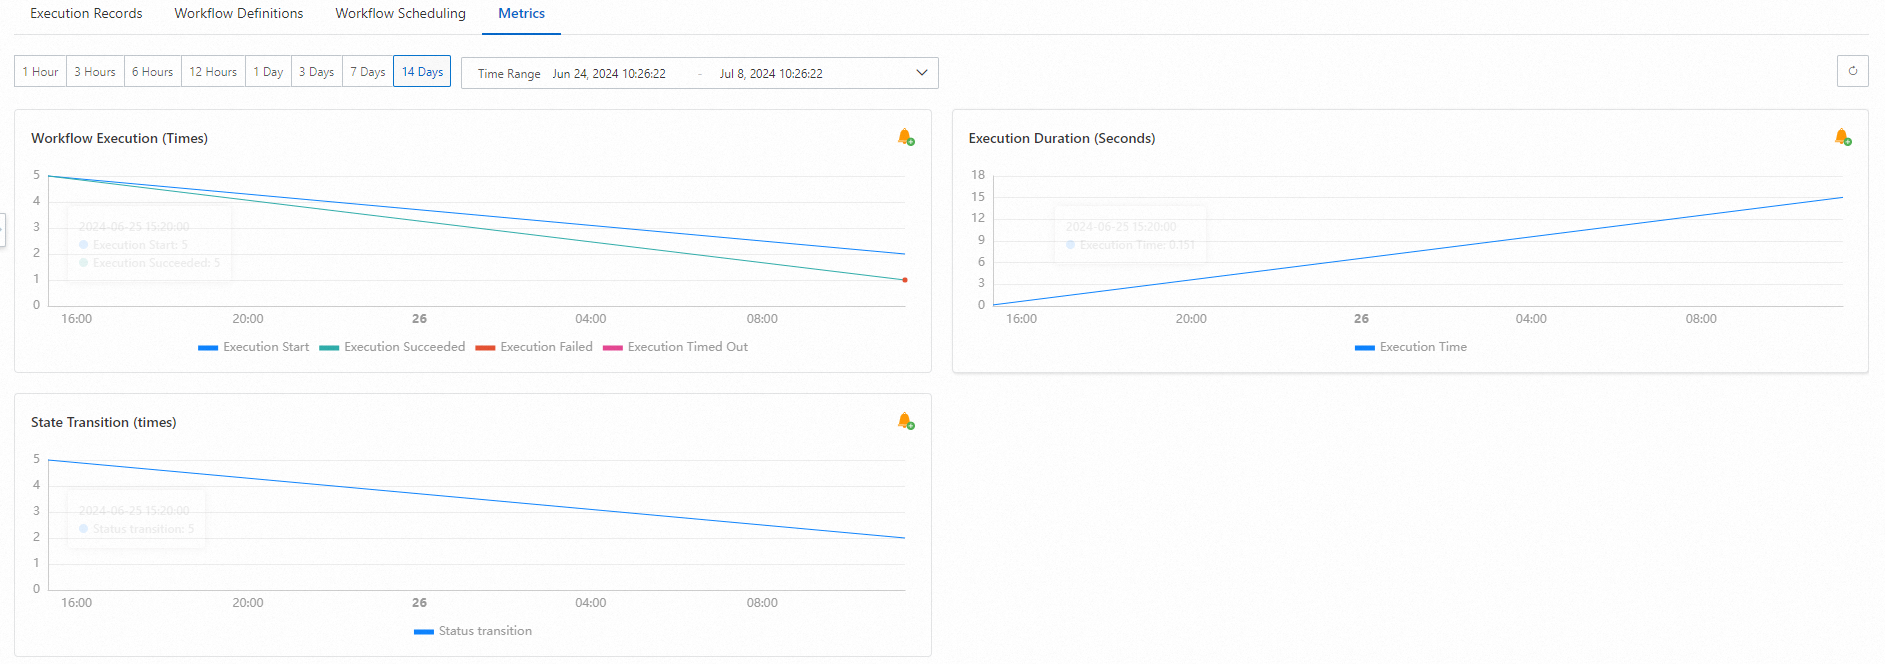
Tip: Click theicon in the upper-right corner of any metric card to go to the CloudMonitor console and configure alert rules for that metric. For details, see Configure alert rules.
View metrics in the CloudMonitor console
Log on to the CloudMonitor console.
In the left-side navigation pane, choose Cloud Service Monitoring > Cloud Service Monitoring. Search for Serverless Workflow and click CloudFlow.
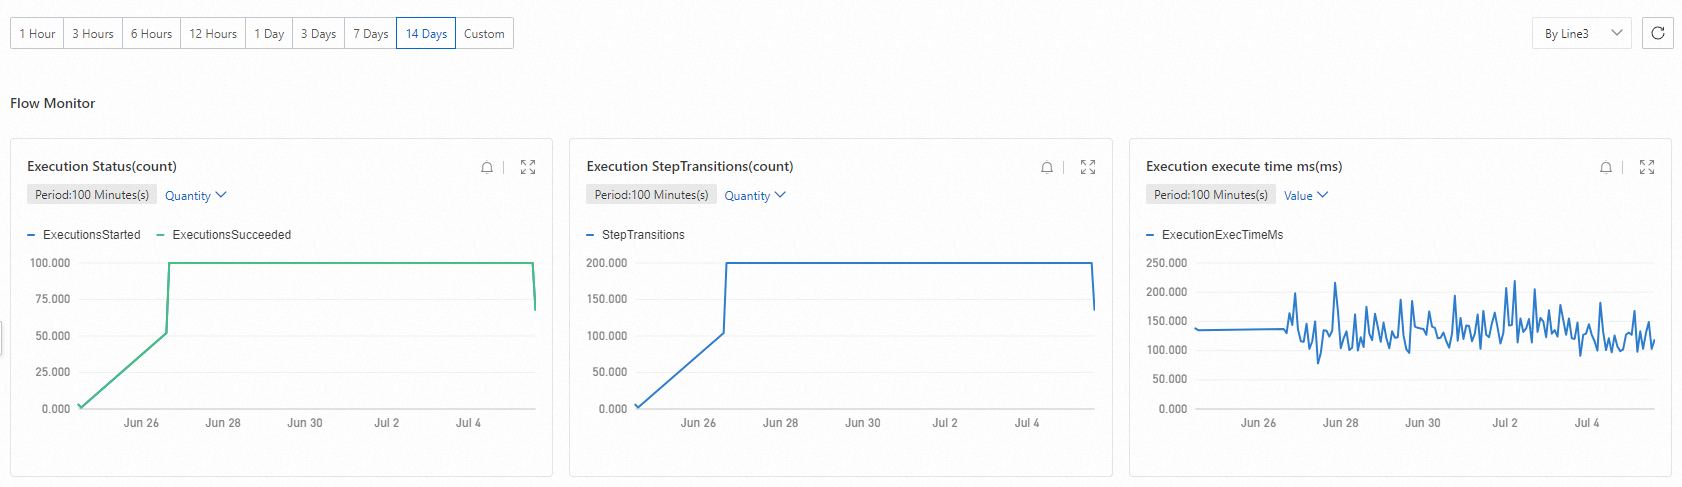
On the Serverless Workflow page, select a region and find the target workflow. In the Actions column, click Monitoring Charts.
Set the time range to view the workflow metrics.
Configure alert rules
Alert rules notify you when a workflow metric crosses a threshold. Alert rules are managed in the CloudMonitor console. The setup has three parts: create an application group, associate your workflows with the group, and define the alert rules.
Prerequisites
Before you begin, make sure that you have:
An alert contact created in CloudMonitor. For more information, see Create an alert contact
Create an application group and add workflows
Log on to the CloudMonitor console.
In the left-side navigation pane, choose Cloud Service Monitoring > Application Groups. Click Create Application Group.
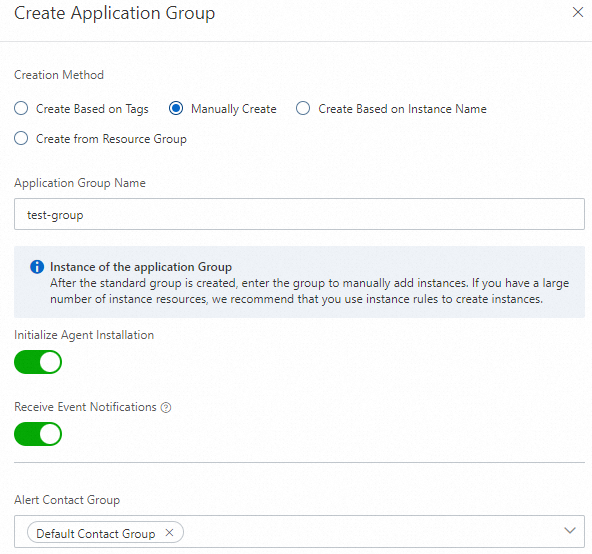
In the Create Application Group panel, select Manually Create for the creation method. Specify an Application Group Name and an Alert Contact Group, and then click OK. After the group is created, the application group details page opens.
In the left-side navigation pane of the application group, click Group Resources, and then click + Manage Services and Resources.
In the Add/Modify Group Resources panel, search for and select Serverless Workflow in the Associated Cloud Services field. Select the region and the workflows to monitor, and then click OK.
Create an alert rule
In the left-side navigation pane of the application group, click Alert Rules, and then click + Create Alert Rule.
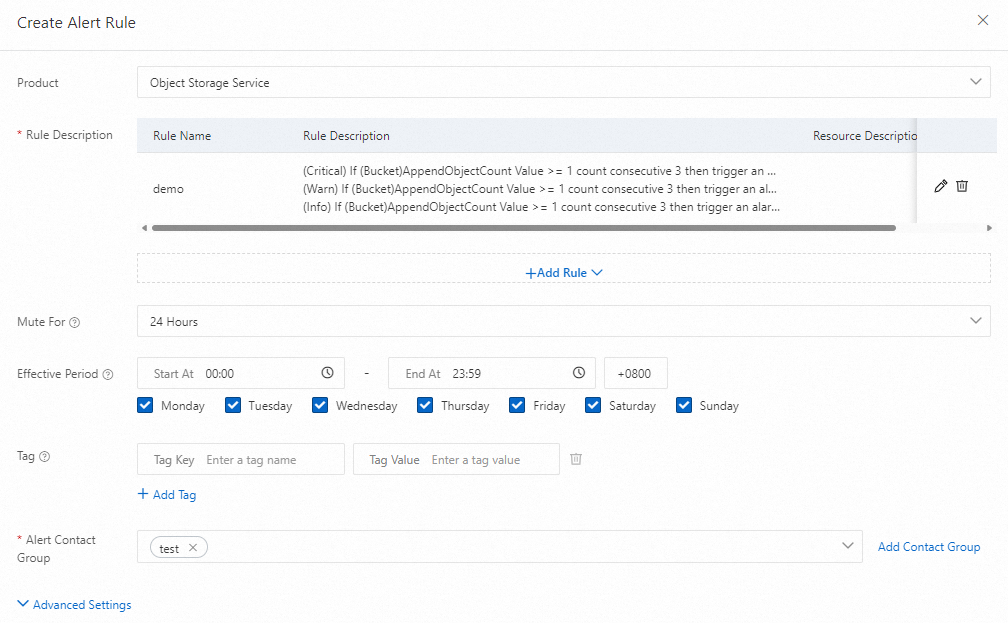
In the Create Alert Rule panel, configure the following settings:
Setting Description Mute For The period during which repeated alerts for the same rule are suppressed. Effective Period The time window during which the alert rule is active. Alert Contact Group The contact group that receives alert notifications. Click + Add Rule and select a metric type:
Metric type Use case Simple Indicators Monitor a single metric against a static threshold. Combined Indicators Combine multiple metrics into one rule. Expression Define custom conditions using metric expressions. Dynamic Threshold Automatically detect anomalies based on historical patterns. 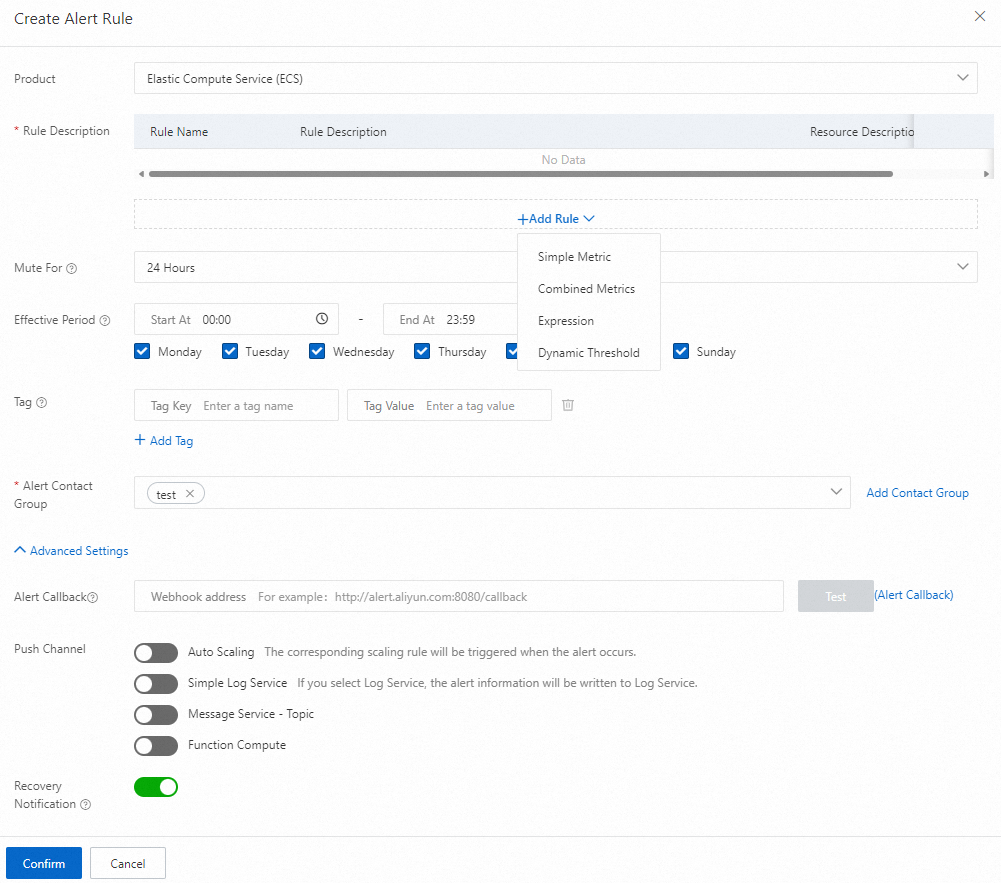
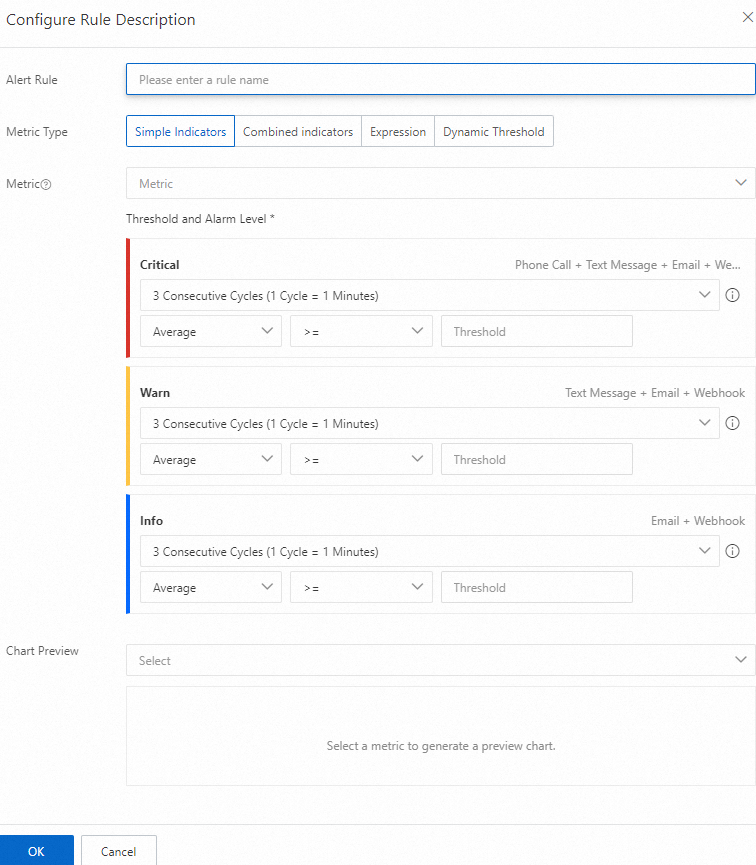
In the Set Rule Description panel, specify the metrics and thresholds to monitor, and then click OK.
Confirm the alert rule settings and click OK.
When a configured alert is triggered, CloudMonitor sends a notification to the specified alert contact group.