This topic describes how to view the traffic monitoring data of applications.
Prerequisites
View traffic distribution of applications
View traffic distribution of specific applications
On the DPI Statistics on Applications tab, you can set the following conditions to filter traffic monitoring data. For example, you can view the traffic percentages of applications during a specified time period or traffic percentages of specified applications.- topN: queries the traffic information about the top 10, top 50, top 100, or top 500 applications, application groups, or application request sources that have the highest percentages of traffic.
- Time: Click Select in the upper-right corner of the tab to select a time period for querying traffic
distribution of applications.
You can set the time period in the following formats:
- Relative: queries traffic distribution of applications from the current time to a specified
time in the past.
For example, you can select 5 Minutes and the current time is 14:33:38 (UTC+8) on November 26, 2020. In this case, the traffic distribution from 14:28:38 (UTC+8) on November 26, 2020 to 14:33:38 (UTC+8) on November 26, 2020 is queried.
- Rounded to Hour: queries traffic distribution of applications from the beginning of the current hour
to a specified time in the past.
For example, you can select 1 Hour and the current time is 14:33:38 (UTC+8) on November 26, 2020. In this case, the traffic distribution from 13:00:00 (UTC+8) on November 26, 2020 to 14:00:00 (UTC+8) on November 26, 2020 is queried.
- Custom: queries traffic distribution of applications during a custom time period.
- Relative: queries traffic distribution of applications from the current time to a specified
time in the past.
- Specified Applications: queries traffic distribution of applications in specified application groups or
of specified applications.
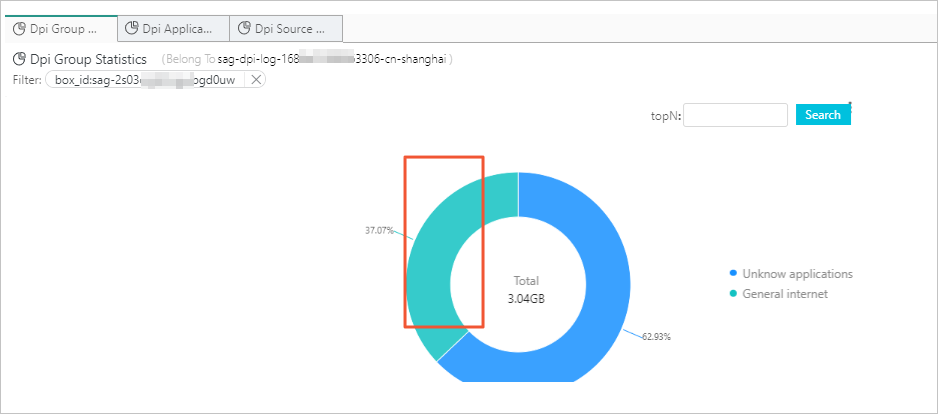
For example, the following figure shows the traffic percentage of each application for a specified SAG instance. The information is displayed on the DPI Statistics by Application Group tab. If you click the green area in the ring diagram, you are redirected to the DPI Statistics on Applications tab. This tab displays the traffic distribution of each application in the General internet group.
