You can use the job debugging feature to simulate a job run, check the output results, and verify the business logic of SELECT or INSERT statements. This feature improves development efficiency and reduces data quality risks. This topic describes how to debug a Flink SQL job.
Background information
You can use the job debugging feature in the Flink development console to verify your job logic locally. This process does not write data to production downstream sinks, regardless of the sink table type. When you debug a job, you can use live upstream data or specify test data. You can debug complex jobs that contain multiple SELECT or INSERT statements. The feature also supports UPSERT queries, which lets you run statements that include update operations, such as count(*).
Limits
The job debugging feature requires a session cluster.
Debugging is supported only for SQL jobs.
Debugging is not supported for CREATE TABLE AS SELECT (CTAS) and CREATE DATABASE AS (CDAS) statements.
By default, Flink automatically pauses after reading a maximum of 1,000 records.
Each debugging session in a session cluster is limited to a maximum of three minutes. This limit ensures cluster stability and helps manage the cluster lifecycle.
Usage notes
Creating a session cluster consumes cluster resources. The amount of resources consumed depends on the resource configuration you select during creation.
Do not use session clusters in a production environment. Session clusters are intended for development and testing. Using a session cluster to debug jobs can improve the resource utilization of the JobManager (JM). If you use a session cluster in a production environment, the JM reuse mechanism can negatively affect job stability. The details are as follows:
A single point of failure (SPOF) in the JobManager affects all jobs in the cluster.
A SPOF in a TaskManager affects the jobs that have tasks running on it.
Within the same TaskManager, if there is no process isolation between tasks, they may interfere with each other.
If the session cluster uses the default configurations, note the following recommendations:
For small jobs with a single degree of parallelism, the total number of jobs in the cluster should not exceed 100.
For complex jobs, the maximum degree of parallelism for a single job should not exceed 512. For a single cluster, do not run more than 32 medium-sized jobs with a degree of parallelism of 64. Otherwise, issues such as heartbeat timeouts may occur and affect cluster stability. In this case, increase the heartbeat interval and timeout.
To run more tasks concurrently, increase the resource configuration of the session cluster.
Procedure
Step 1: Create a session cluster
Go to the Session Management page.
Log on to the Real-time Computing Platform console.
In the Actions column of the target workspace, click Console.
In the navigation pane on the left, choose .
Click Create Session Cluster.
Enter the configuration information.
The following table describes the parameters.
Module
Configuration
Description
Basic configurations
Name
The name of the session cluster.
Deployment target
Select a target resource queue. For more information about how to create a resource queue, see Manage resource queues.
State
Set the desired state of the cluster:
RUNNING: The cluster keeps running after it is configured.
STOPPED: The cluster stops after it is configured. All jobs that are deployed in the session cluster also stop.
Scheduled session management
To prevent resource waste from long-running session clusters, you can configure the cluster to automatically shut down if no jobs are running for a specified period.
Tag Name
You can add tags to jobs. This helps you quickly locate jobs on the Overview page.
Tag value
None.
Configuration
Engine version
For more information about engine versions, see Engine versions and Lifecycle policy. We recommend that you use a recommended or stable version. The following list describes the version tags:
Recommended: The latest minor version of the latest major version.
Stable: The latest minor version of a major version that is still in its service period. Bugs from previous versions are fixed in this version.
Normal: Other minor versions that are still in their service period.
EOS: A version that has passed its end-of-service date.
Flink restart strategy
This parameter can have the following values:
Failure Rate: Restarts based on the failure rate.
If you select this option, you must also specify Failure Rate Interval, Max Failures Per Interval, and Delay Between Restarts.
Fixed Delay: Restarts at a fixed interval.
If you select this option, you must also specify Restart Attempts and Delay Between Restarts.
No Restarts: The job does not restart if a task fails.
ImportantIf you do not configure this parameter, the default Apache Flink restart strategy is used. If a task fails and checkpointing is disabled, the JobManager process does not restart. If checkpointing is enabled, the JobManager process restarts.
Other configurations
Set more Flink configurations here. For example,
taskmanager.numberOfTaskSlots: 1.Resource configurations
Number of TaskManagers
By default, this value is the same as the degree of parallelism.
JobManager CPU cores
The default value is 1.
JobManager memory
The minimum value is 1 GiB. The recommended value is 4 GiB. We recommend that you use GiB or MiB as the unit. For example, 1024 MiB or 1.5 GiB.
TaskManager CPU cores
The default value is 2.
TaskManager memory
The minimum value is 1 GiB. The recommended value is 8 GiB. We recommend that you use GiB or MiB as the unit. For example, 1024 MiB or 1.5 GiB.
Recommended TaskManager configurations include the number of slots per TaskManager (taskmanager.numberOfTaskSlots) and the TaskManager resource size. Details are as follows:
For small jobs with a single degree of parallelism, a CPU-to-memory ratio of 1:4 per slot is recommended. Use at least 1 core and 2 GiB of memory.
For complex jobs, use at least 1 core and 4 GiB of memory per slot. With the default resource configuration, you can configure two slots for each TaskManager.
TaskManager resources should not be too small or too large. We recommend using the default resource configuration and setting the number of slots to 2.
ImportantIf a single TaskManager has insufficient resources, the stability of the jobs running on it may be affected. Also, because the number of slots is small, the overhead of the TaskManager cannot be effectively shared, which reduces resource utilization.
If a single TaskManager has excessive resources, many jobs will run on it. If the TaskManager experiences a single point of failure, the impact will be widespread.
Log configurations
Root log level
The following log levels are listed in ascending order of severity:
TRACE: More fine-grained information than DEBUG.
DEBUG: Information about the system running status.
INFO: Important or interesting information.
WARN: Information about potential system errors.
ERROR: Information about system errors and exceptions.
Class log level
Enter the log name and level.
Log template
You can select a system template or a custom template.
NoteFor more information about options related to the integration of Flink with resource orchestration frameworks such as Kubernetes and Yarn, see Resource Orchestration Frameworks.
Click Create Session Cluster.
After the session cluster is created, you can select it on the job debugging page or the deployment page.
Step 2: Debug the job
Write the SQL code for the job. For more information, see Job development map.
On the ETL page, click Debug, select a debug cluster, and then click Next.
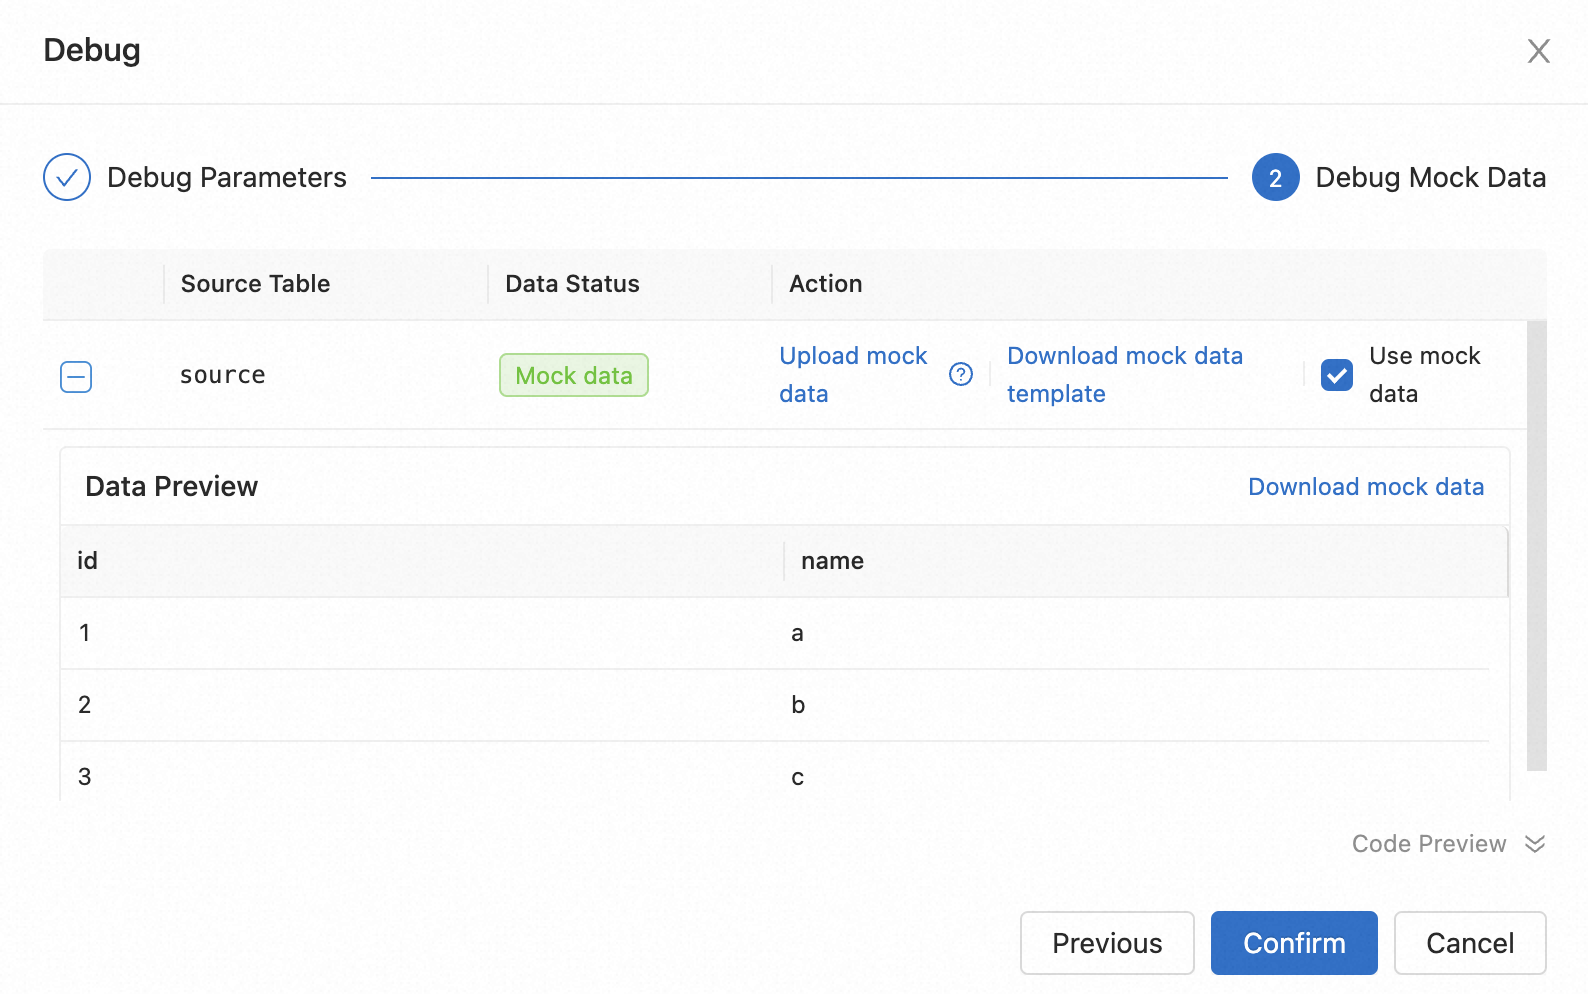
Configure the test data.
If you want to use live data, click OK.
If you want to use test data, click Download Data Template, fill in the template with test data, and then upload the data file.

This topic describes the features on this page.
Parameter
Description
Download data template
To make editing easier, you can download the data template, which is adapted to the data structure of the source table.
Upload test data
To debug using local test data, download the data template, edit the data locally, upload the file, and then select Use Test Data.
The test data file has the following limits:
Only the CSV format is supported for uploaded files.
The CSV file must contain a table header, such as id(INT).
The CSV test data file can be up to 1 MB in size or contain up to 1,000 records.
Data preview
After you upload the test data, click the
 icon to the left of the source table name to preview and download the test data.
Debug code preview
The debugging feature automatically changes the DDL code for the source and sink tables but does not change the actual code in your job. You can preview the code details below.
After you configure the test data, click OK.
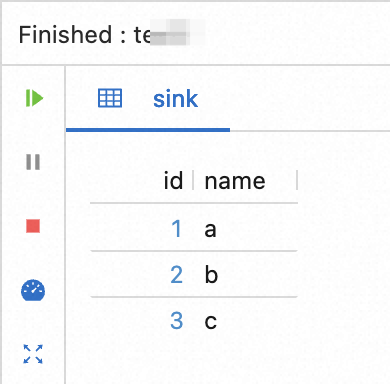
After you click OK, the debug results are displayed below the SQL editor.

Related documents
To deploy a job online after you develop or debug it, see Deploy a job.
After you deploy a job, see Start a job.
For a complete example of the Flink SQL job operational flow, see Quick start for Flink SQL jobs.