This topic describes how to view the details of RDS MySQL slow query logs. It also covers related issues and solutions, including SQL recording rules, truncation issues, time difference causes, and statistical count discrepancies.
Overview
The slow query log feature is enabled by default for RDS MySQL. For more information, see Collection policy for RDS MySQL slow query logs. To view other types of logs, see View error logs and slow query logs.
Considerations
If more than 600 slow query logs are generated within one minute in an instance, some slow query logs might be lost. You can upgrade the minor engine version to 20191212 or later to reduce this issue.
If the length of an SQL statement exceeds 8,192 bytes, the complete SQL content cannot be recorded in the slow SQL log. Additionally, SQL Explorer logs cannot record the complete SQL statement. The current SQL truncation length limit (8,192 bytes) cannot be adjusted. If you need to identify the complete SQL content, we recommend that you locate the complete SQL request content from the application side.
Query through the Slow SQL page
Log on to the ApsaraDB RDS console and go to the Instances page. In the top navigation bar, select the region in which the RDS instance resides. Then, find the RDS instance and click the instance ID.
In the left-side navigation pane, choose .
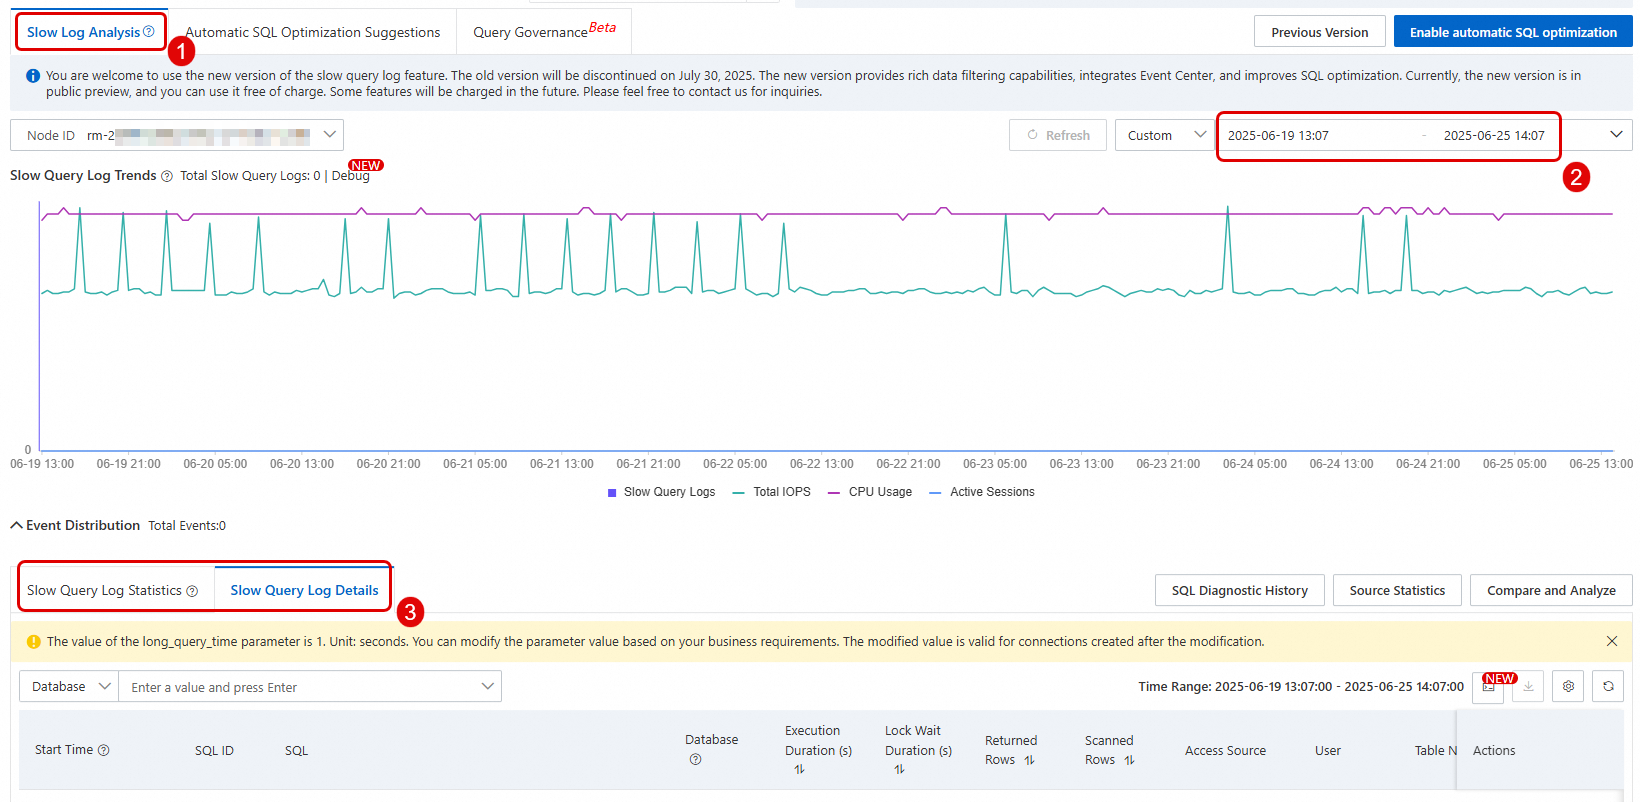
On the Slow Log Analysis tab, select the time range you want to view, and you can see the corresponding slow log statistics and slow log details.
NoteYou can also visit the Logs page of the RDS instance details page, and view the slow log details on the Slow Log Details tab.
 Important
The slow log details include information such as SQL statement, access source, database, and execution time. In earlier versions, the slow log collection time was recorded as the SQL execution end time. Since versions 20211231 (5.7.35) and 20220530 (8.0.25), this time has been recorded as the SQL execution start time.
If you need to export slow log details, see Slow Log Analysis.