Performance diagnosis is a key tool for analyzing and optimizing performance. The performance diagnosis feature can help you identify and resolve performance issues in reports and data analysis operations, improve report query speed and response performance, and enhance the efficiency and accuracy of your data analysis.
Limits
The dashboard, workbook, and data dashboard modules support performance diagnostics.
Prerequisites
You have created a dashboard, workbook, or data dashboard.
You have selected the target dataset and configured the chart fields.
Entry points
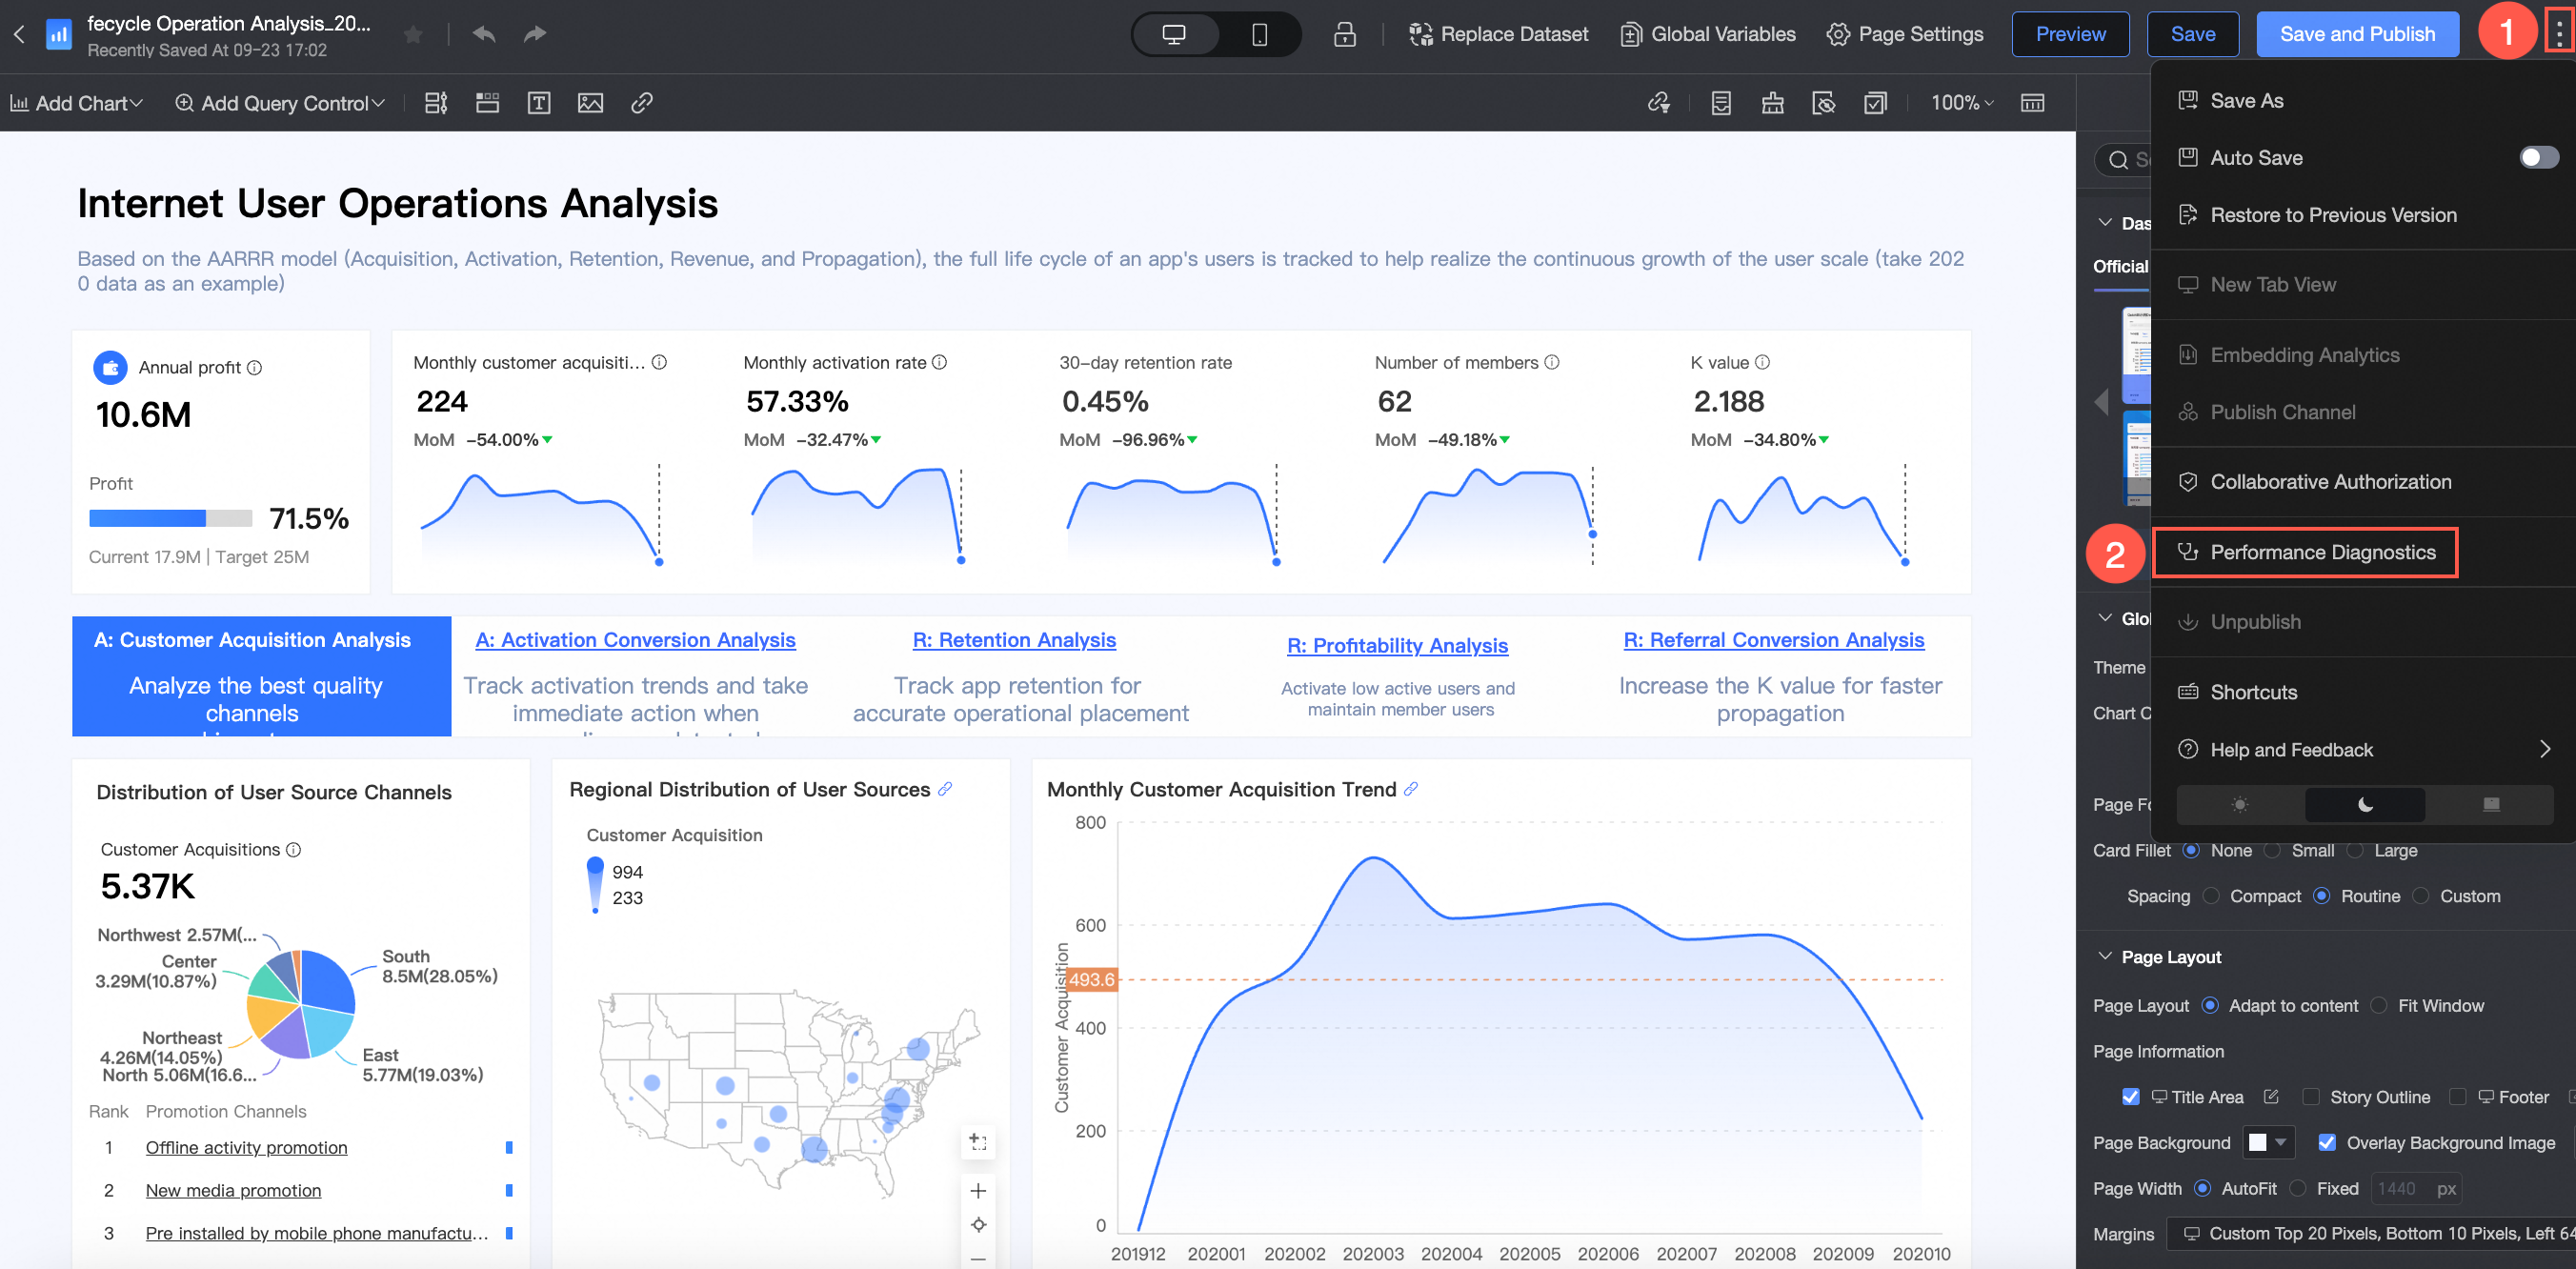
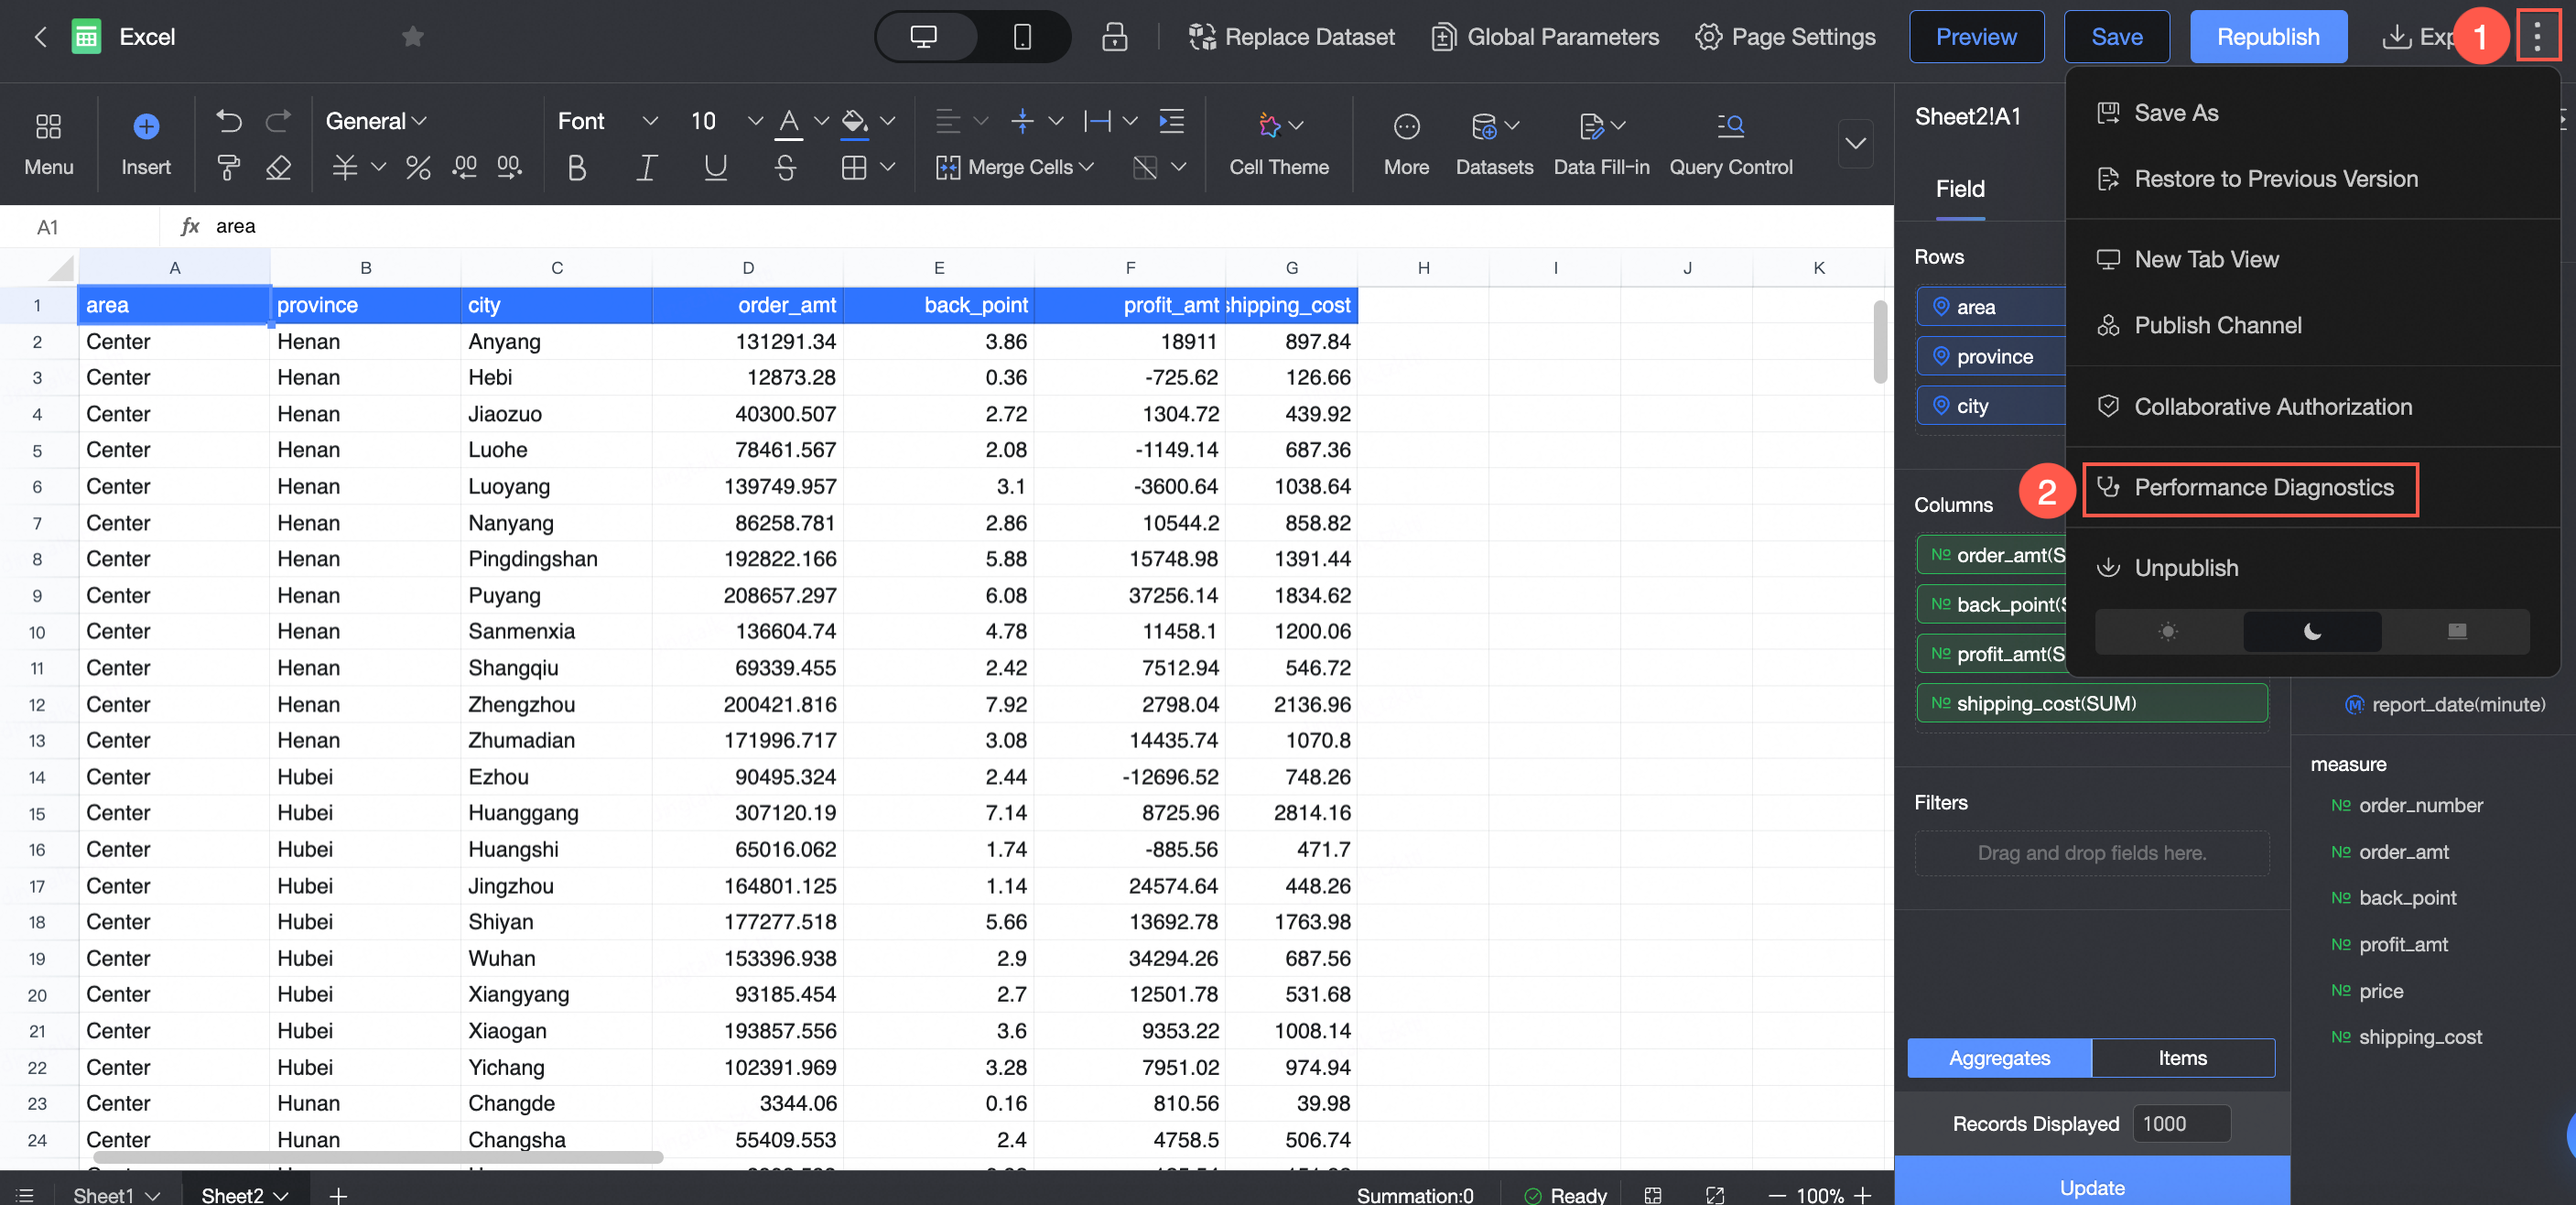
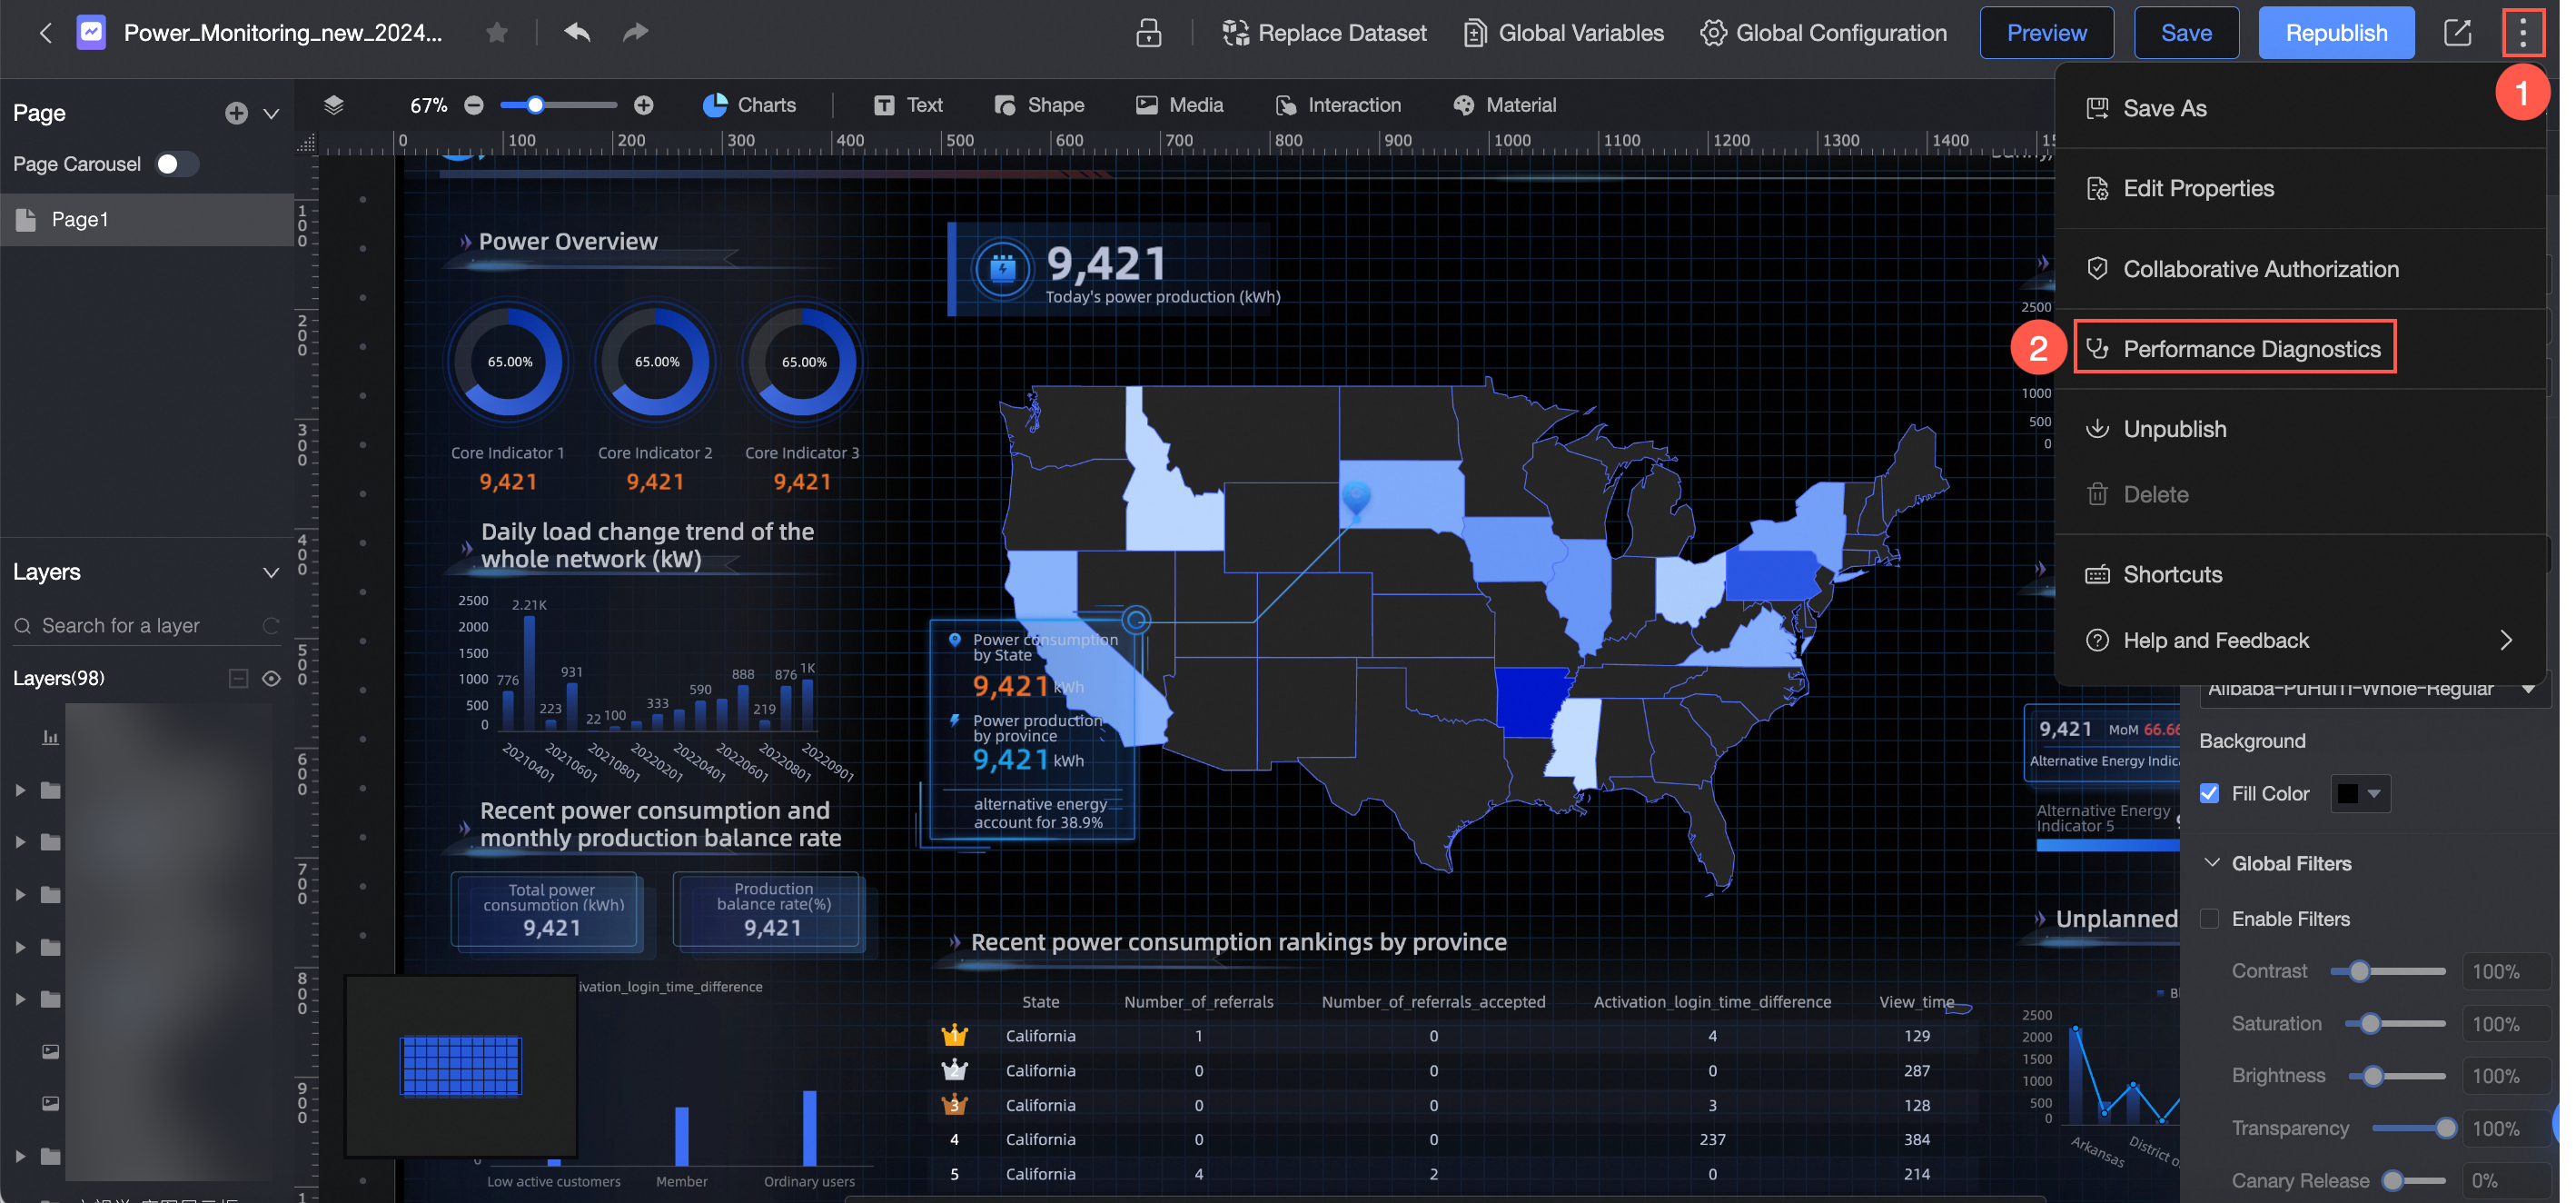
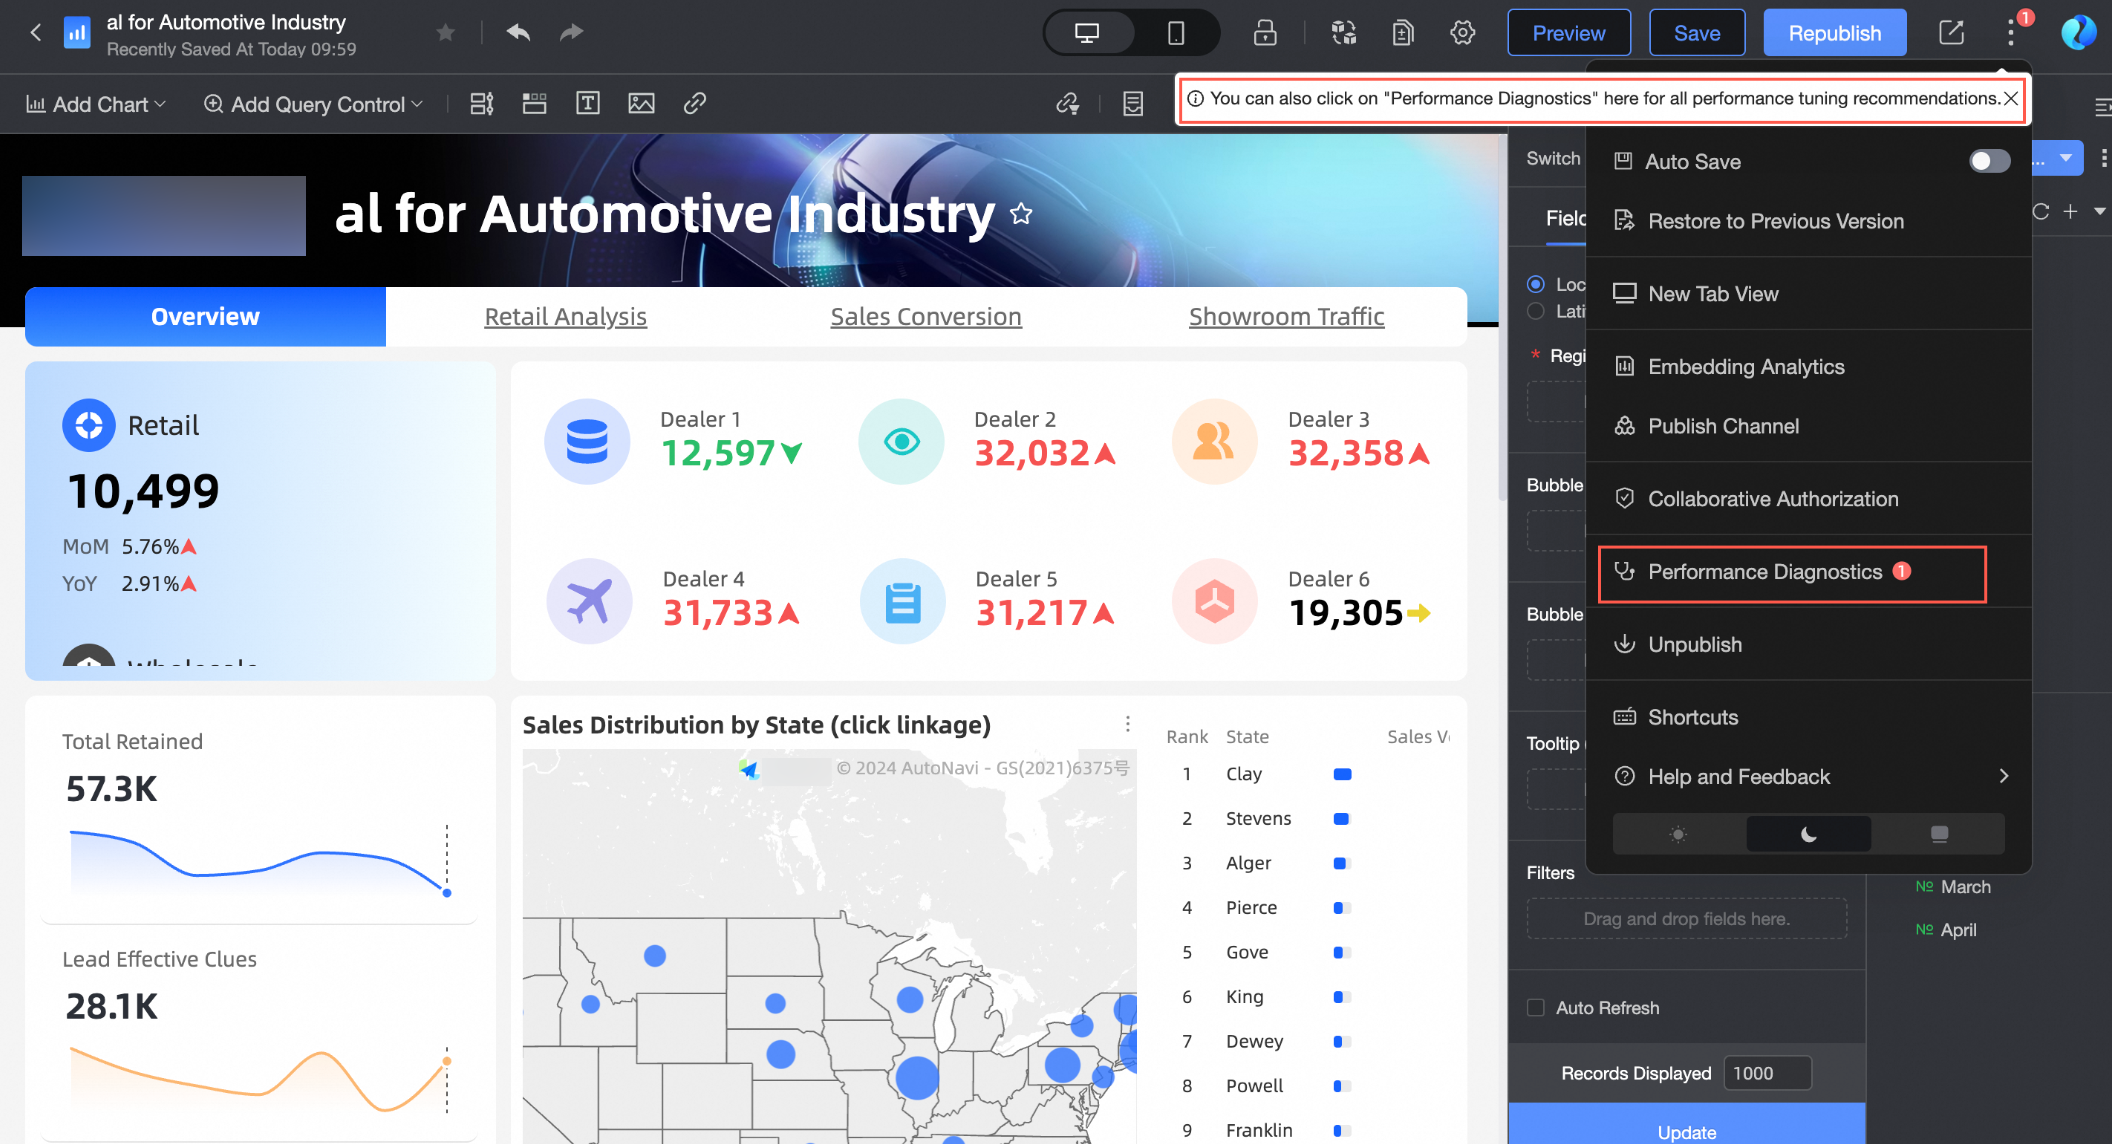
You can access the performance diagnostics interface for dashboards, workbooks, and data dashboards by following the steps illustrated below.
Dashboard performance diagnostics entry.
Workbook performance diagnostics entry
Data dashboard performance diagnostics entry
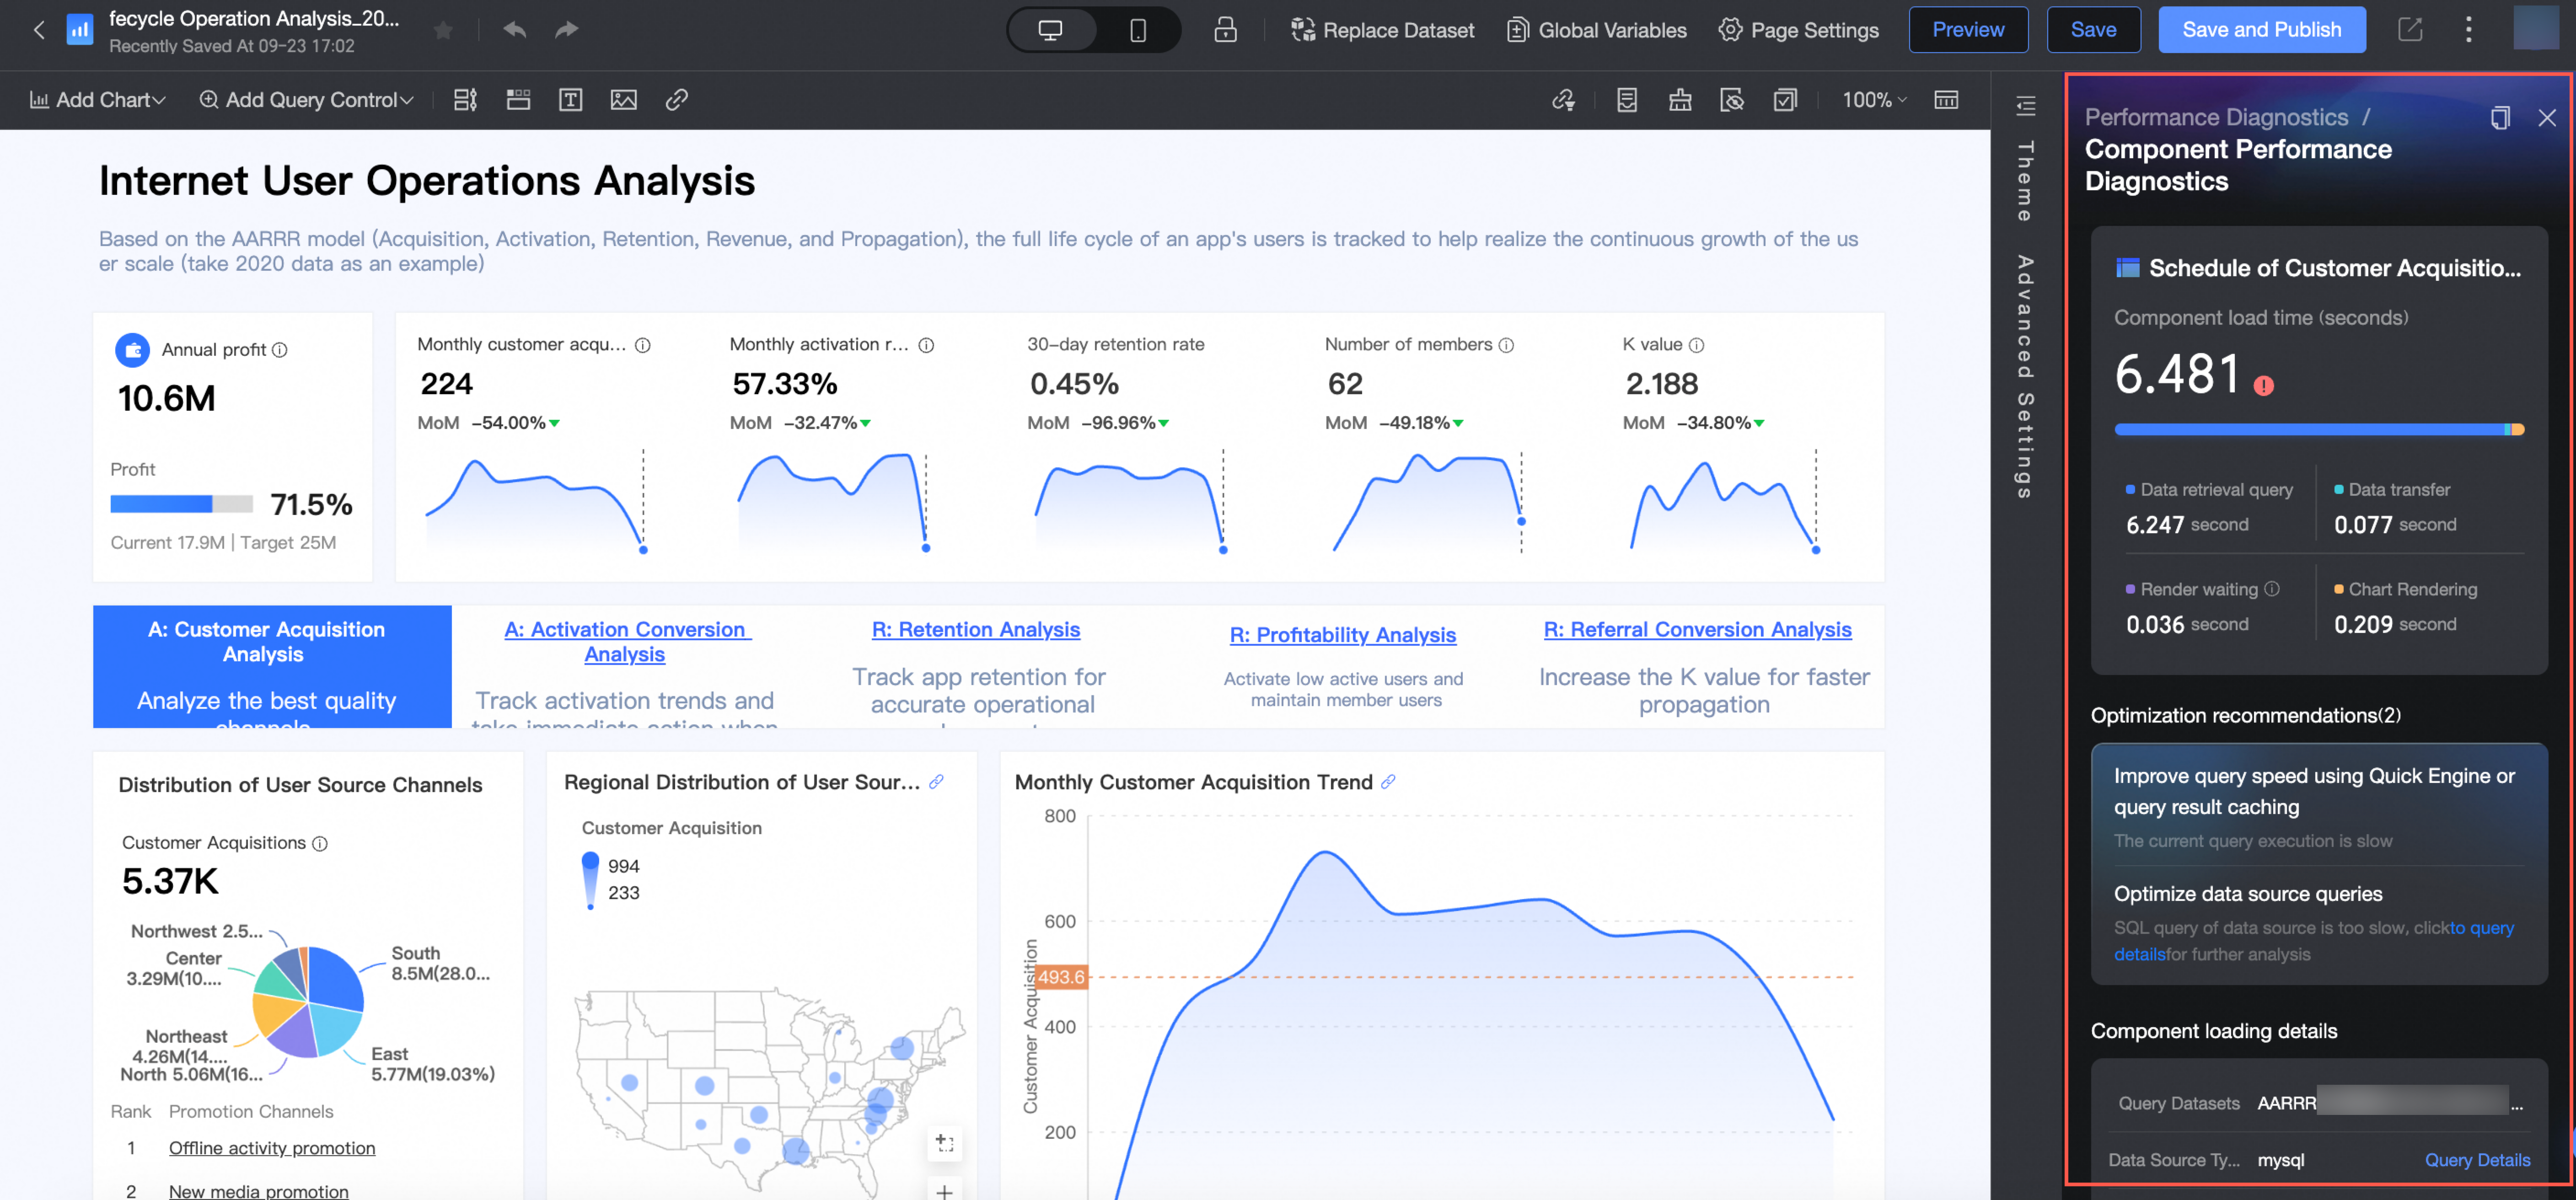
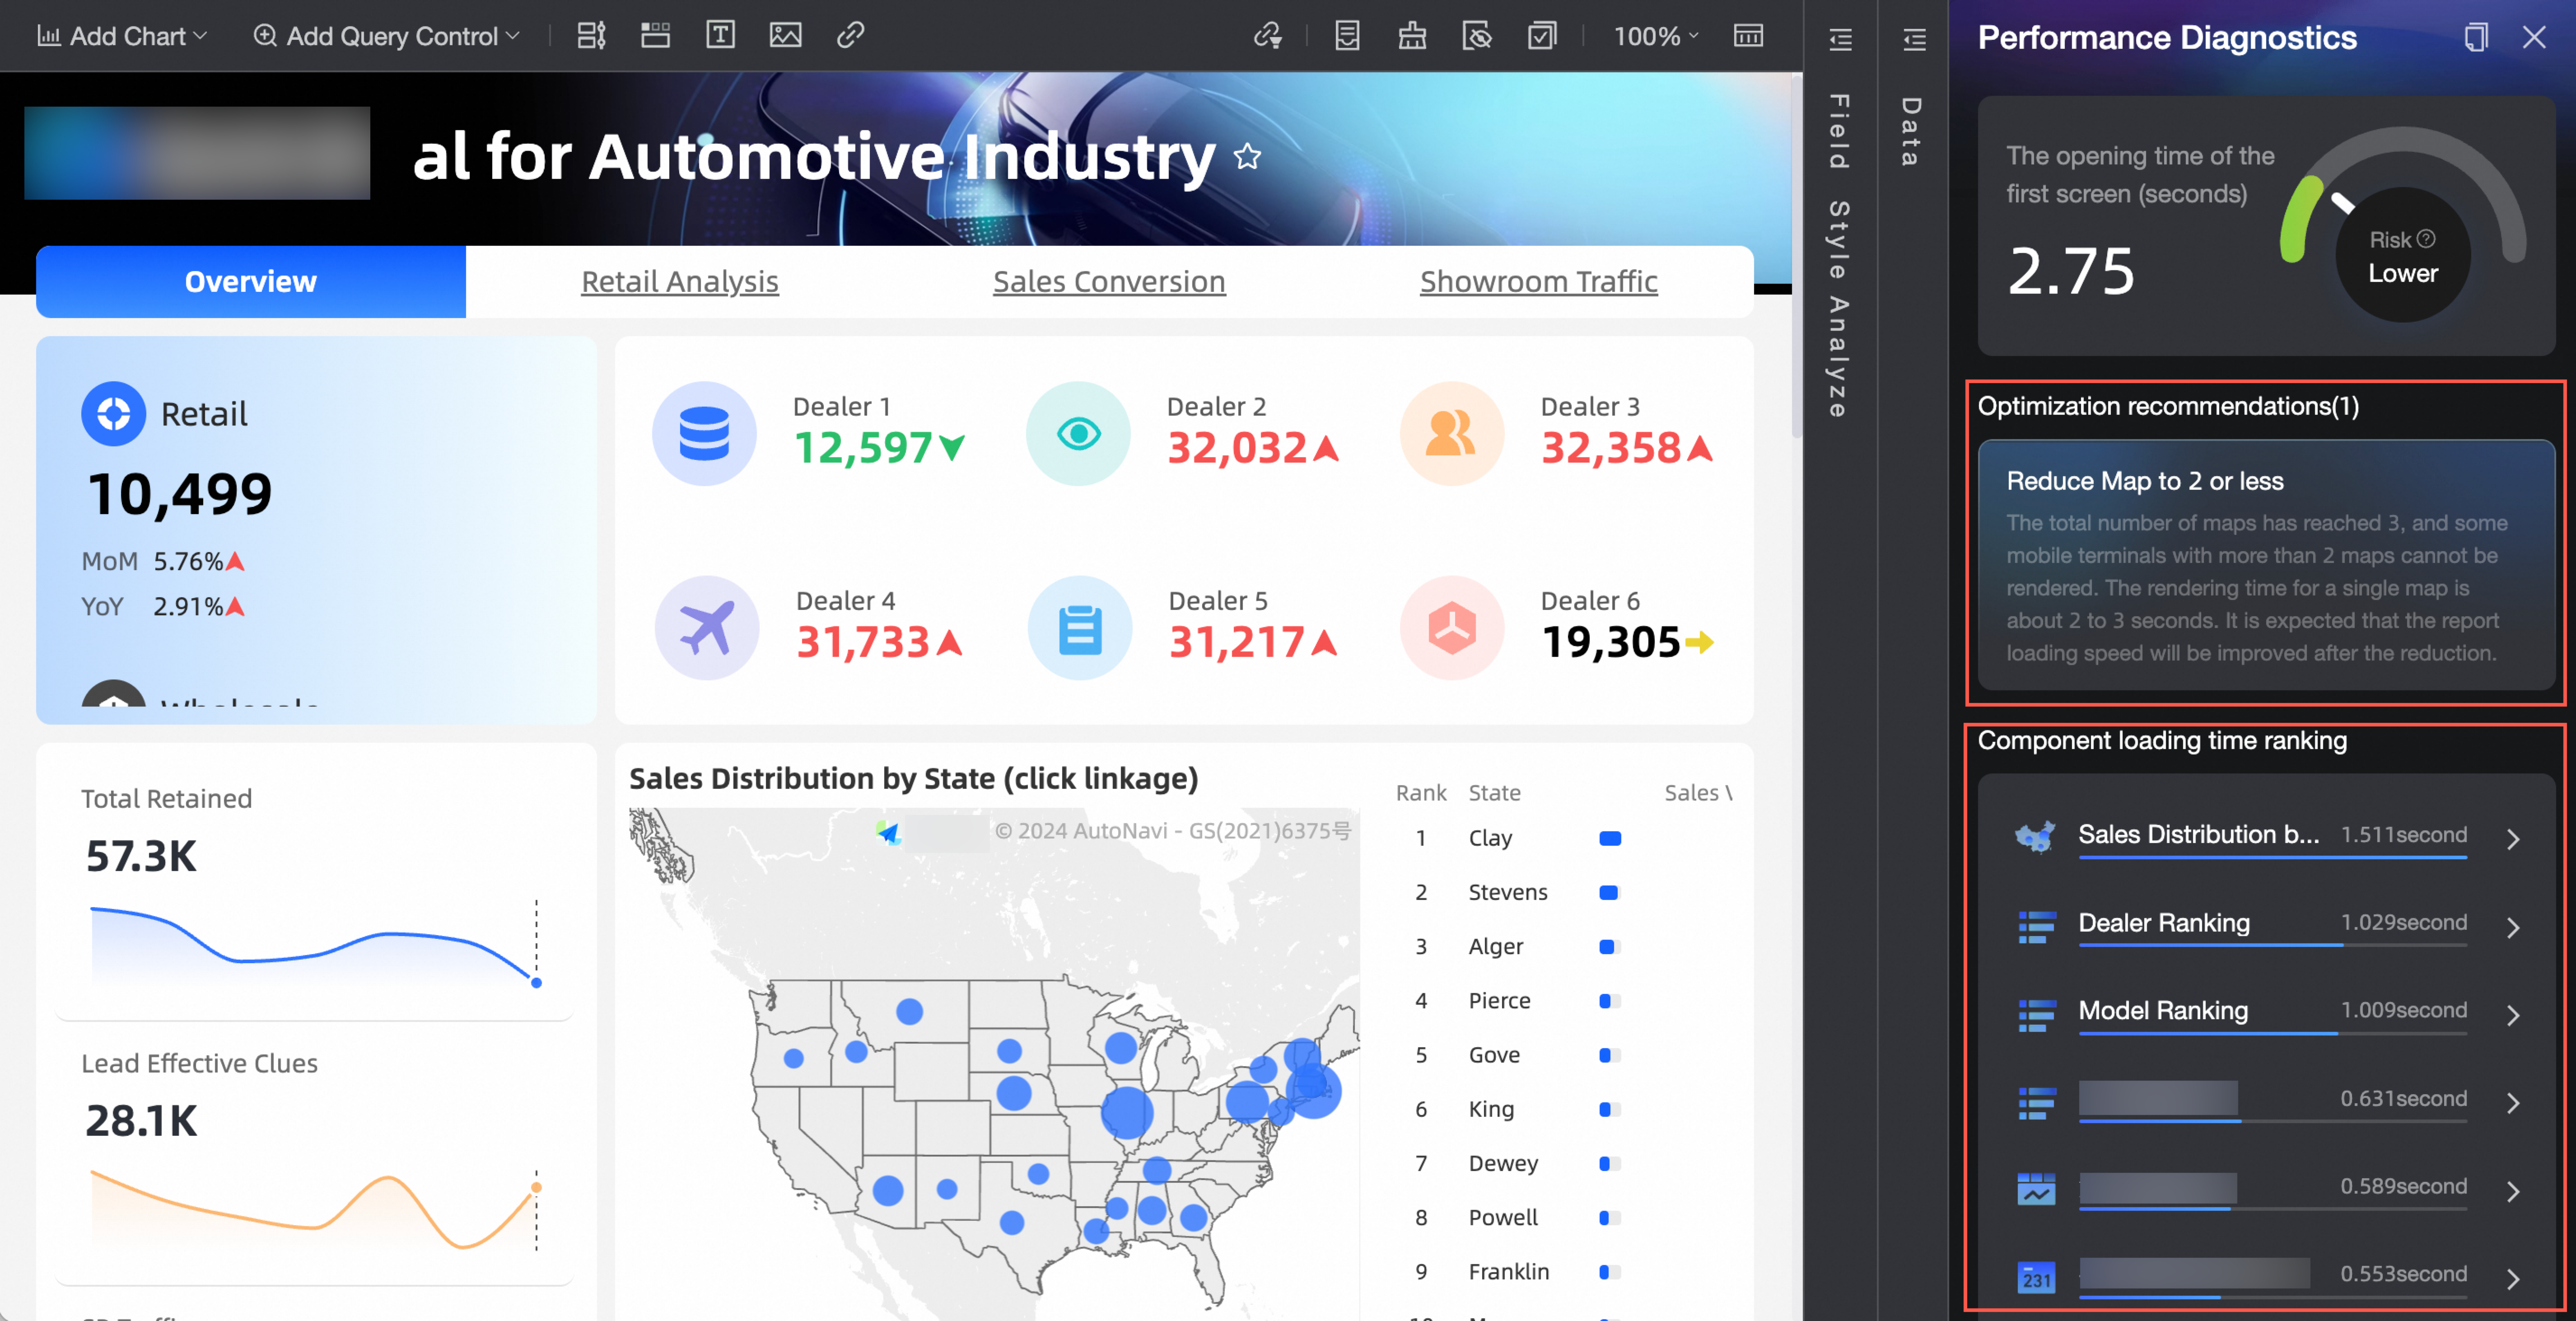
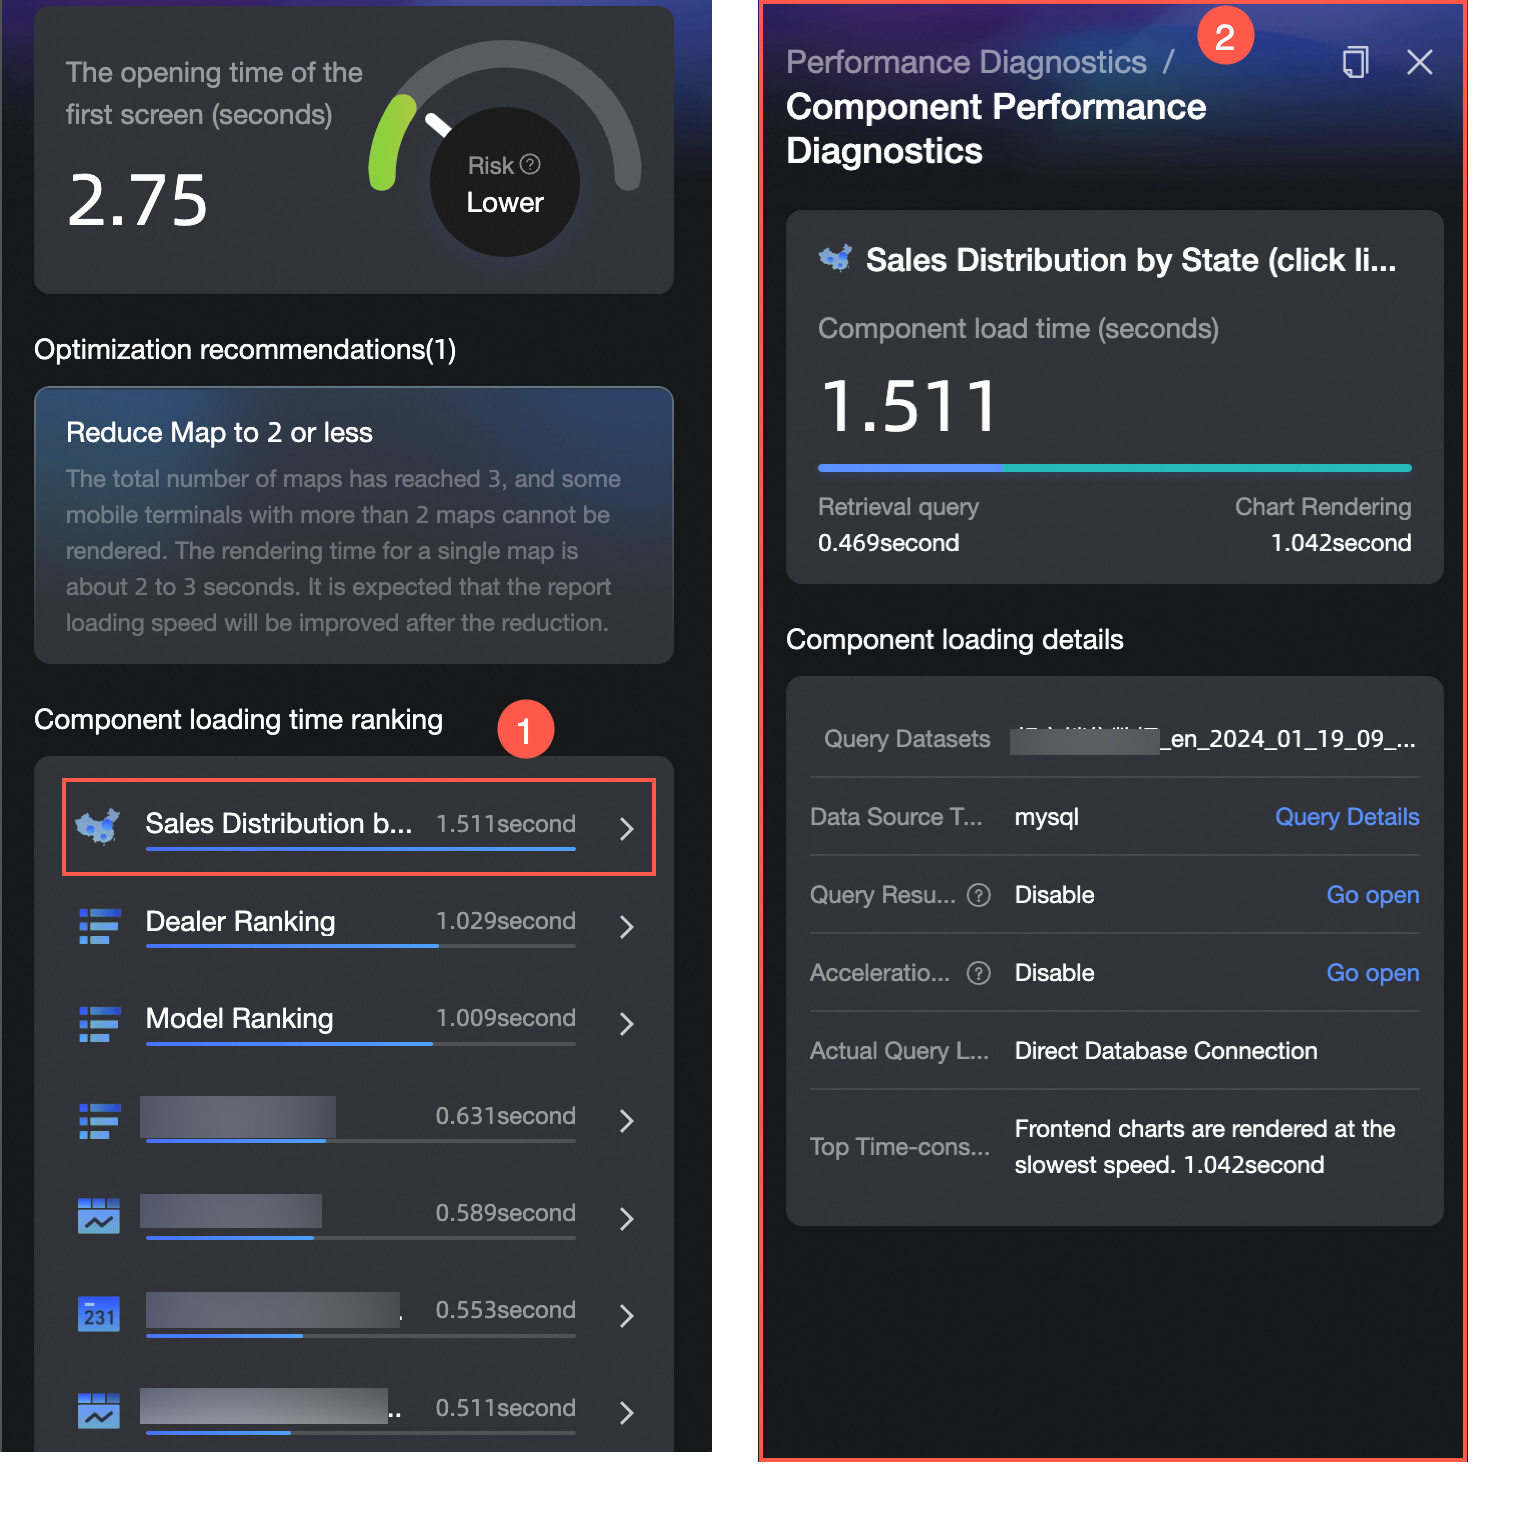
The performance diagnostics interface displays the report's estimated first screen opening duration, risk assessment level, and component loading duration ranking.
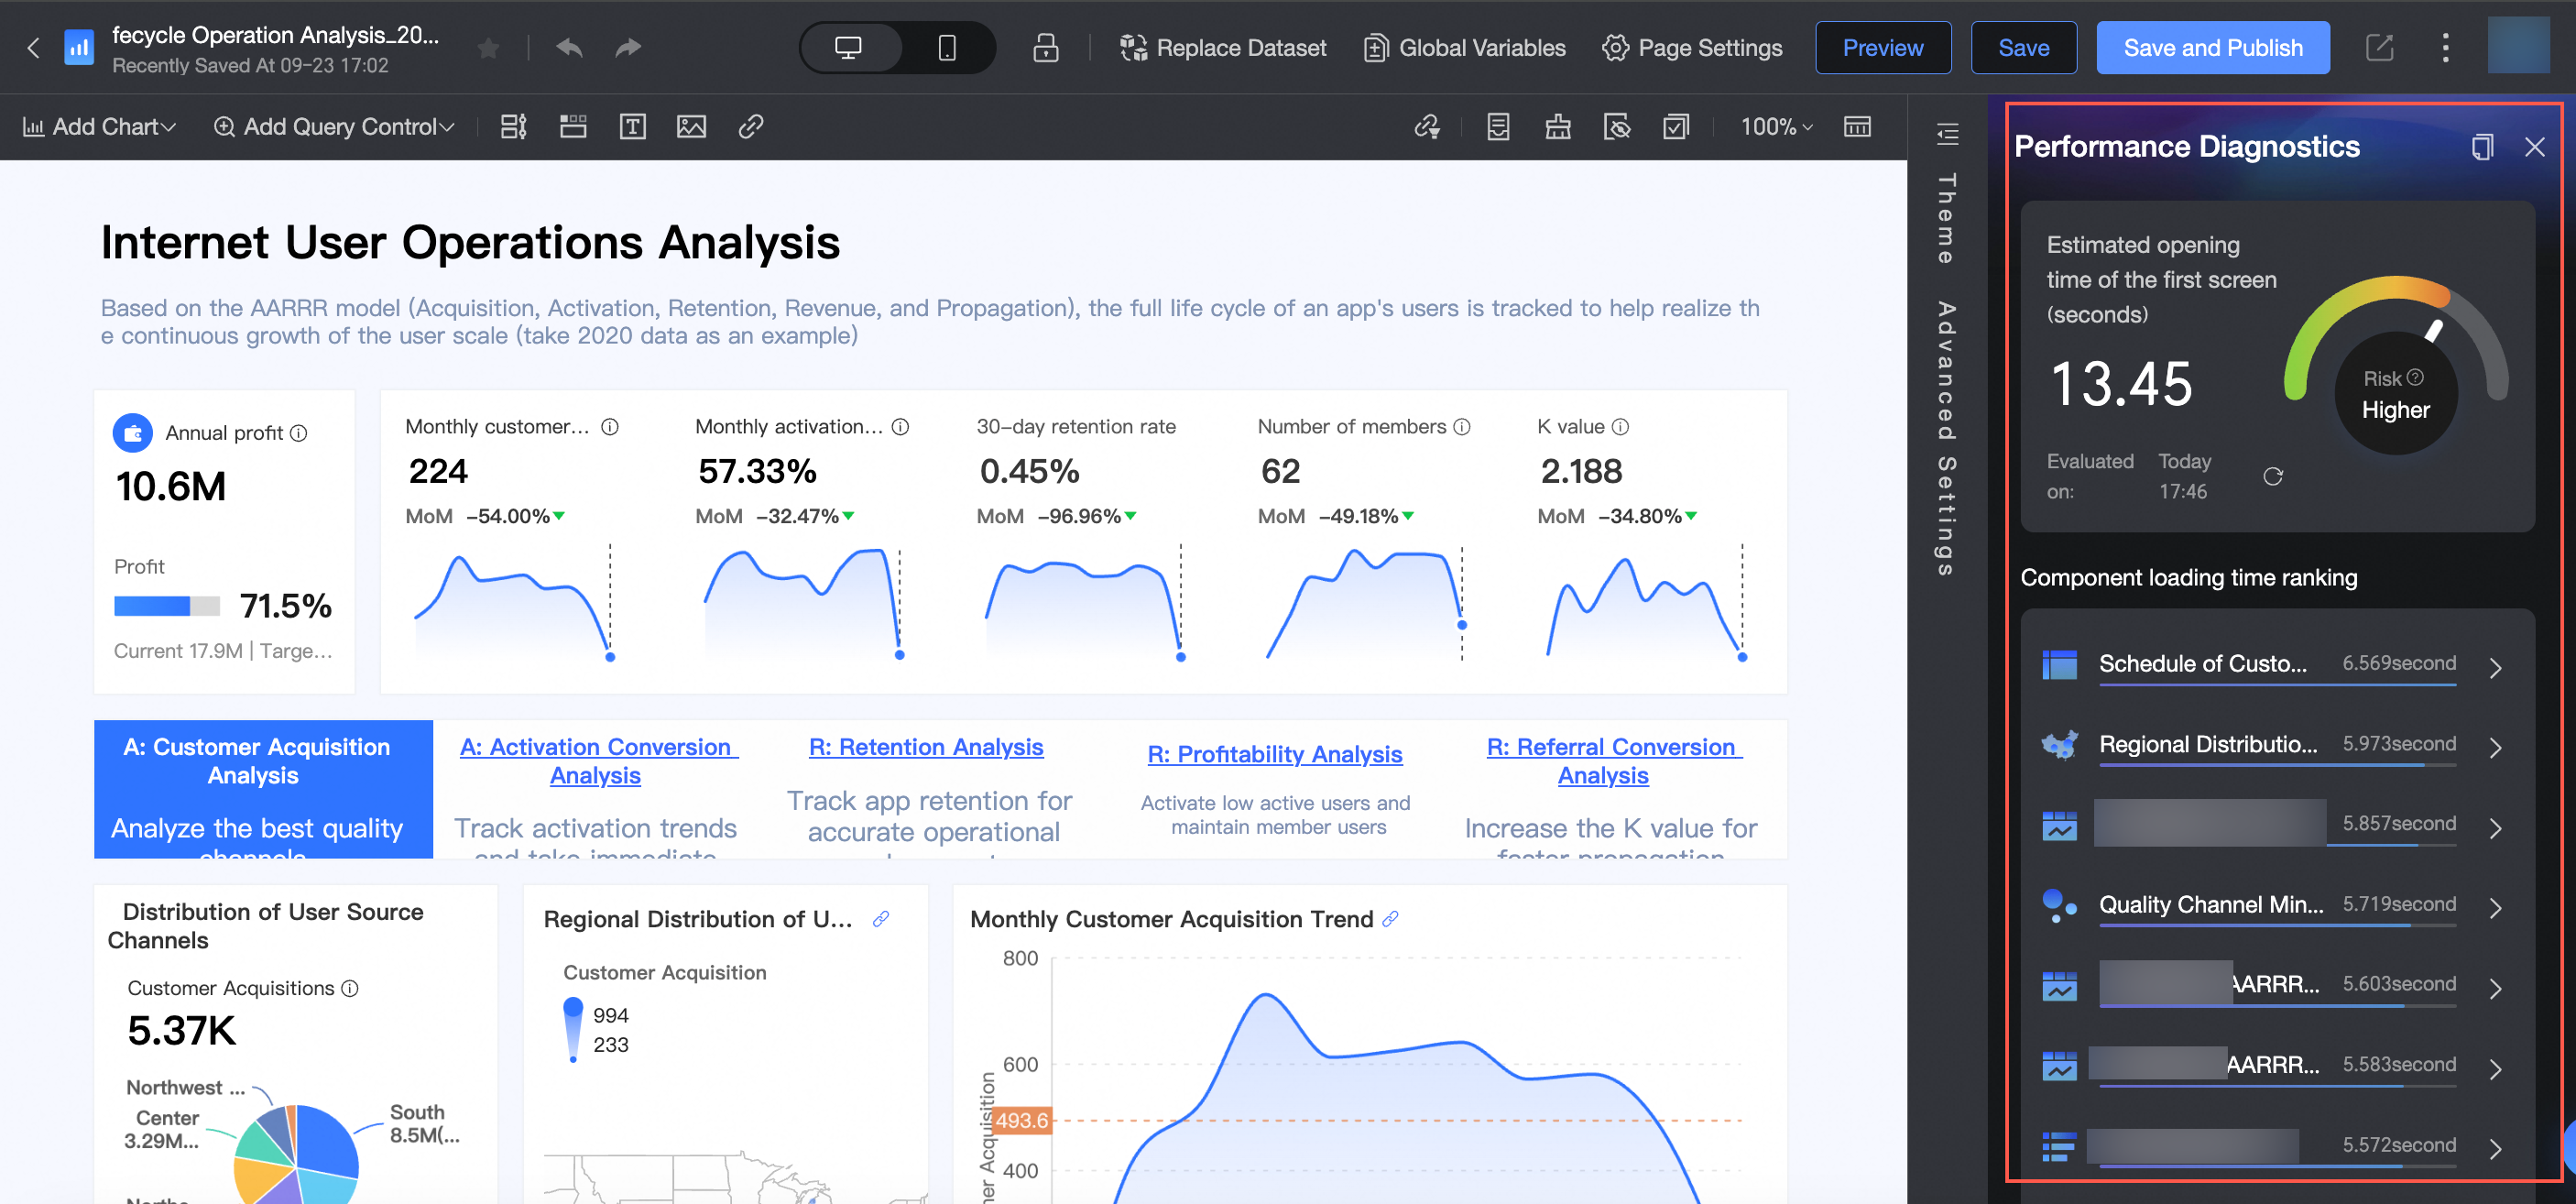
To delve into a specific chart's performance, click on it in the component loading duration ranking to access the component performance diagnostics page.
The dashboard allows access to the component performance diagnostics interface for individual components. By clicking the
 icon located to the right of the chart, you can follow the depicted steps to reach the component performance diagnostics interface tailored to that particular chart.
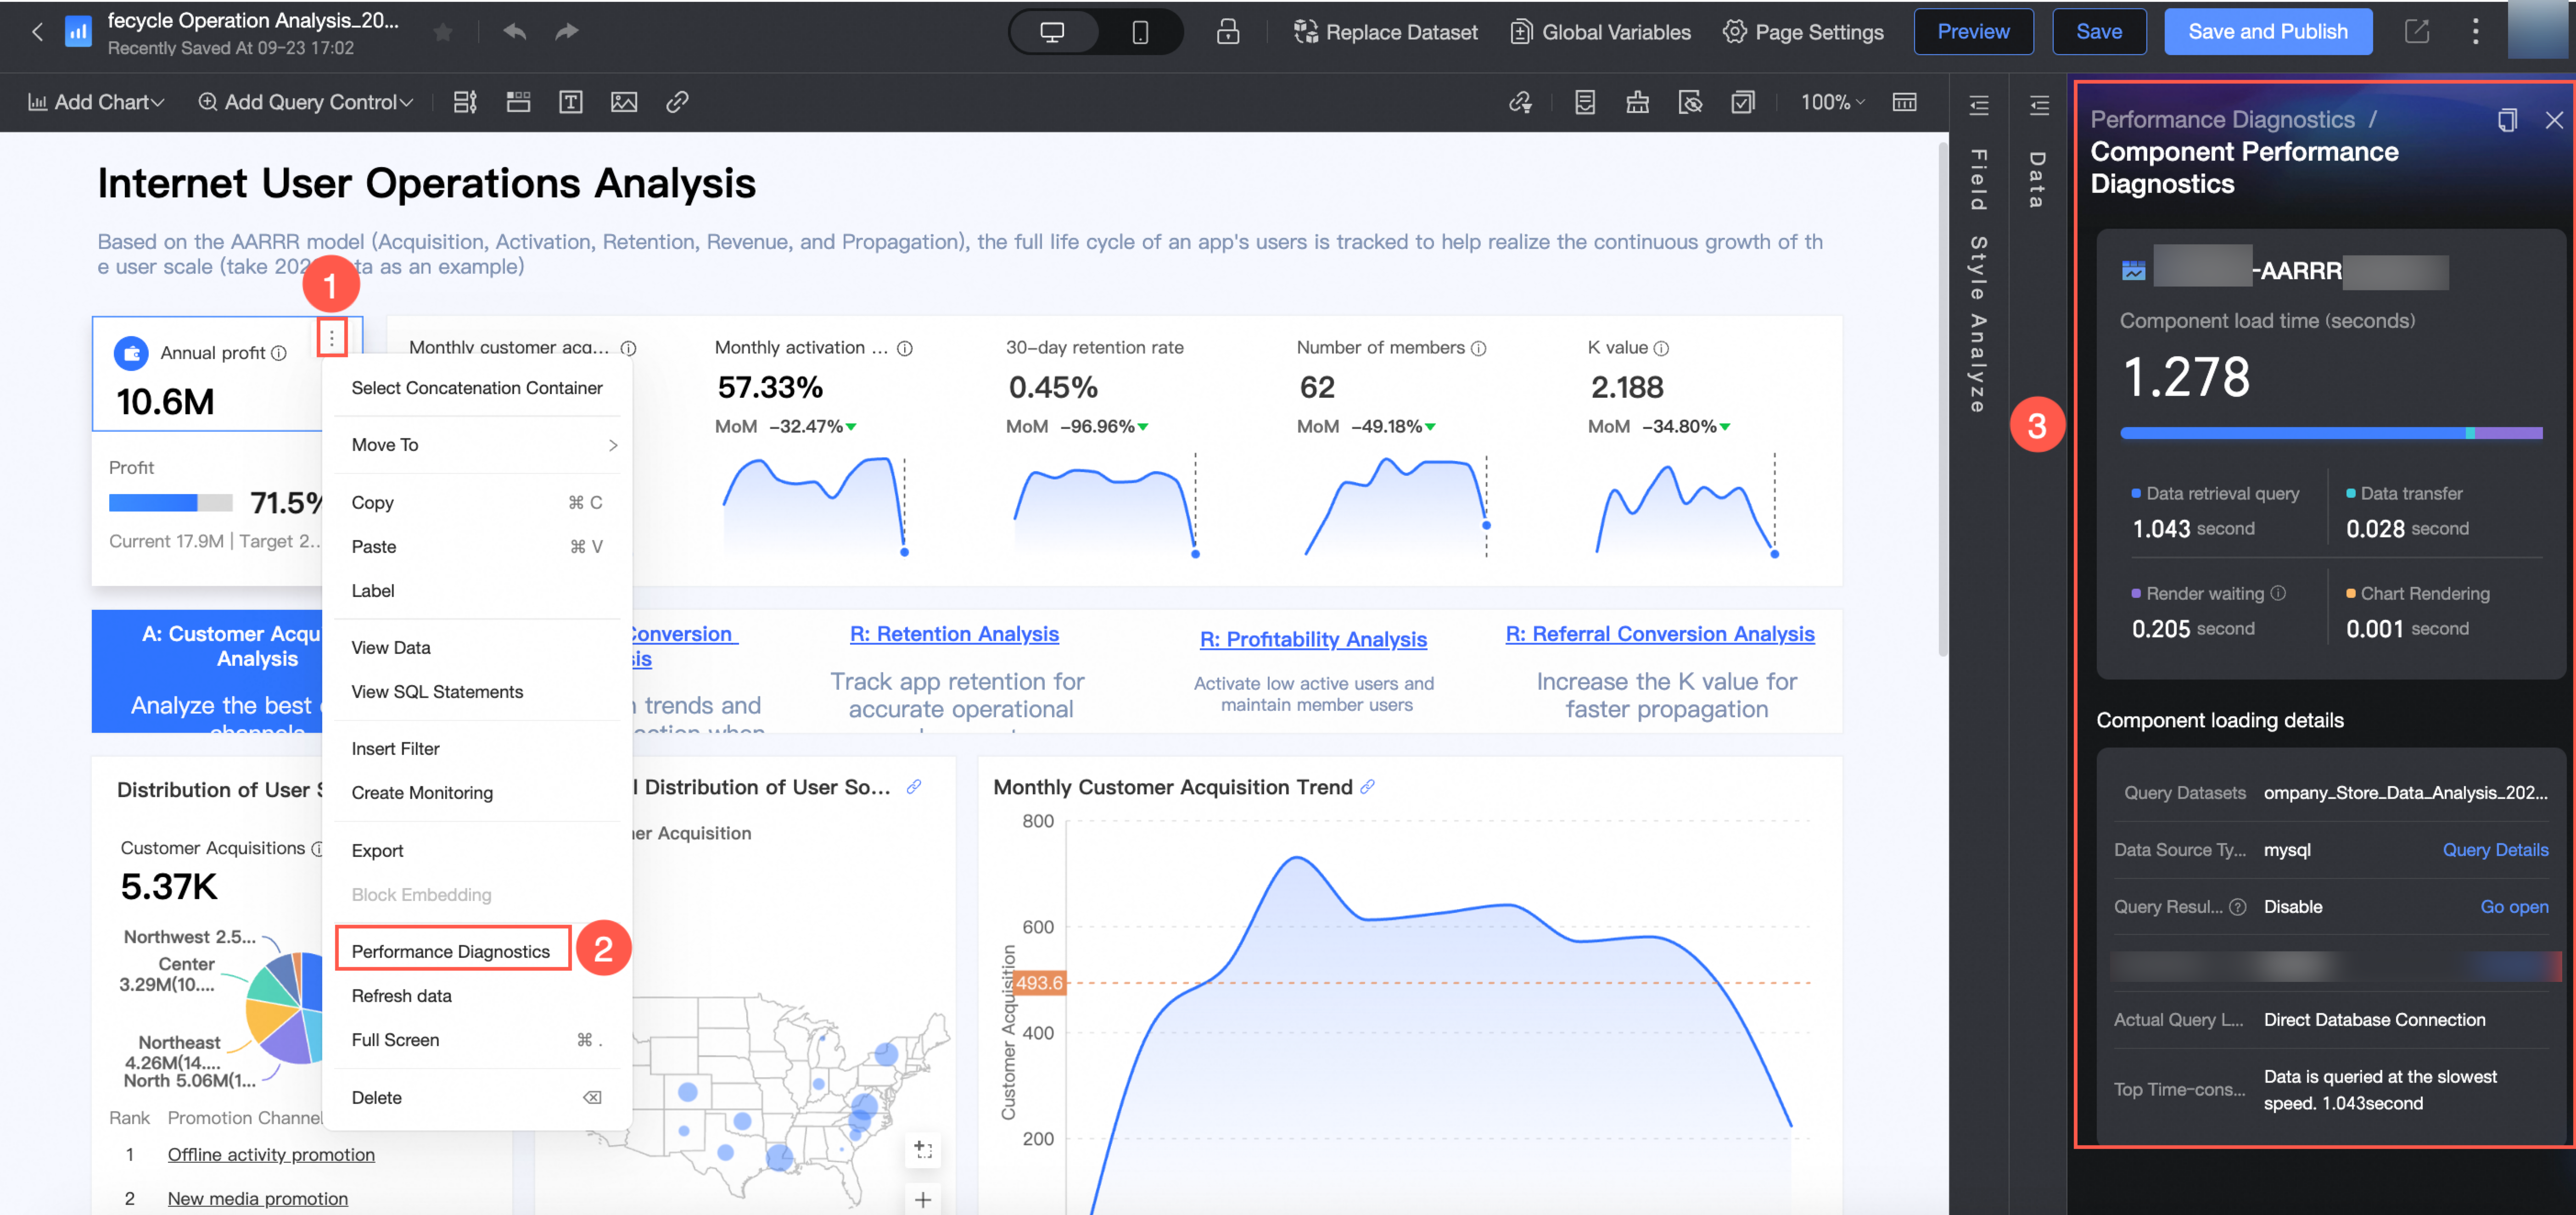
Functionality
Estimated first screen opening duration denotes the time it takes to open and display the initial view of the report. You can evaluate the report's performance risk by considering both the estimated first screen opening duration and the risk benchmark assessment value.
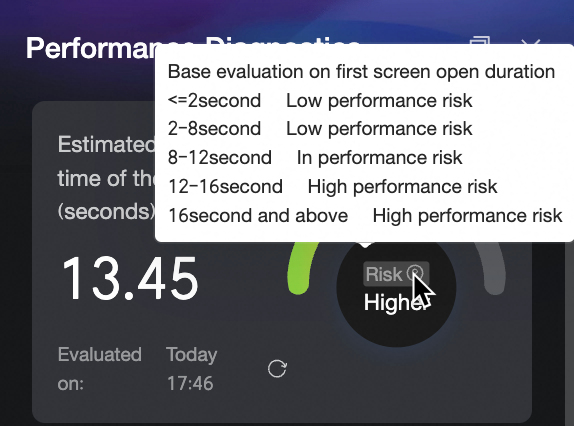
To reassess, click the
 icon next to the assessment time.
If the report contains elements that may impact performance, performance diagnostics will offer targeted optimization suggestions. Following these recommendations can lead to improved report loading speeds. The component loading duration ranking lists the load times of report components, allowing you to prioritize optimization efforts on slower-loading charts.
Clicking on a chart in the component loading duration ranking takes you to the component loading details page.
Parameter name
Parameter description
Query dataset
The name of the dataset used by the current component.
Data source type
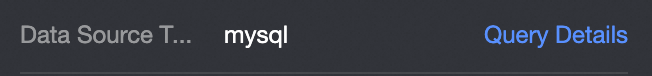
The type of data source used by the current component, such as MySQL.
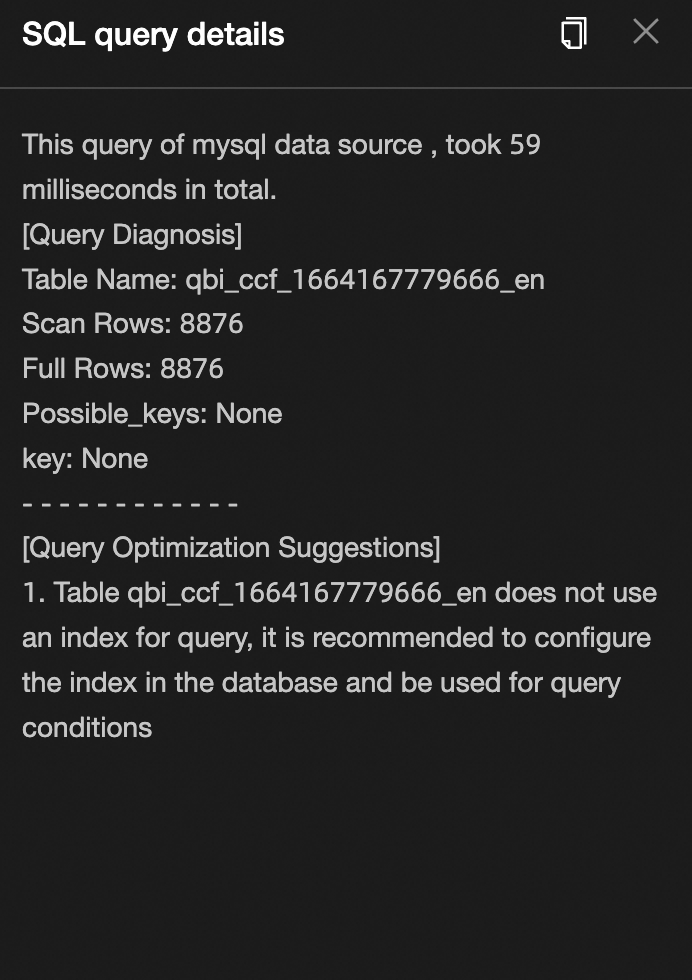
After clicking query details, you can see information such as data source time consumption, query diagnosis, and query optimization suggestions.
Query result cache
Query cache: The dataset caching mechanism can accelerate report access and reduce database pressure.
If it is not enabled, the option "Enable" will appear as shown in the figure below.

For configuration methods, you can refer to the query cache documentation in Configure Quick engine.
Quick engine
Quick engine: Periodically extracts data into the Quick engine for high-speed data queries.
If it is not enabled, the option "Enable" will appear as shown in the figure below.

For acceleration configuration, you can refer to Configure Quick engine.
Actual query route
The actual query route for component data, such as direct connection to the database.

If Quick engine is enabled but the actual query route is a direct database connection, you can check the reasons for no acceleration.
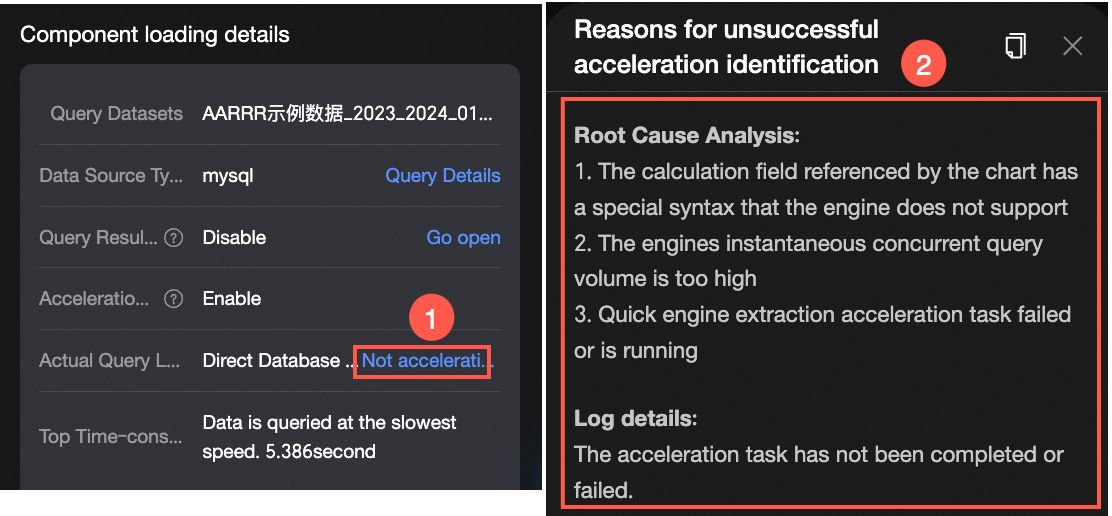
Top time-consuming route
The most time-consuming segment of the data query and data processing process and its corresponding duration, such as:

Specifications suggestions
During dashboard editing, if you perform actions that could degrade report performance, such as adding an excessive number of charts or tab components, performance diagnosis will issue a warning, and the entry point will indicate the number of potential risk items.
An error message will appear if you create too many components within a module, as illustrated below:
 Additionally, optimization suggestions will be provided in the performance diagnostics list.
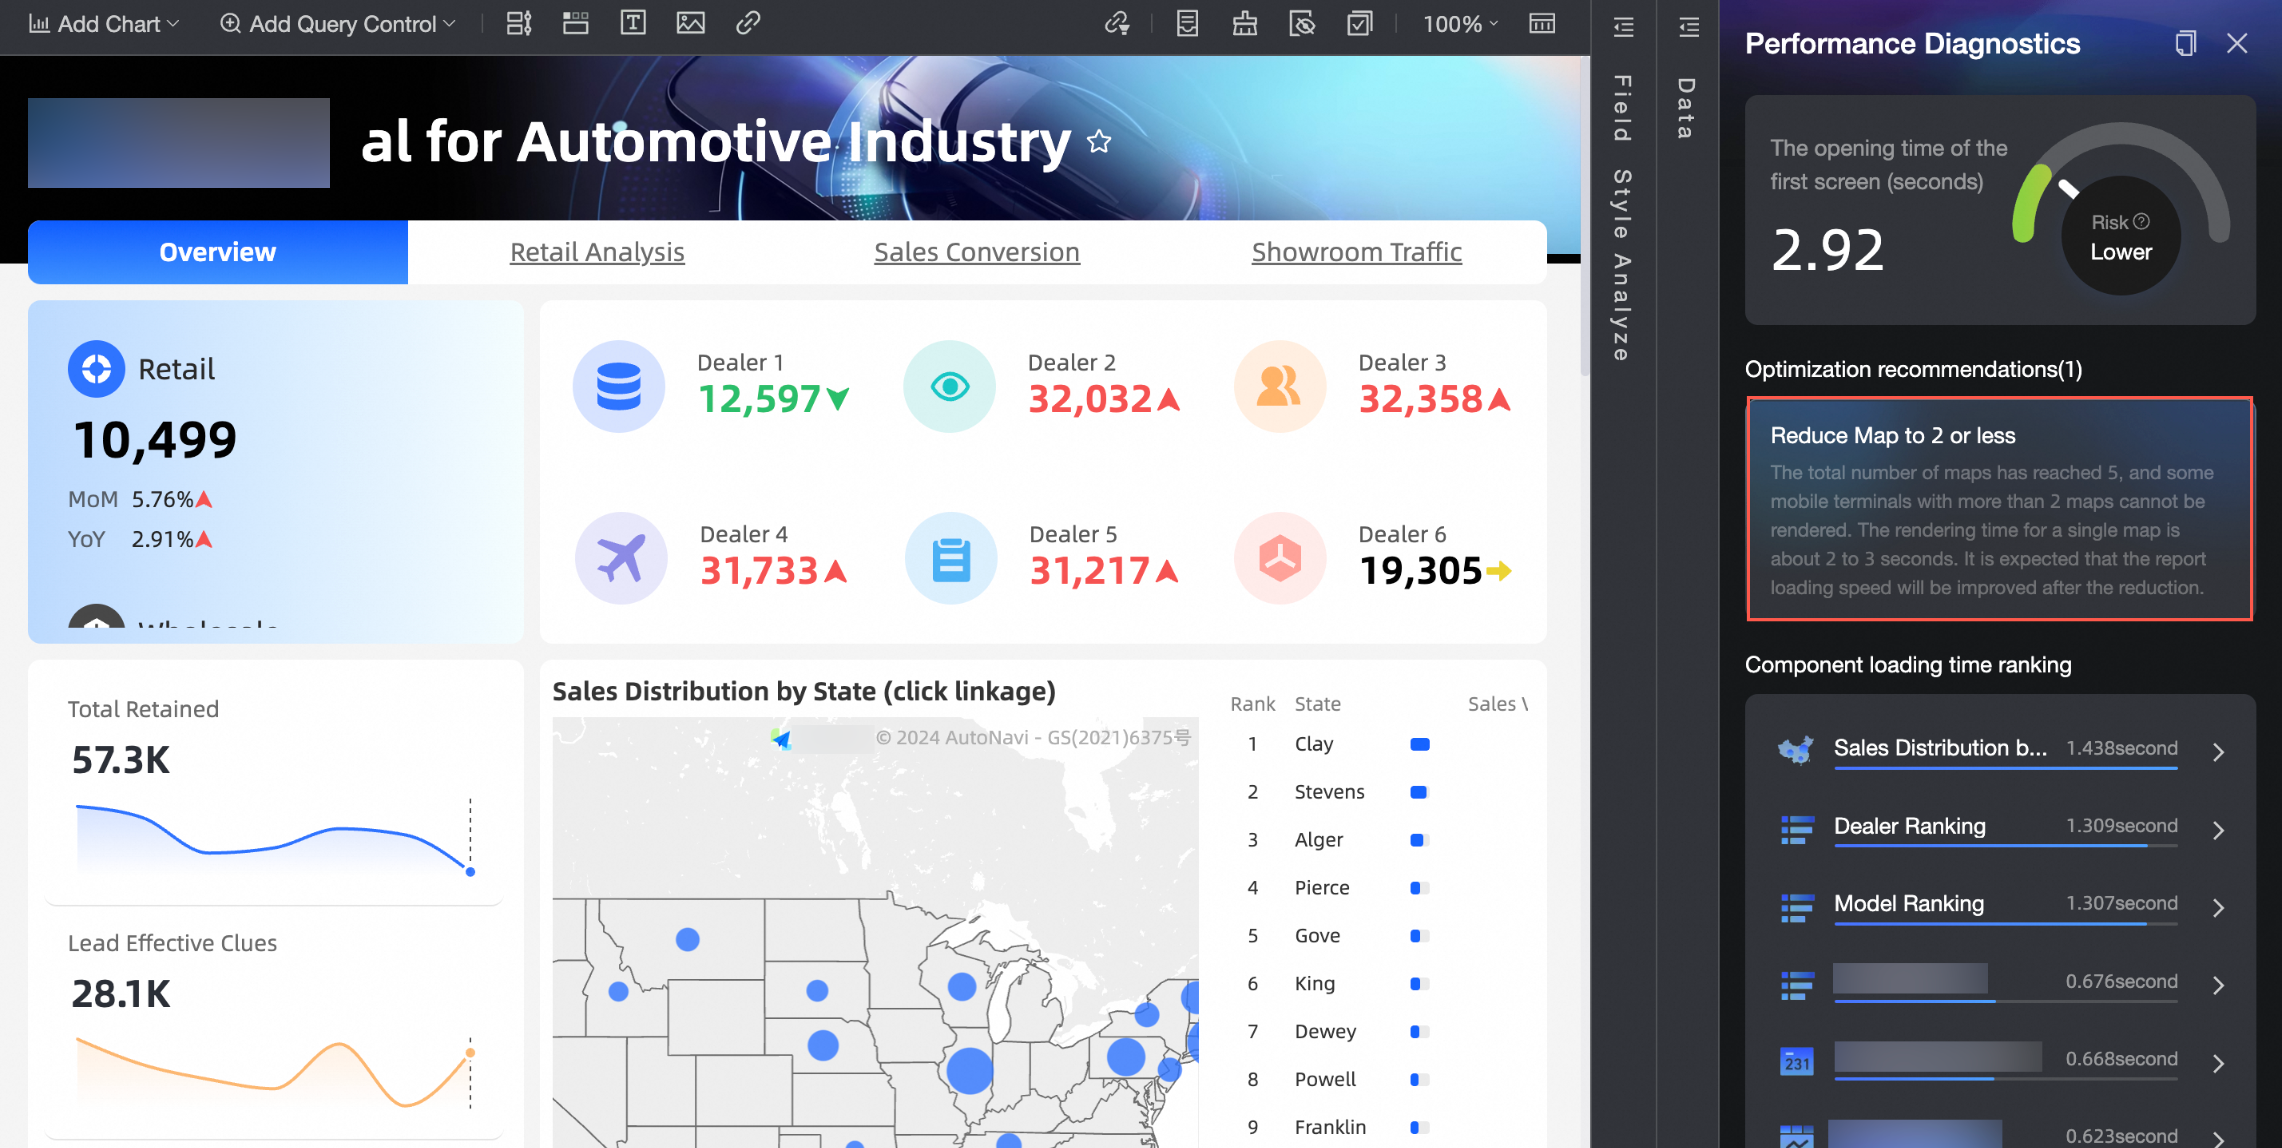
To maintain report performance and ensure smooth operation, adhere to the recommended specifications when constructing reports.
Module
Content
Specification suggestion value
Dashboard
Chart
The number of charts and controls should be less than 100.
Map
The number of maps should be less than 2.
Tab label
The number of tab labels should be less than 50.
Cross table field
The number of cross table fields should be less than 100.
Detail table field
The number of detail table fields should be less than 100.
Indicator trend chart field
The number of indicator trend charts should be less than 100.
iframe
The number of embedded pages should be less than 5.
Query control
The number of query control elements should be less than 100.
Workbook
Sheet
The number of sheets should be less than 100.
Chart
The number of charts per sheet should be less than 20.
The total number of charts should be less than 100.
Floating image
The number of floating charts per sheet should be less than 50.
Dataset
The number of datasets per sheet should be less than 50.
Data dashboard
Page
The number of pages should be less than 5.
Chart
The number of charts per page should be less than 100.
iframe
The number of embedded pages should be less than 5.