This topic explains how to configure cumulative calculation by date for a measure.
Prerequisites
You have created a dashboard. For more information, see Create a Dashboard.
You have selected a target dataset and configured chart fields. For more information, see Configure Chart Fields.
Background information
Cumulative calculation by date sums data from the initial date to the current date.
The cumulative calculation by date supports the following scenarios:
Correspondence between date fields and cumulative calculation by date
Date Field Type | Example | Cumulative Calculation by Date |
Year granularity field (fields in yyyy format) | shipping_date(year) |
|
Quarter granularity field (fields in yyyyqq format) | shipping_date(quarter) |
Note When a dataset is configured with a fiscal year and the date field is a fiscal year field, quarter granularity supports fiscal year cumulative but does not support current year cumulative. |
Month granularity field (fields in yyyymm format) | shipping_date(month) |
Note When a dataset is configured with a fiscal year and the date field is a fiscal year field, month granularity supports fiscal year cumulative and fiscal quarter cumulative. |
Week granularity field (fields in yyyy-ww format) | shipping_date(week) |
|
Day granularity field (fields in yyyymmdd format) | shipping_date(day) |
Note When a dataset is configured with a fiscal year and the date field is a fiscal year field, day granularity supports fiscal year cumulative and fiscal quarter cumulative. |
Hour (fields in hh format), minute (fields in hh:mm format), second (fields in hh:mm:ss format), year-month-day-hour-minute-second (fields in yyyymmdd hh:mm:ss format) | shipping_date(hour), shipping_date(minute), shipping_date(second), shipping_date(ymdhms) | Configuration of cumulative calculation by date is not supported. |
Limits
The Year-on-year And Month-on-month feature is not configured on the measure field.
Only fields with sum metrics (
 ) support configuration of cumulative calculation by date.
If the date field on the dimension field is hour (fields in hh format), minute (fields in hh:mm format), second (fields in hh:mm:ss format), or year-month-day-hour-minute-second (fields in yyyymmdd hh:mm:ss format), configuration of cumulative calculation by date is not supported.
If there is no date field on the dimension, configuration of cumulative calculation by date is not supported.
Example of configuring cumulative calculation by date
One date field in dimensions
Dimensions contain a date field (day granularity)
Dimensions contain a date field (month granularity)
Dimensions contain a date field (quarter granularity)
Dimensions contain a date field (year granularity)
Multiple date fields in dimensions
Dimensions contain a date field (day granularity)
The example below demonstrates how to set up cumulative calculations by date using a cross table.
On the dashboard editing page, go to the Fields tab to add fields.
Locate Shipping_date(day) in the Dimensions list and either double-click or drag it to the Rows area.
In the Measures list, find Order Amount and double-click or drag it to the Columns area.
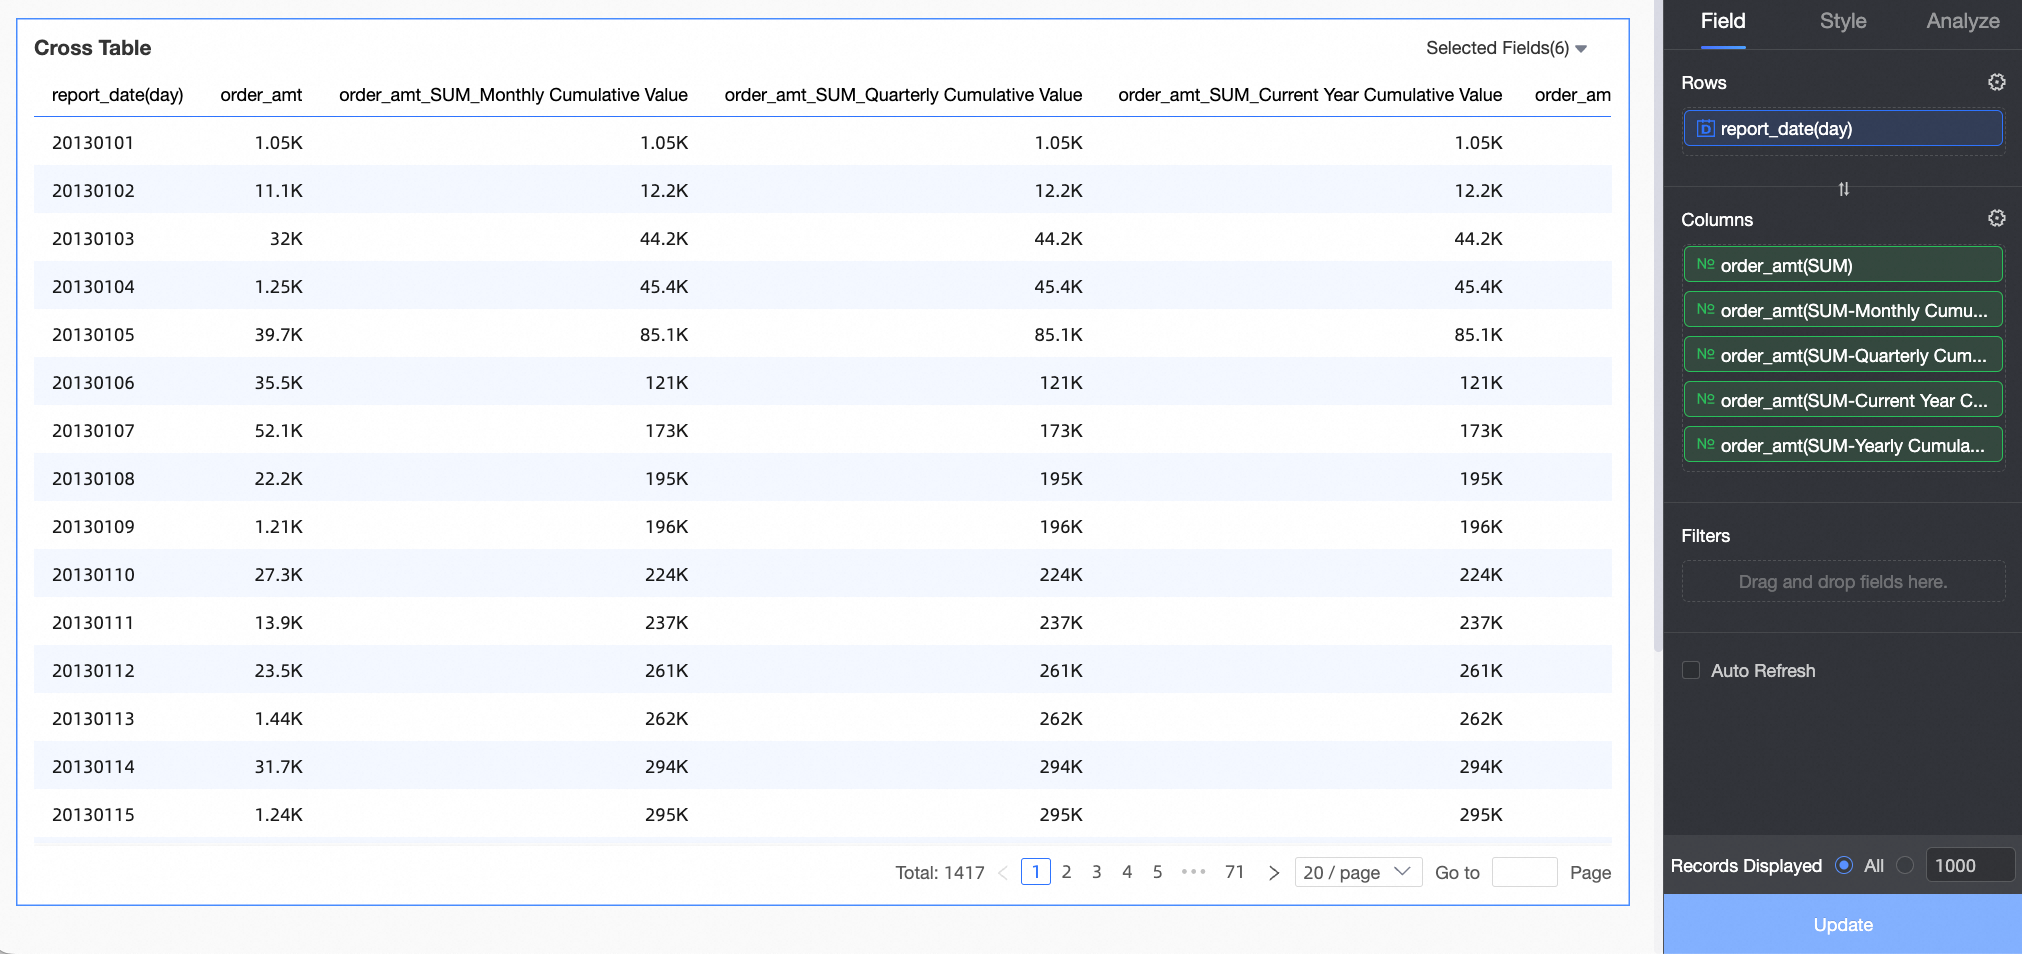
NoteTo analyze the Order Amount along with its monthly, quarterly, current year, and historical cumulative totals, add five instances of Order Amount to the Columns area.
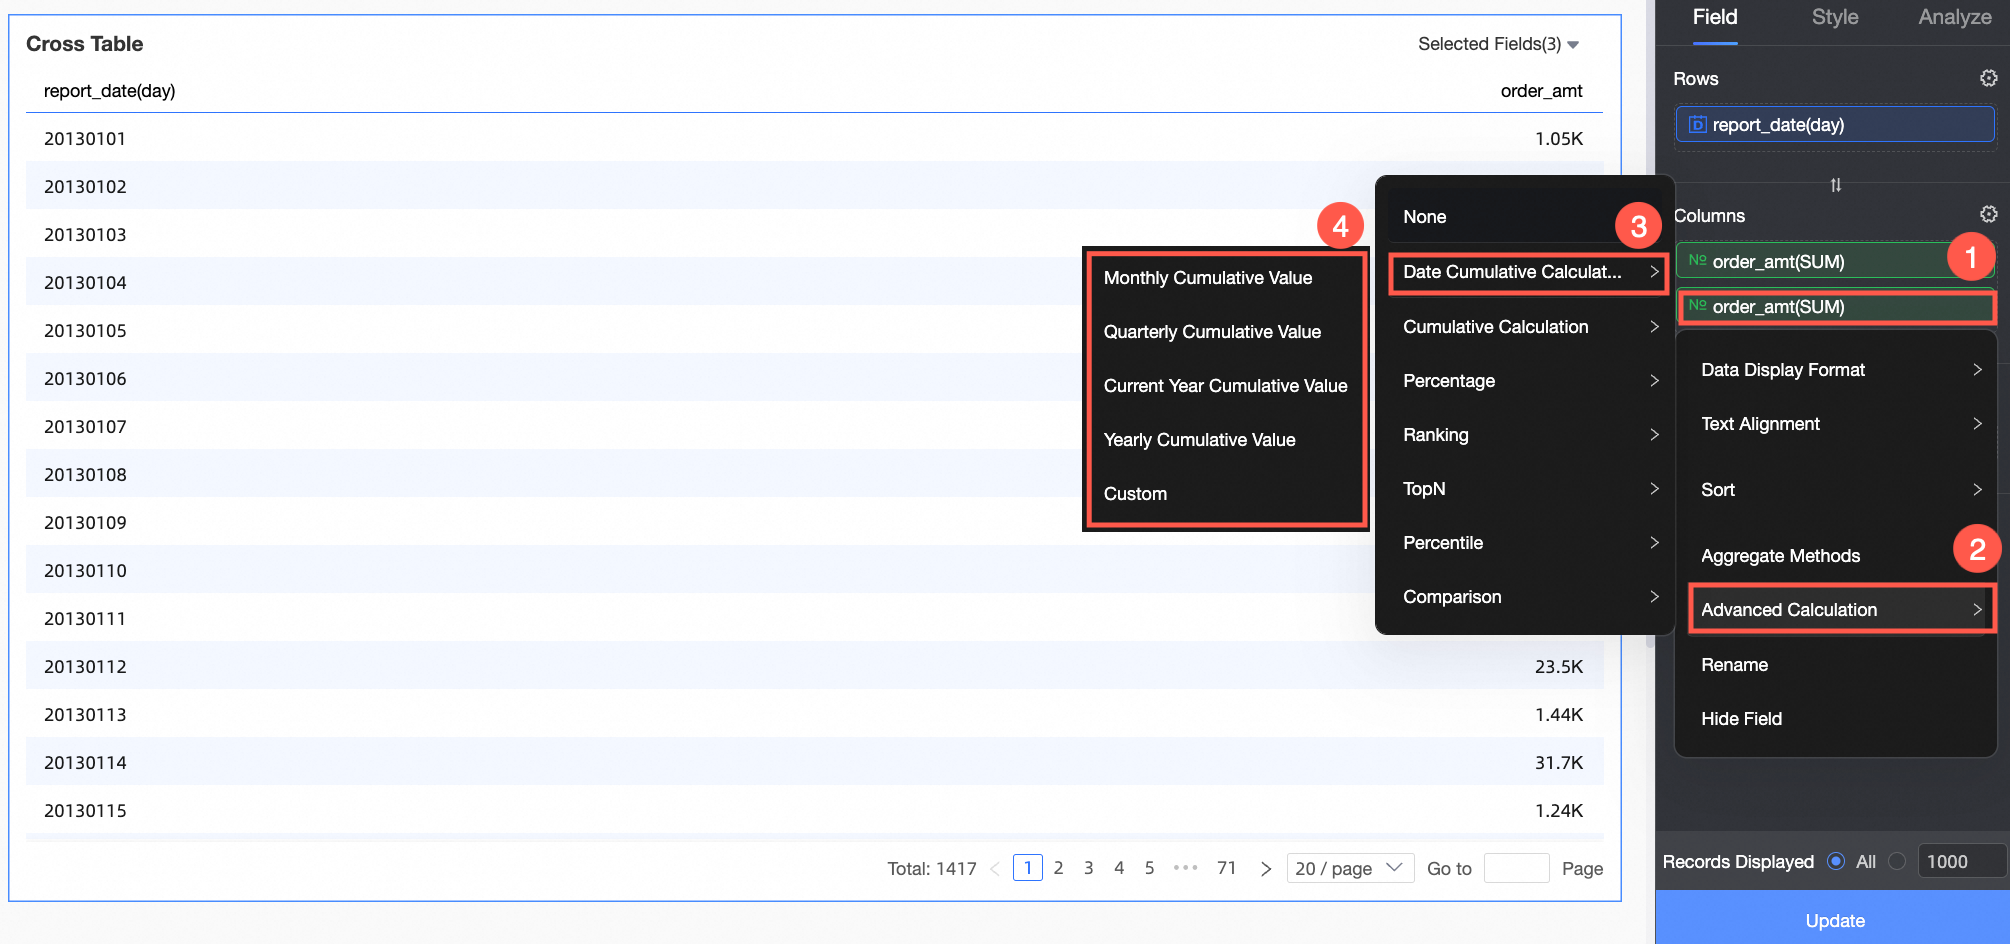
Hover over the Order Amount measure field, click the
 icon on the right, and choose Advanced Calculation->Cumulative Calculation By Date->Monthly Cumulative.
Repeat this process to adjust the cumulative calculation for the Order Amount to monthly, quarterly, current year, and historical cumulative.
NoteIf the dataset is set with a fiscal year and the date field corresponds to a fiscal year, day granularity allows for fiscal year cumulative and fiscal quarter cumulative calculations.
Click Update to apply the changes.
Dimensions contain a date field (month granularity)
This example demonstrates how to configure cumulative calculations by date using a cross table.
On the dashboard editing page, go to the Fields tab to add fields.
Locate Shipping_date(month) in the Dimensions list and either double-click or drag it to the Rows area.
Find Order Amount in the Measures list and double-click or drag it to the Columns area.
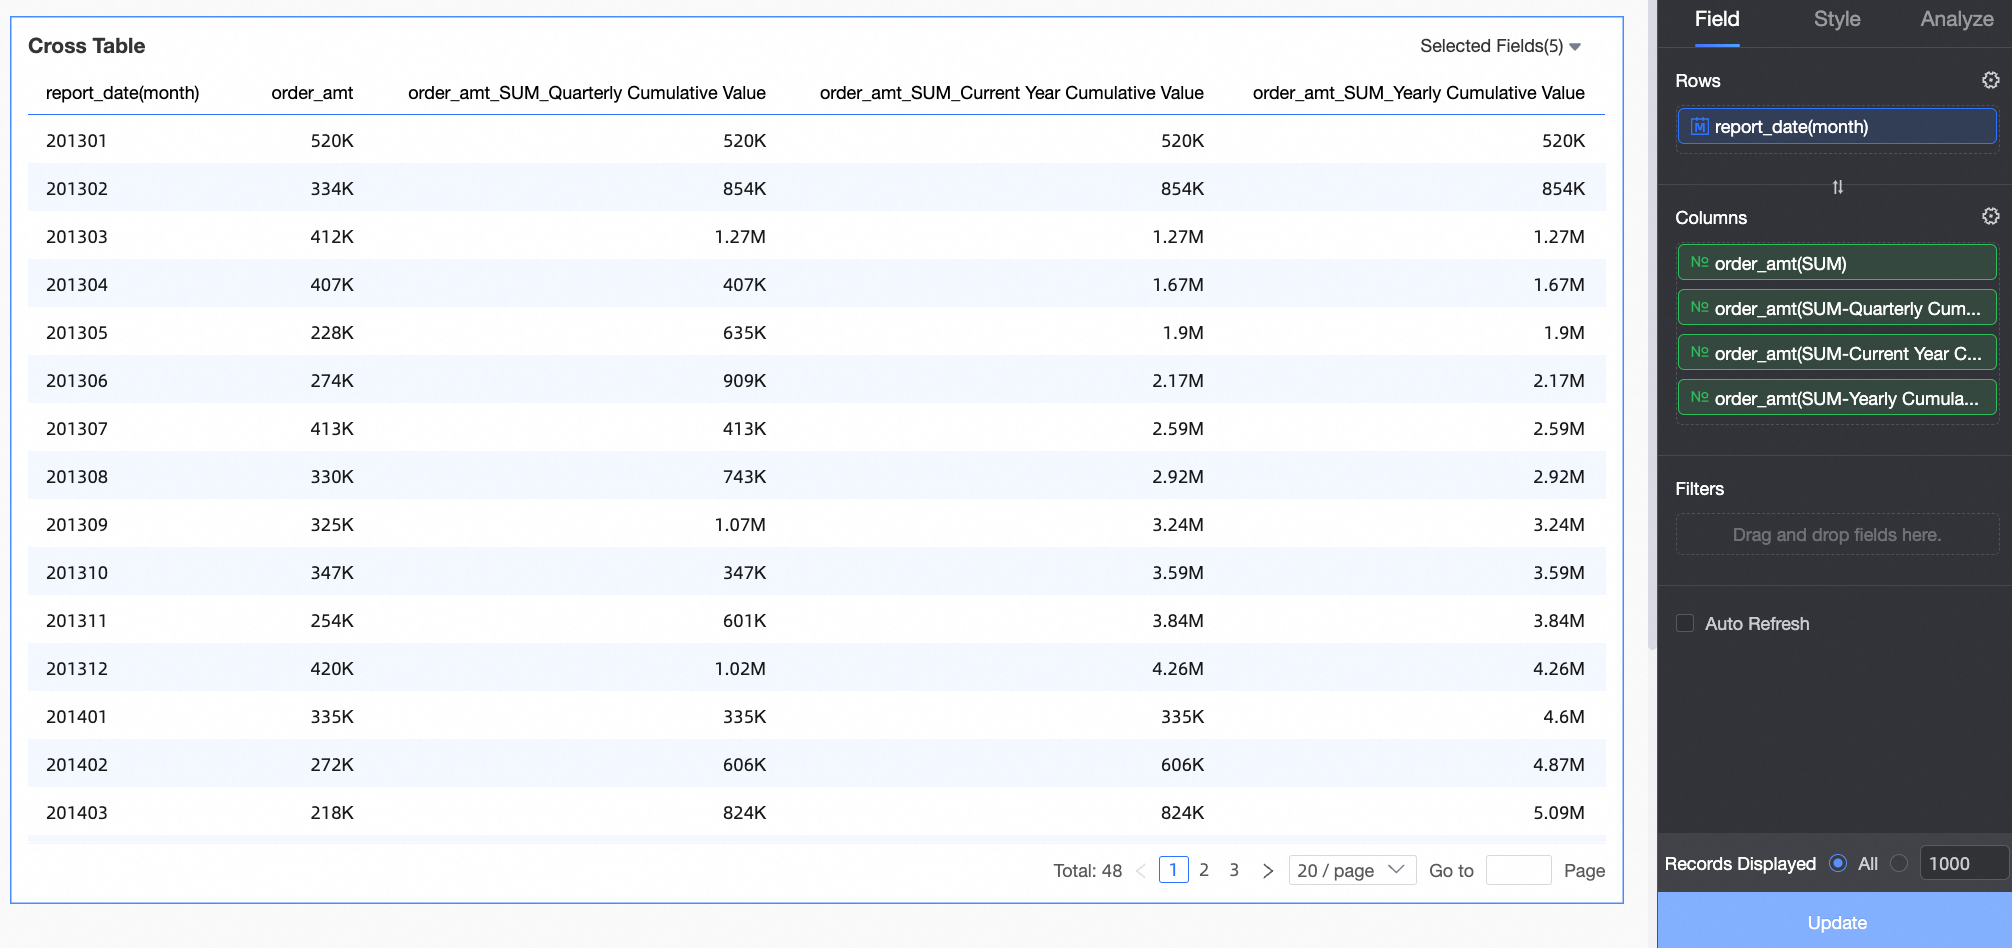
NoteTo analyze the Order Amount along with its quarterly, current year, and historical cumulative values, add four instances of Order Amount to the Columns area.
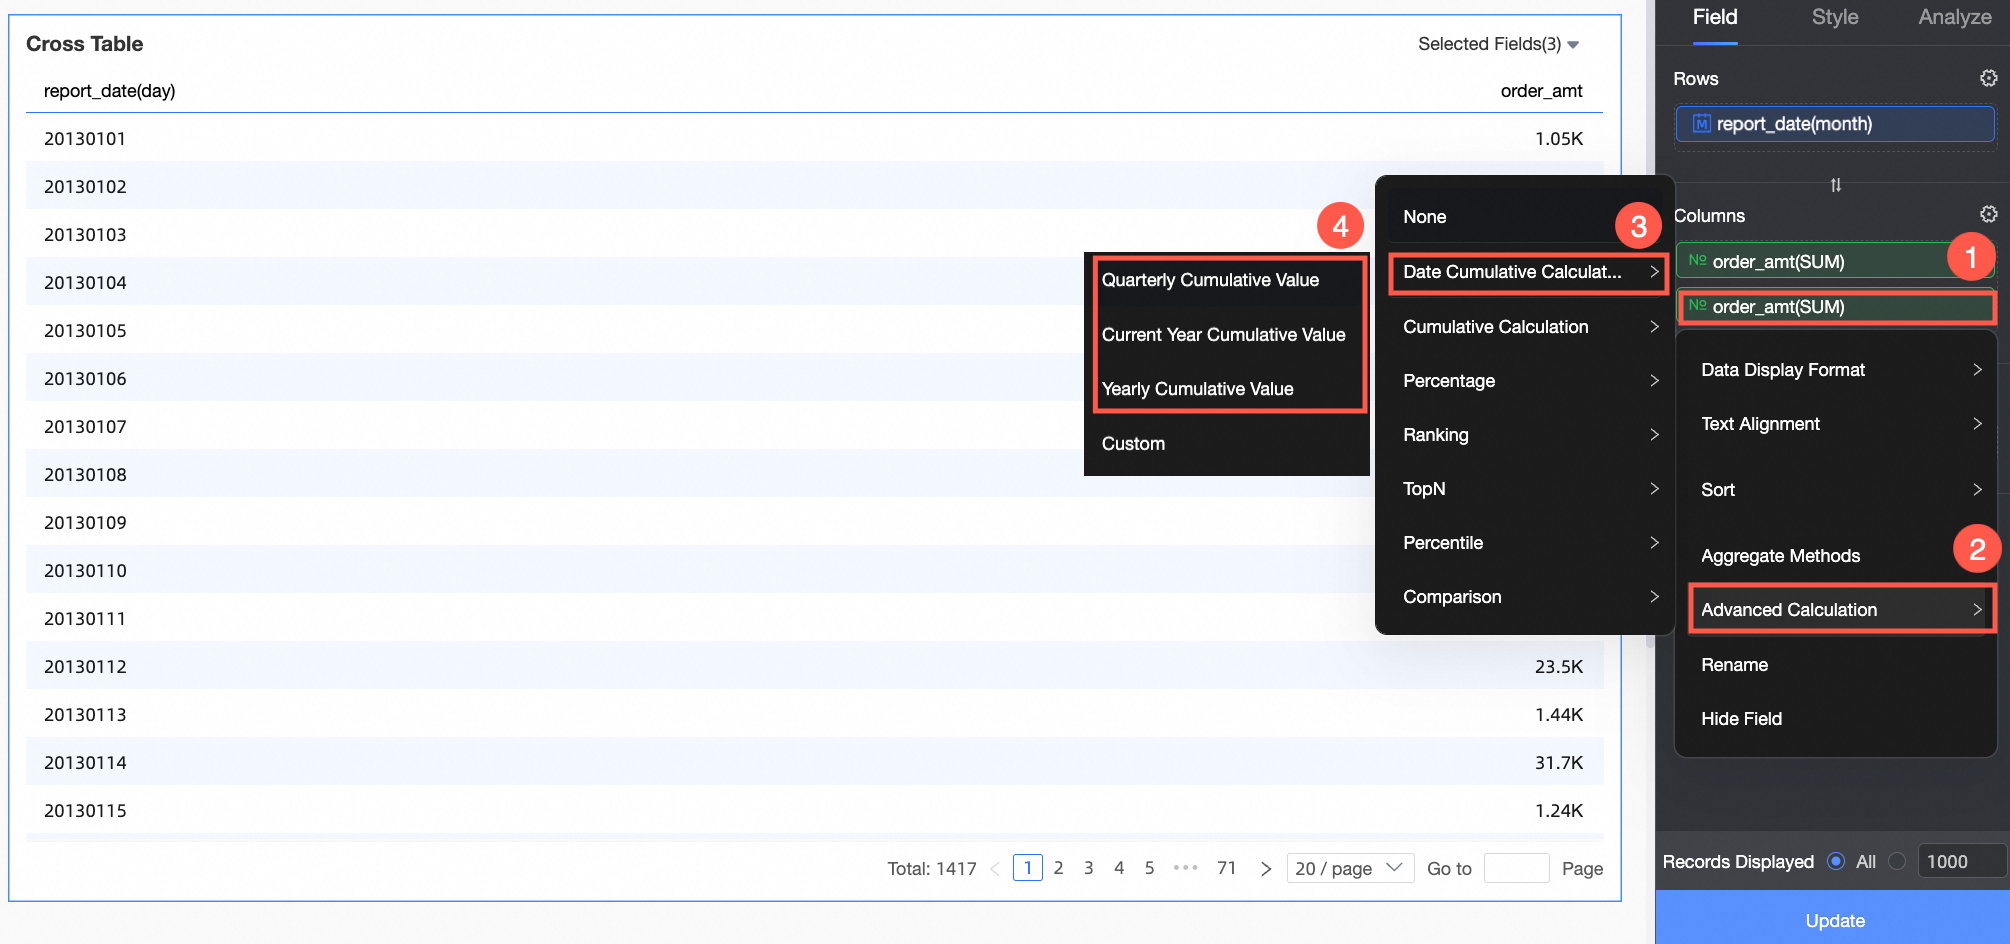
Hover over the Order Amount measure field, click the
 icon on the right, and choose Advanced Calculation->Cumulative Calculation By Date->Quarterly Cumulative.
Follow these steps to set the cumulative calculation for Order Amount to quarterly, current year, and historical cumulative.
NoteIf the dataset includes a fiscal year and the date field corresponds to a fiscal year, month granularity allows for fiscal year cumulative and fiscal quarter cumulative calculations.
Click Update.
Dimensions contain a date field (quarter granularity)
This example demonstrates how to set up cumulative calculations by date using a cross table.
On the dashboard editing page, go to the Fields tab to add fields.
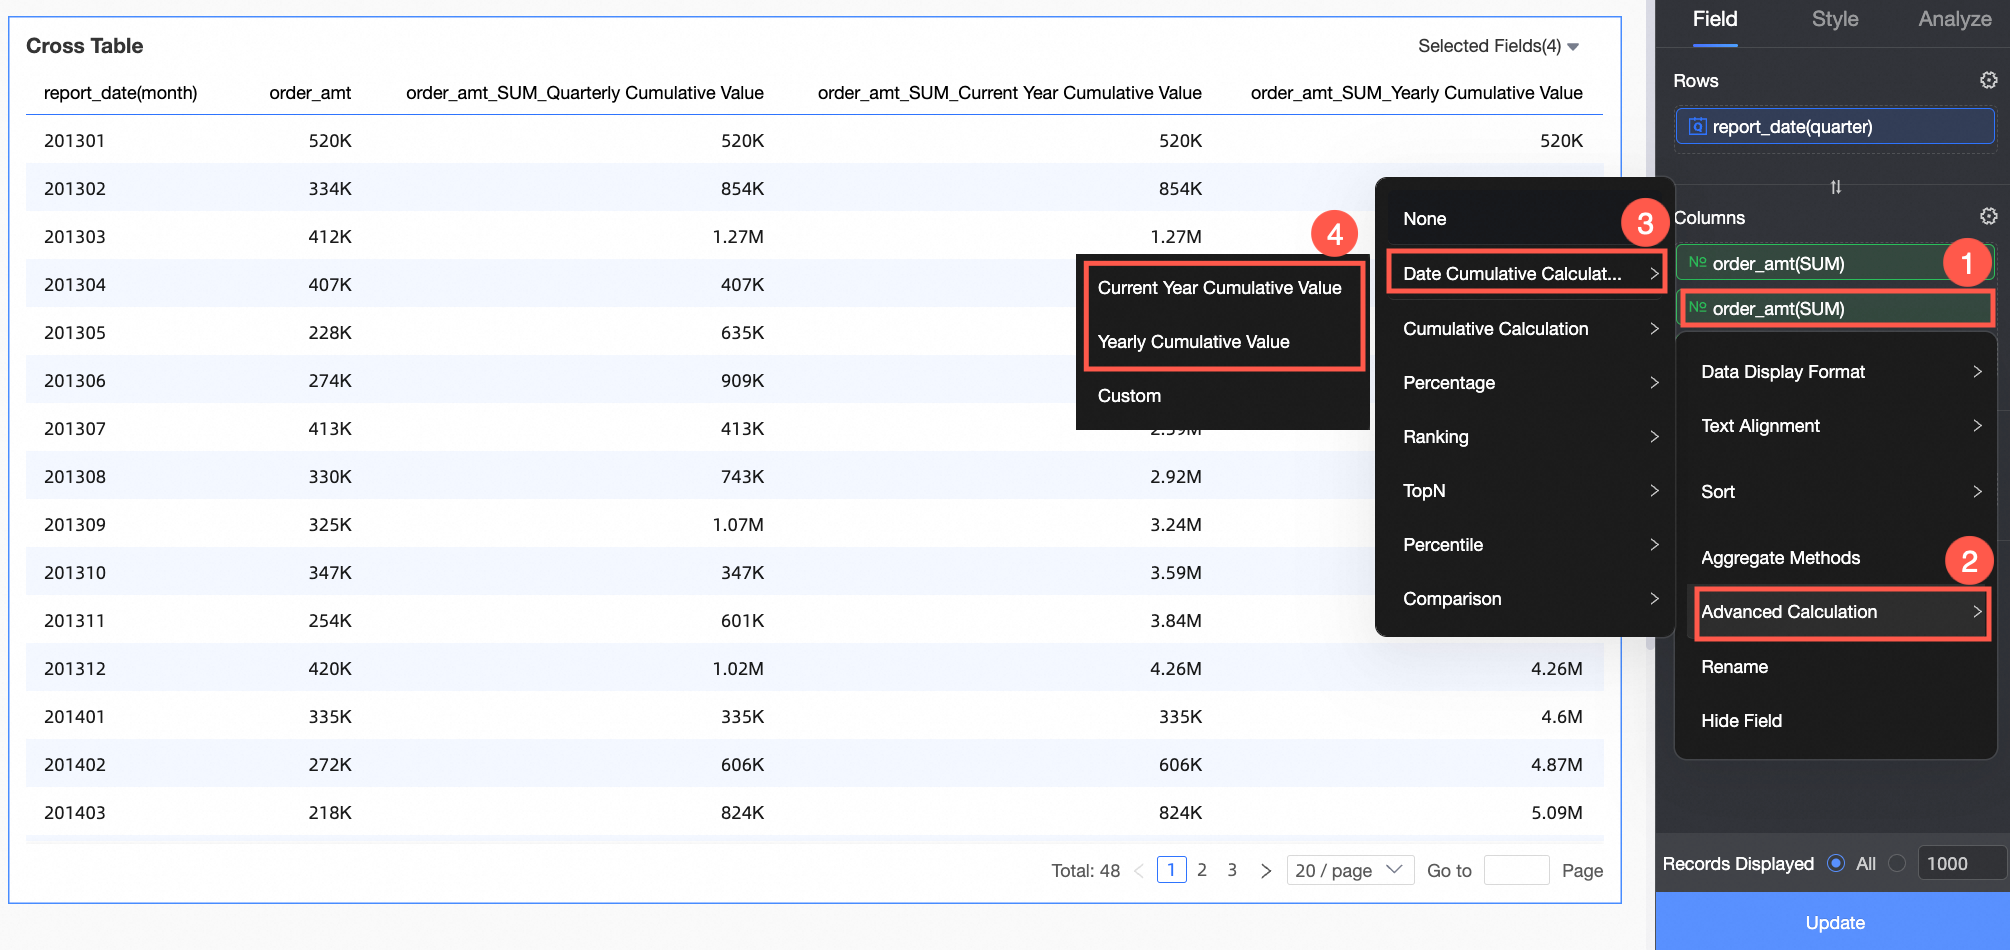
Locate shipping_date(quarter) in the Dimensions list, then double-click or drag it to the Rows area.
Find Order Amount in the Measures list, then double-click or drag it to the Columns area.
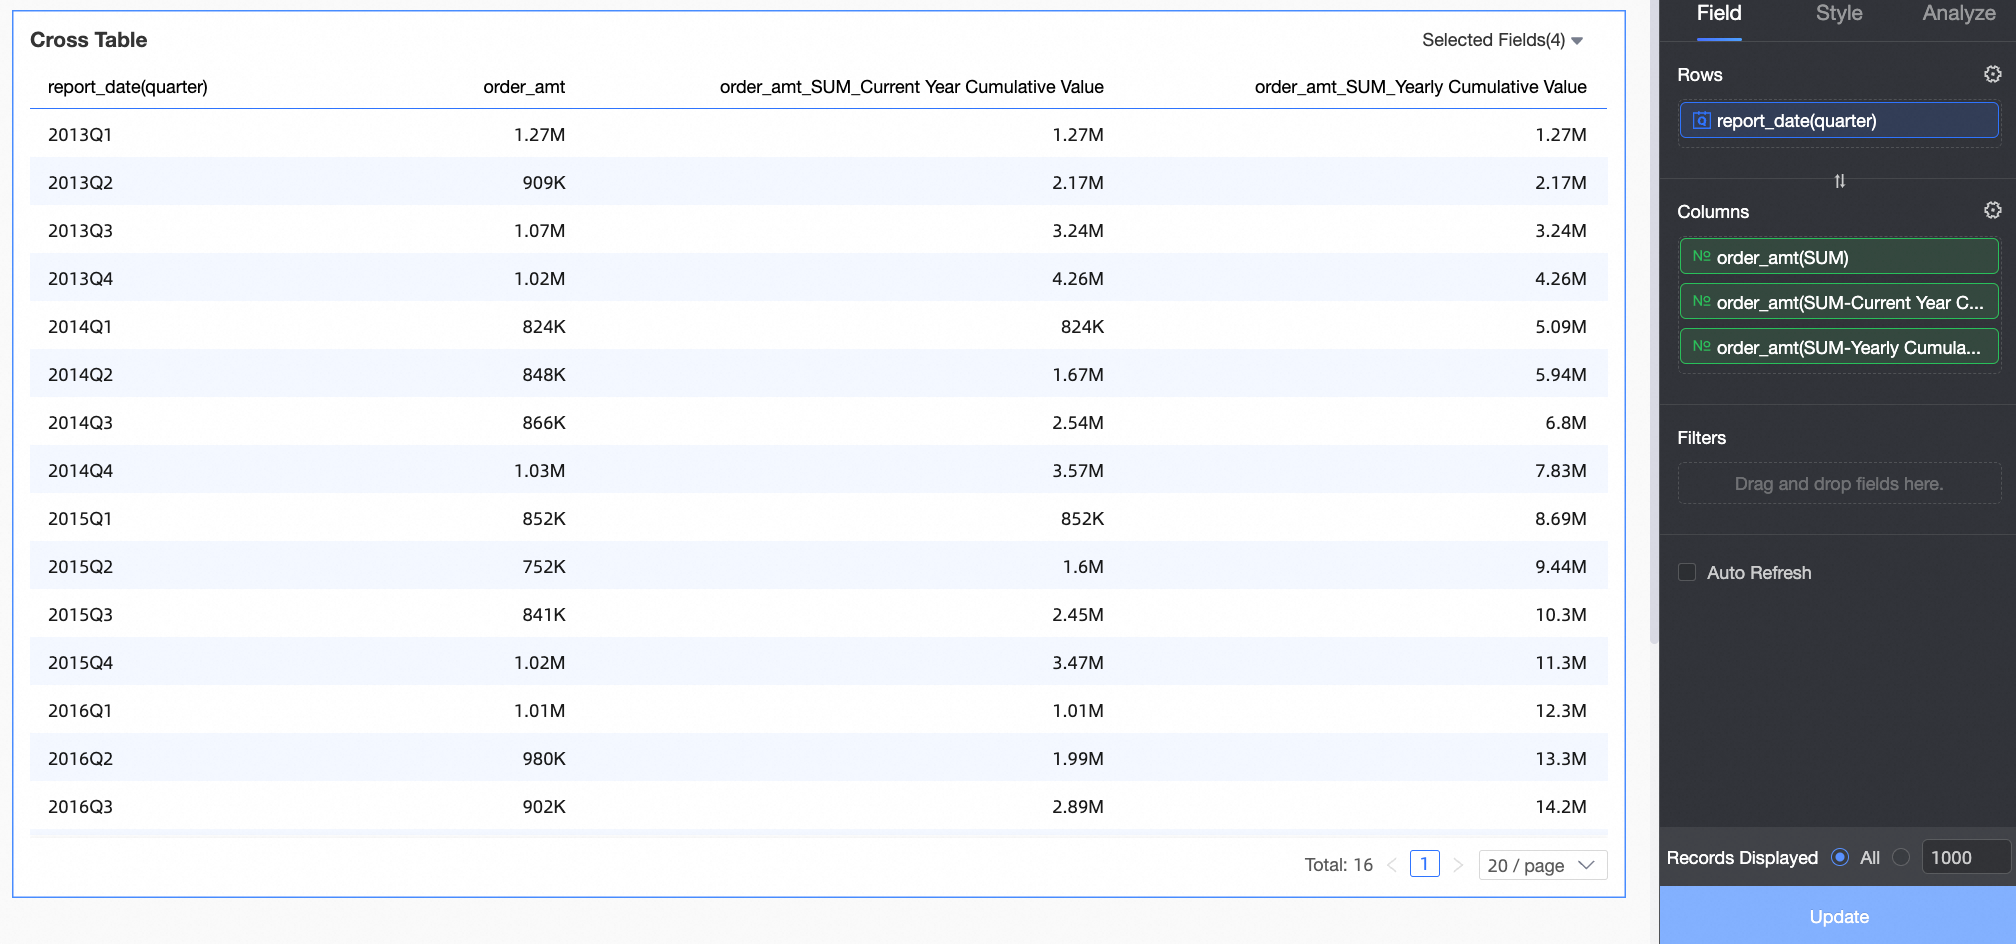
NoteTo analyze the Order Amount along with its current year and historical cumulative totals, add three instances of Order Amount to the Columns area.
Hover over the Order Amount measure field, click the
 icon on the right, and choose Advanced Calculation->Cumulative Calculation By Date->Current Year Cumulative.
Use this method to adjust the cumulative calculation for the Order Amount measure field to both current year and historical totals.
NoteIf a dataset is set with a fiscal year and the date field is a fiscal year field, quarter granularity allows for fiscal year cumulative calculations but not for current year cumulative.
Click Update.
Dimensions contain a date field (year granularity)
This example demonstrates how to configure cumulative calculations by date using a cross table.
On the dashboard editing page, go to the Fields tab to add fields.
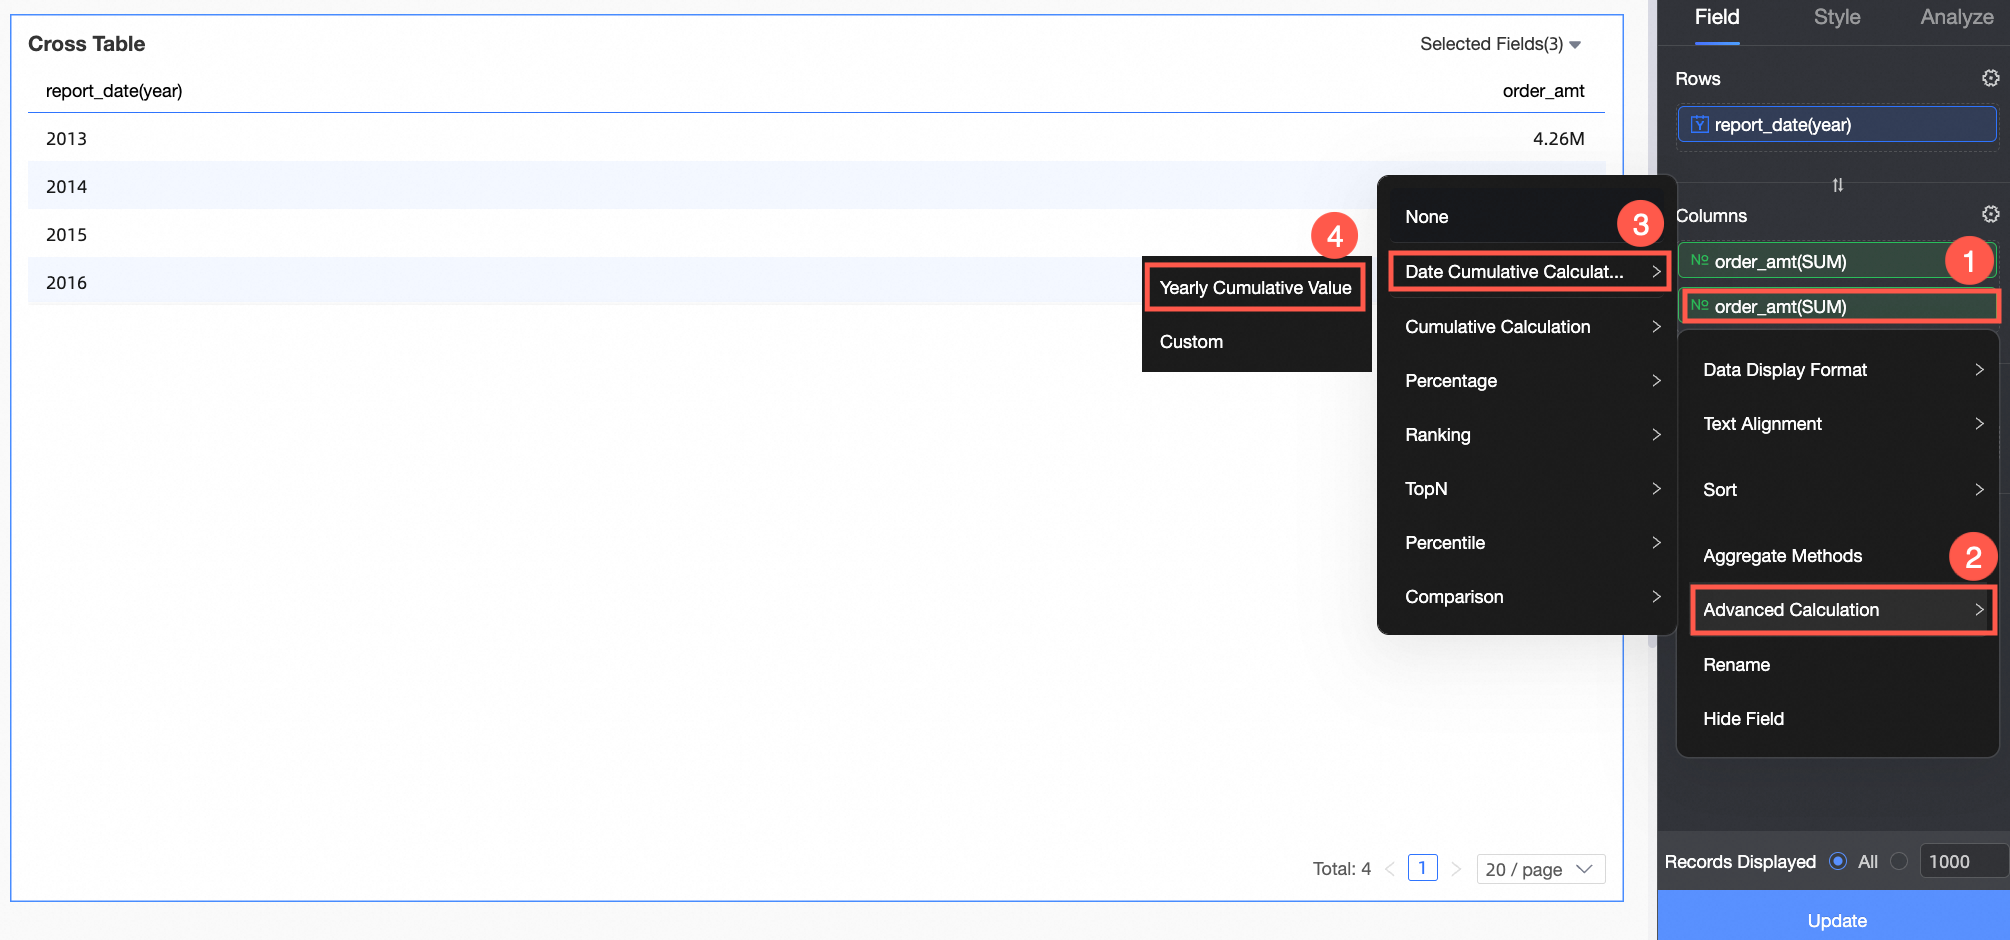
Locate shipping_date(year) in the Dimensions list, then double-click or drag it to the Rows area.
Find Order Amount in the Measures list, then double-click or drag it to the Columns area.
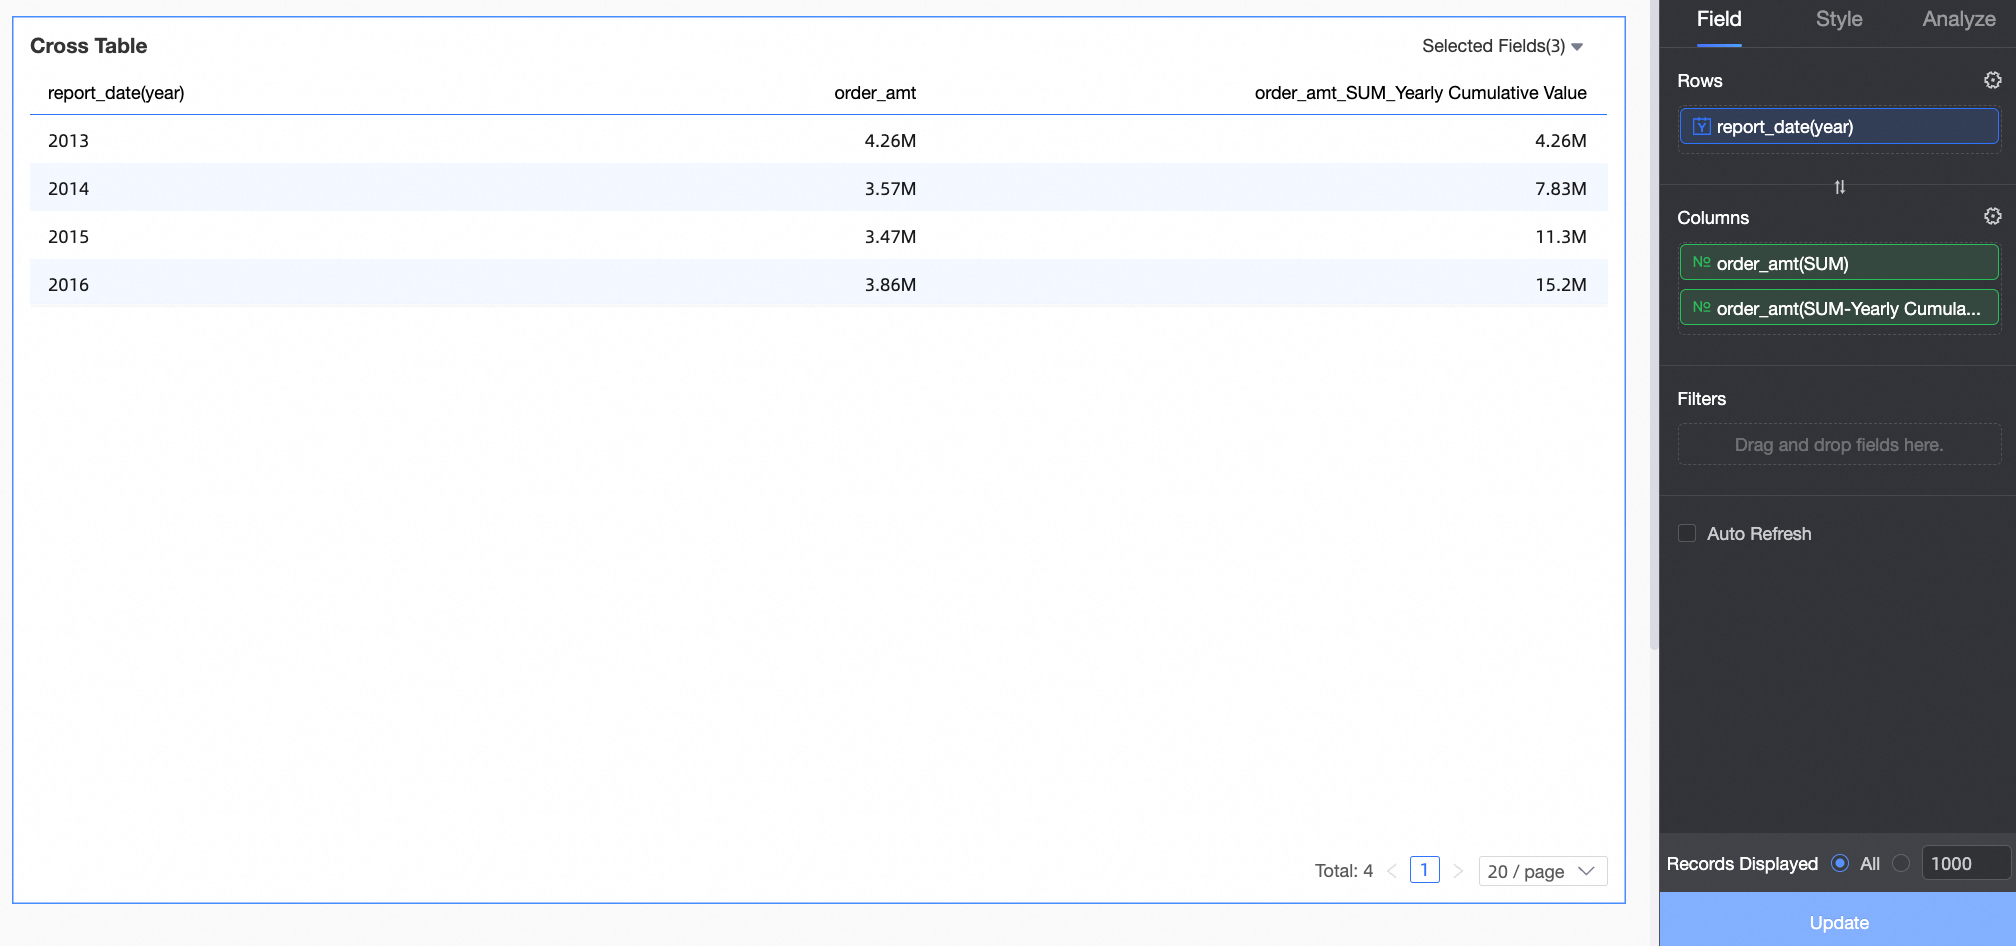
NoteTo analyze the Order Amount and its historical cumulative, add two instances of Order Amount to the Columns area.
Hover over the Order Amount measure field, click the
 icon on the right, and choose Advanced Calculation->Cumulative Calculation by Date->Historical Cumulative.
Click Update.
Multiple date fields in dimensions
When including multiple date fields in dimensions, the system selects the field with the finest granularity for configuring cumulative calculations by date.
This example demonstrates how to configure a cross table for cumulative calculation by date.
Add fields on the Fields tab of the dashboard editing page.
In the Dimensions list, locate shipping_date(year), shipping_date(quarter), and shipping_date(month), then double-click or drag them to the Rows area.
In the Measures list, find Order Amount, then double-click or drag it to the Columns area.
NoteTo view the Order Amount and its quarterly, current year, and historical cumulative values, add four instances of Order Amount to the Columns area.
Hover over the Order Amount measure field, click the
 icon, and select Advanced Calculation->Cumulative Calculation By Date->Custom.
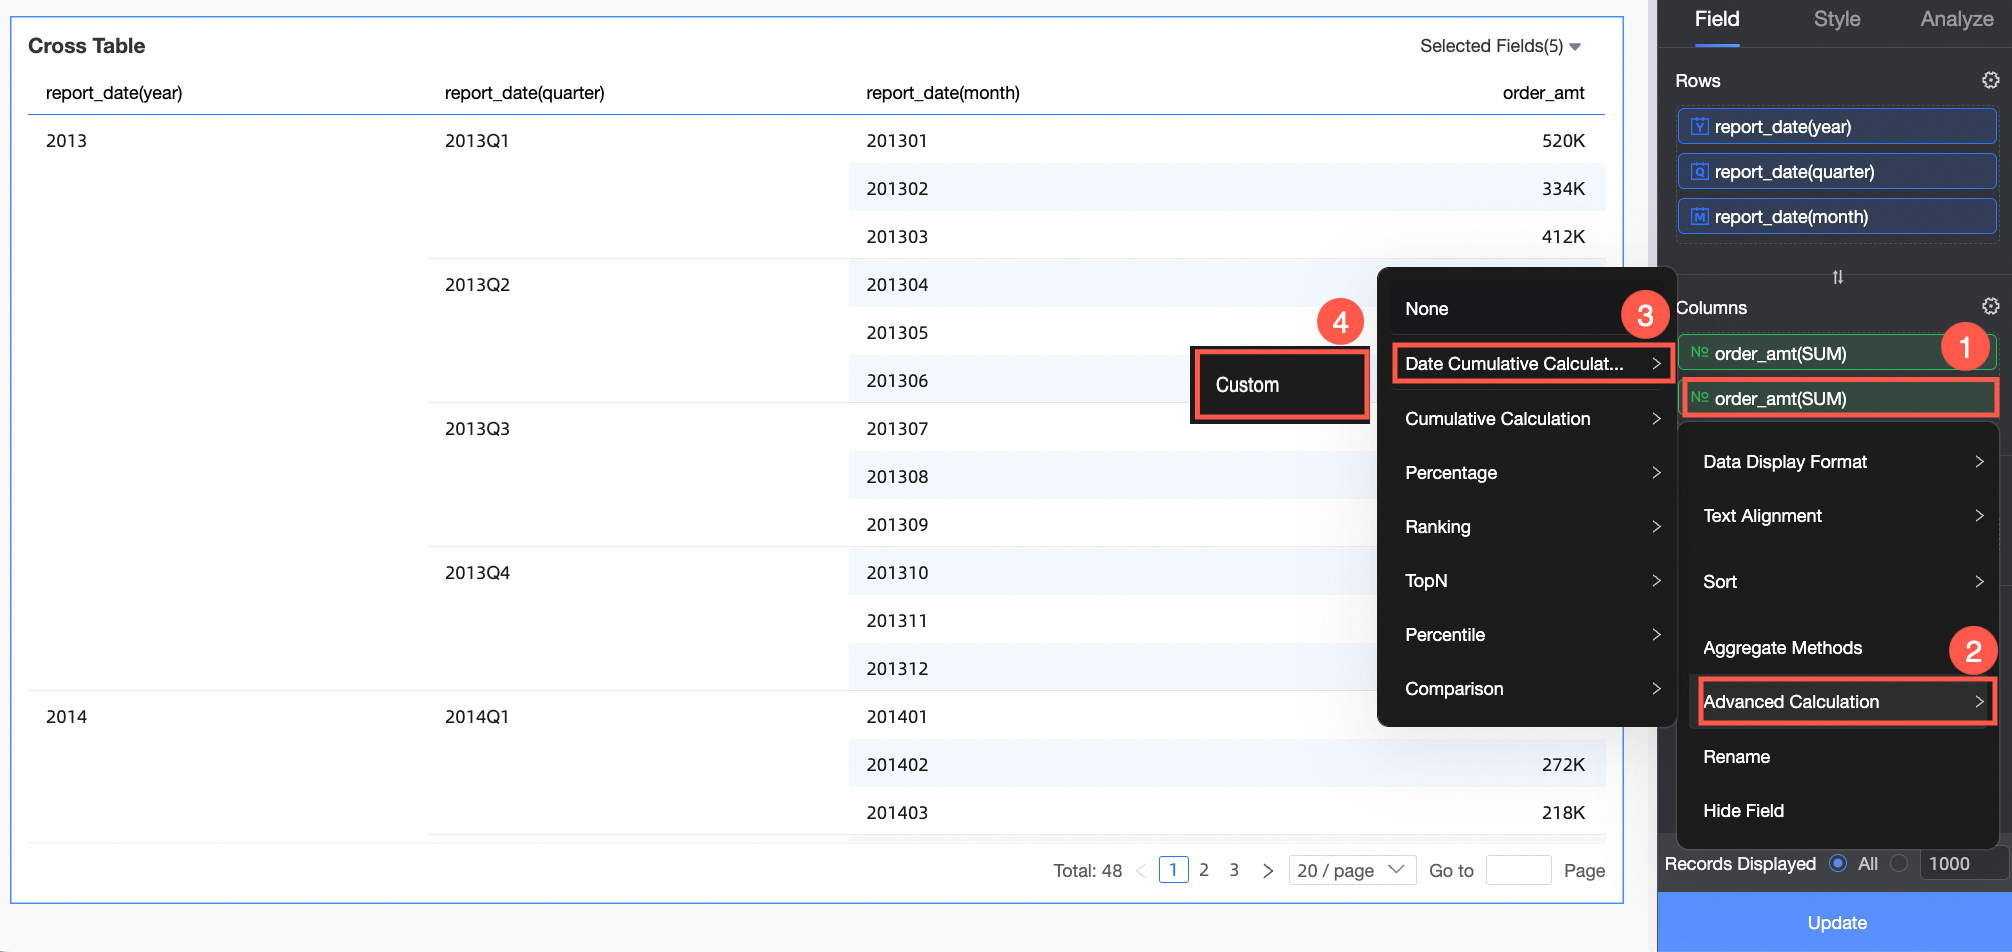
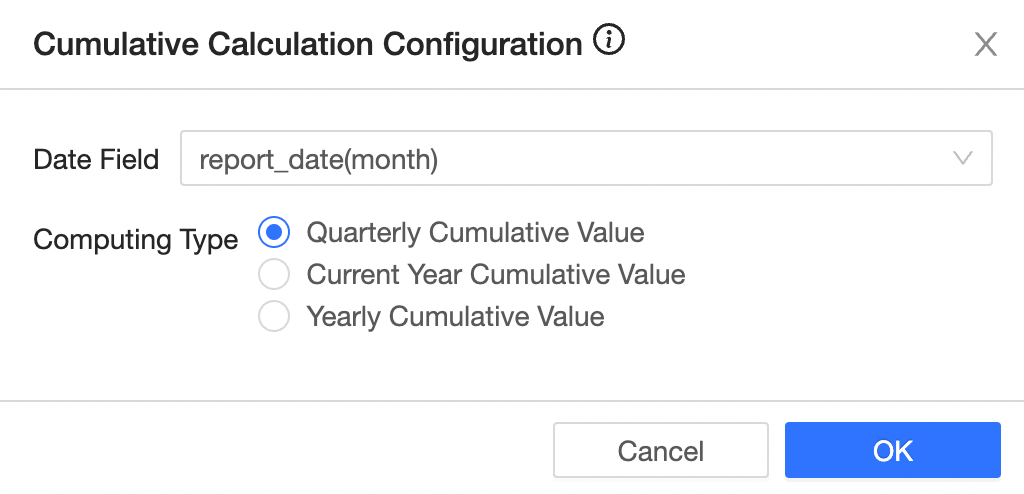
On the Cumulative Calculation by Date configuration page, select the Date Field and the corresponding Calculation Type, then click Confirm.
The date field allows selection from year, quarter, month, week, and day granularities. The calculation type varies with the field's granularity. For the corresponding relationships, see Correspondence between Date Fields and Cumulative Calculation by Date.
In this example, select shipping_date(month) as the Date Field.
 Note
NoteWhen a dataset includes a fiscal year and the date field is a fiscal year field, day and month granularities support fiscal year cumulative and fiscal quarter cumulative. Quarter granularity supports fiscal year cumulative but not current year cumulative.
Click Update.
Add query conditions to the chart.
This enables convenient querying of cumulative data within specific time intervals.
Use the instructions in the figure below to add query controls.
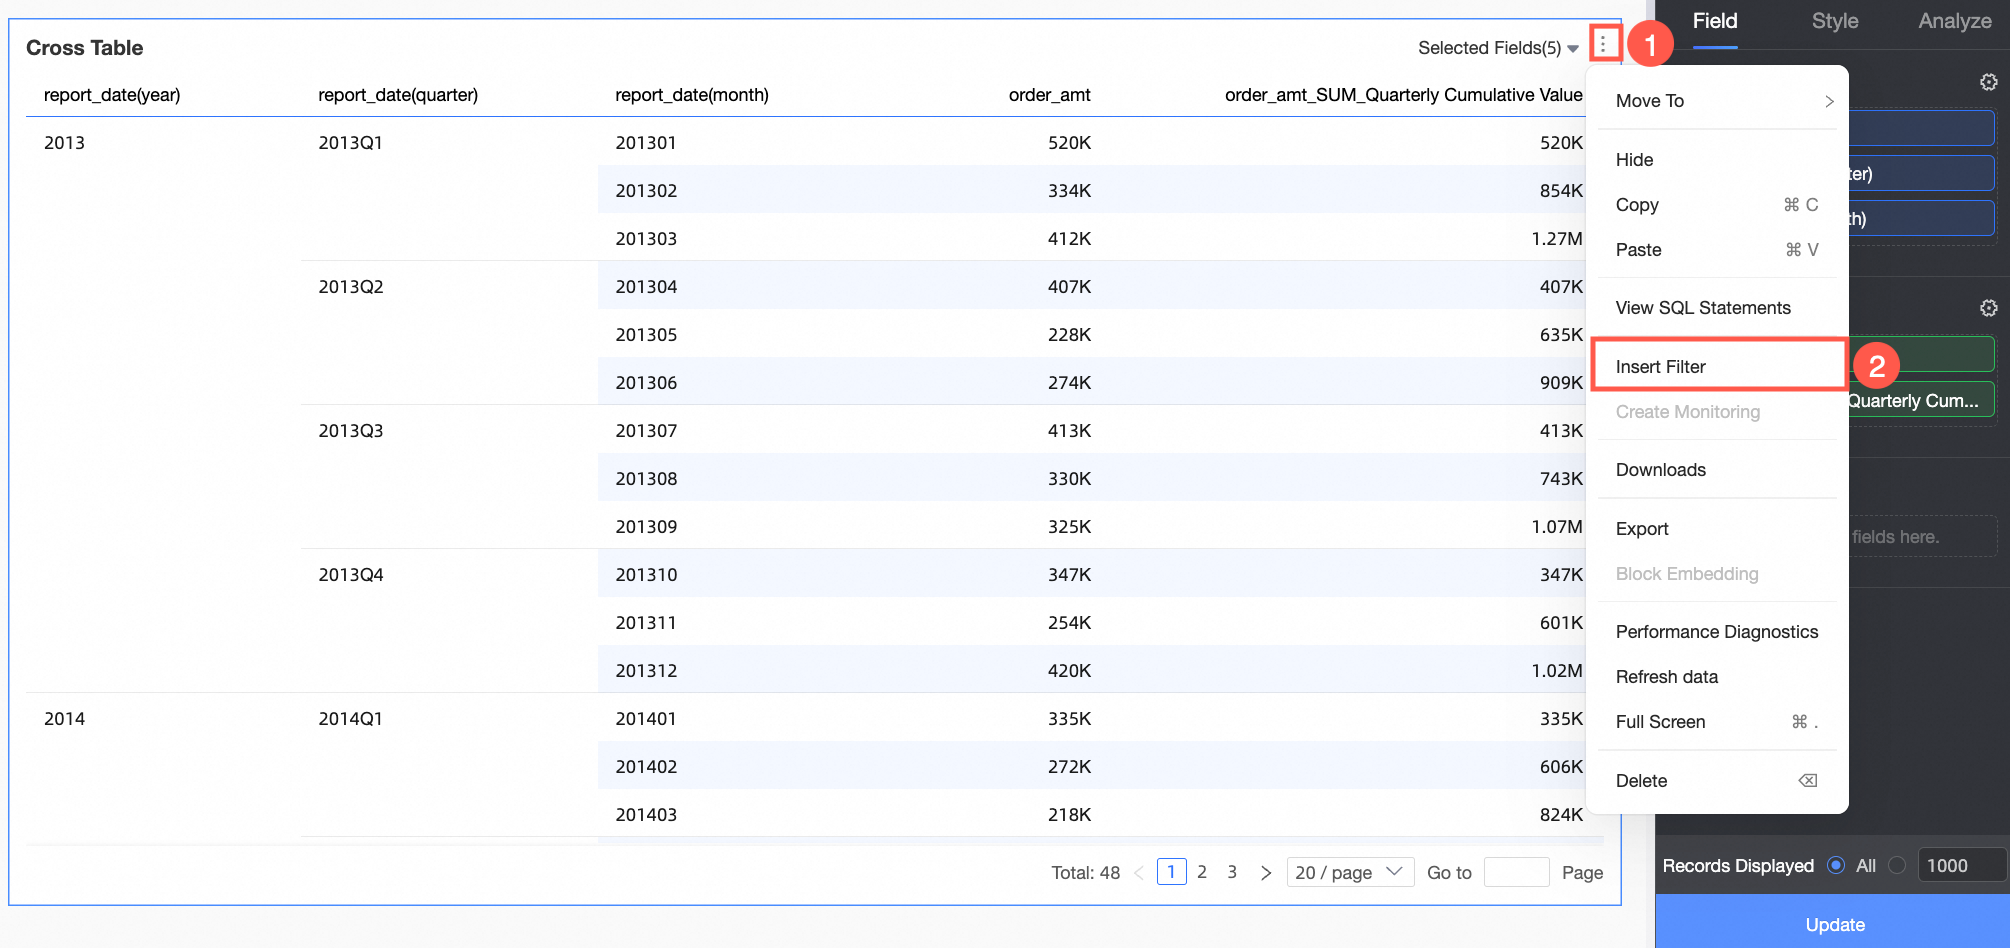
Configure the query conditions on the chart's query condition page.
For detailed configuration steps, see Create Query Conditions within a Chart.
NoteEnsure the associated field matches the selected Date Field when configuring query controls.
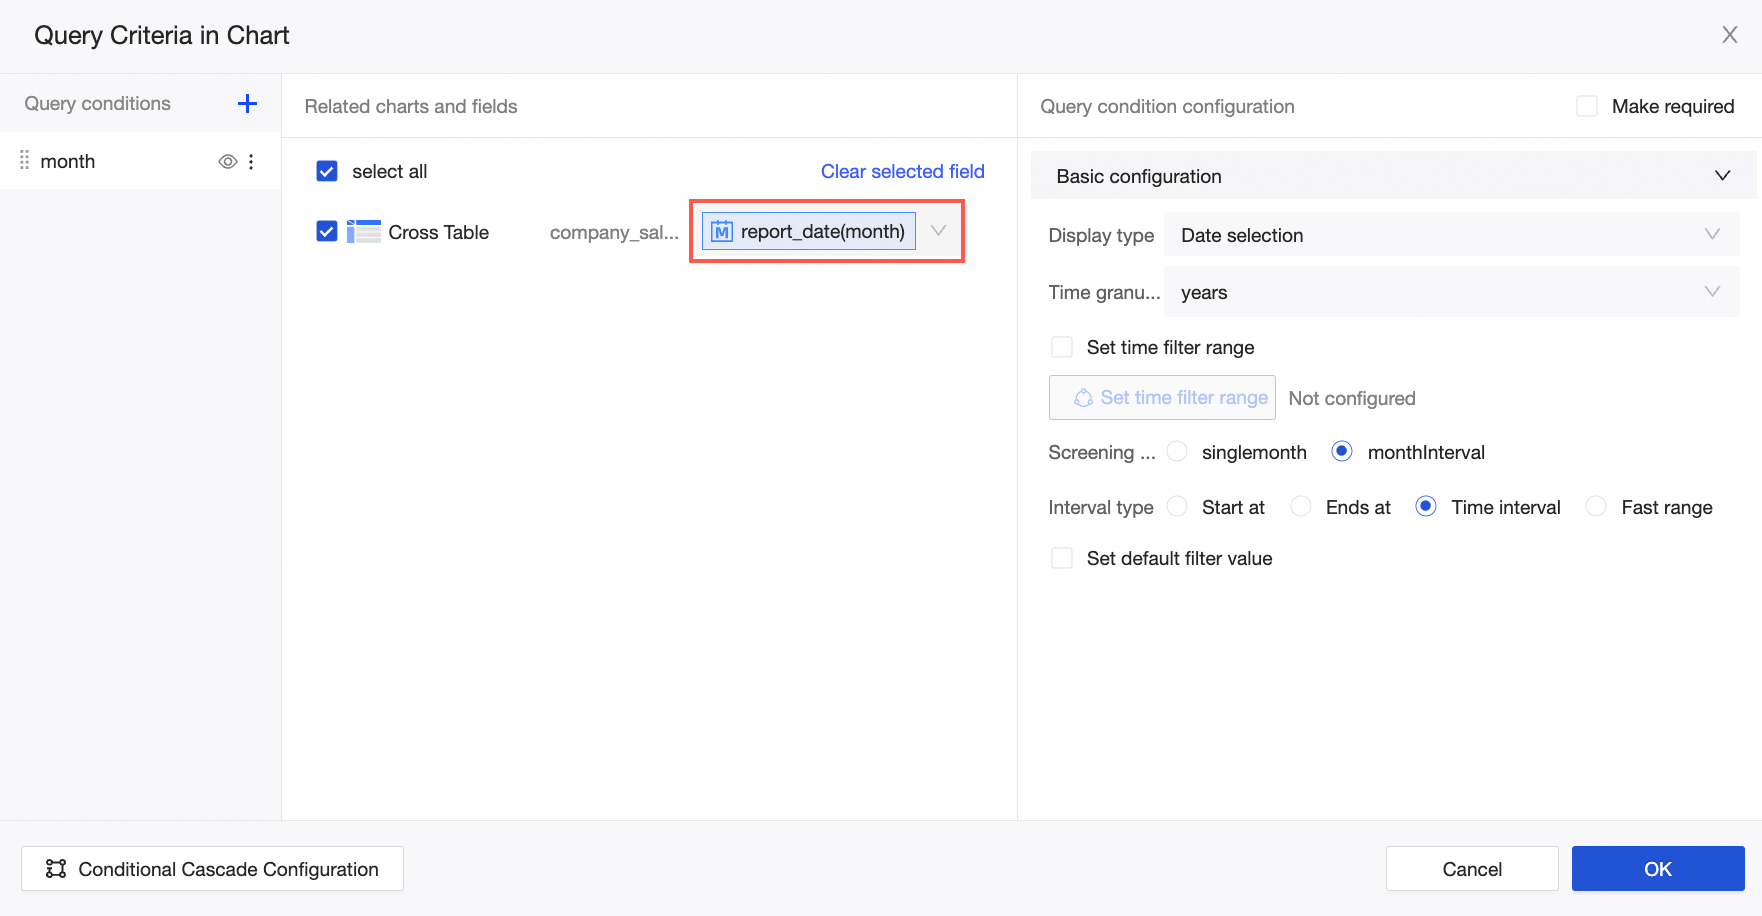
After setting the query conditions, query the cumulative data for a specific month.

Please provide the technical excerpt you would like to have polished.