This topic describes how to use Alibaba Cloud Managed Service for Prometheus to monitor a Windows ECS instance.
(Optional) Step 1: Install Windows Exporter
You can use one of the following methods to deploy Windows Exporter and collect metrics from the ECS instance. If you want to automatically install Windows Exporter, proceed to Step 2.
Automatic installation: The system automatically adds service discovery configurations to the ECS instance based on the specified conditions and installs Windows Exporter in the instance.
Manual installation: Before you monitor the ECS instance, you need to manually install Windows Exporter in the instance and enable inbound access to the port through the virtual private cloud (VPC) where the instance resides.
Download Windows Exporter: Log on to the Windows system of the ECS instance as an administrator, and download the installation package of Windows Exporter to the system.
Install Windows Exporter: Double-click the installation package windows_exporter-1.22.0-amd64.msi, or run the
msiexec /i windows_exporter-1.22.0-amd64.msicommand to complete the installation.By default, Windows Exporter is installed in the
C:\Program Files (x86)\windows_exporterdirectory.The default port is 9182.
By default, the following metrics are collected: cpu, cpu_info, memory, process, tcp, cs, logical_disk, net, os, system, textfile, and time.
After Windows Exporter is installed, you can see the created services in Windows Console, including Windows Exporter.
Check whether Windows Exporter is working as expected: Run the
curl localhost:{listening port}/metricscommand or accesslocalhost:{listening port}/metricsthrough a browser. Check whether normal Prometheus metric data is returned. If normal metric data is returned, Windows Exporter is working as expected.Modify the config.yml file: Modify the port, or add or delete metrics. For more information, see Windows Exporter documentation. After you modify the config.yml file, run the
sc stop windows_exporter && sc start windows_exportercommand or use Windows Console to restart Windows Exporter.
Step 2: Enable the Windows component
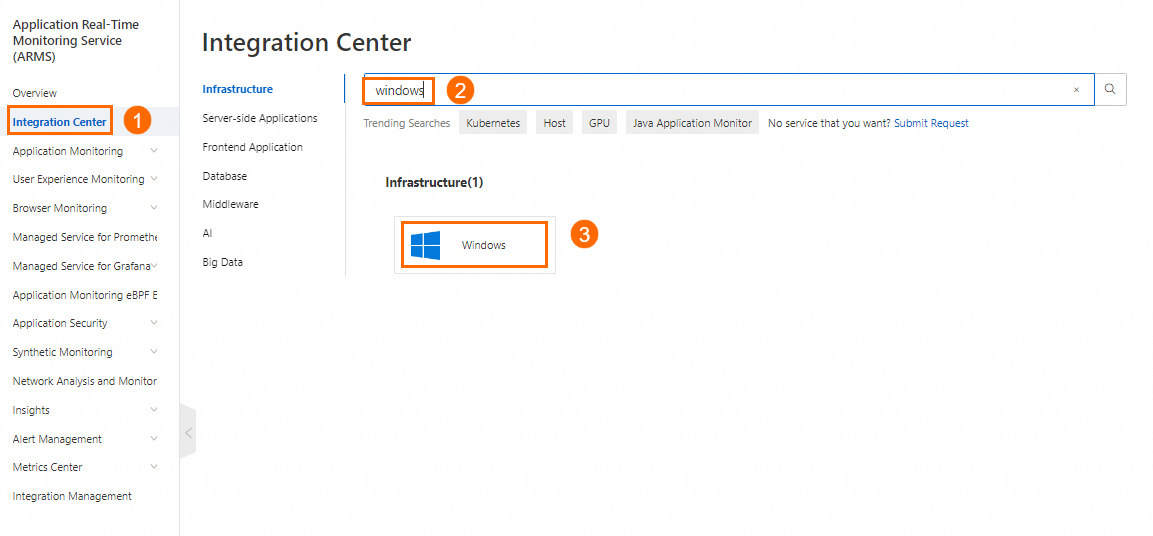
Search for the Windows component: Log on to the Managed Service for Prometheus console. In the left-side navigation pane, click Integration Center. Search for the Windows component.
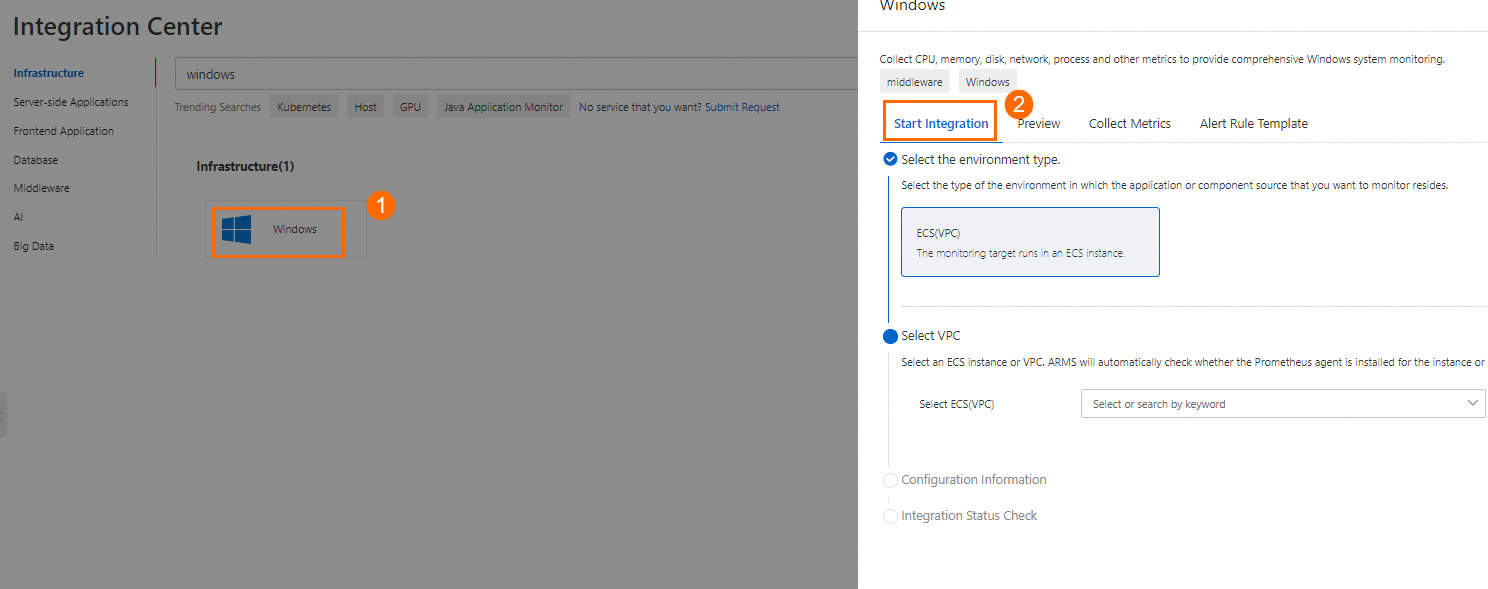
Enable the component: On the Start Integration tab of the Windows panel, configure the parameters and click OK.
Parameter
Description
Select the environment type
The environment in which the Windows operating system is running. Valid value:
ECS(VPC)
WindowsExporter Installation Mode
Specify how to install Windows Exporter. Valid values:
Automatic Installation
Self Installation
Host Service Discovery Mode
Specify the conditions of service discovery. Valid values:
Unconditional (Select all Windows instances in the current VPC)
Stain Label Selection
Tag Label Selection
IP CIDR
Instance ID
Collect TextFile
You can enter the absolute path of the directory where textfile is located. The path does not support environment variables. Example: /home/app/textfiles.
Windows-Exporter Service port
The port of Windows Exporter. The default port is automatically filled in.
Security Groups Are Automatically Configured
Specify whether to check the security group of the ECS instance to ensure the successful integration of the instance, and automatically add security group rules if the check fails.
Custom ECS Tag Injection
Specify tag keys of the instance. Then, the whole key value pairs are added to the metrics.
Metric Scrape interval (unit/second)
The interval at which metric data is collected. Default value: 15.
Step 3: View the Windows dashboards
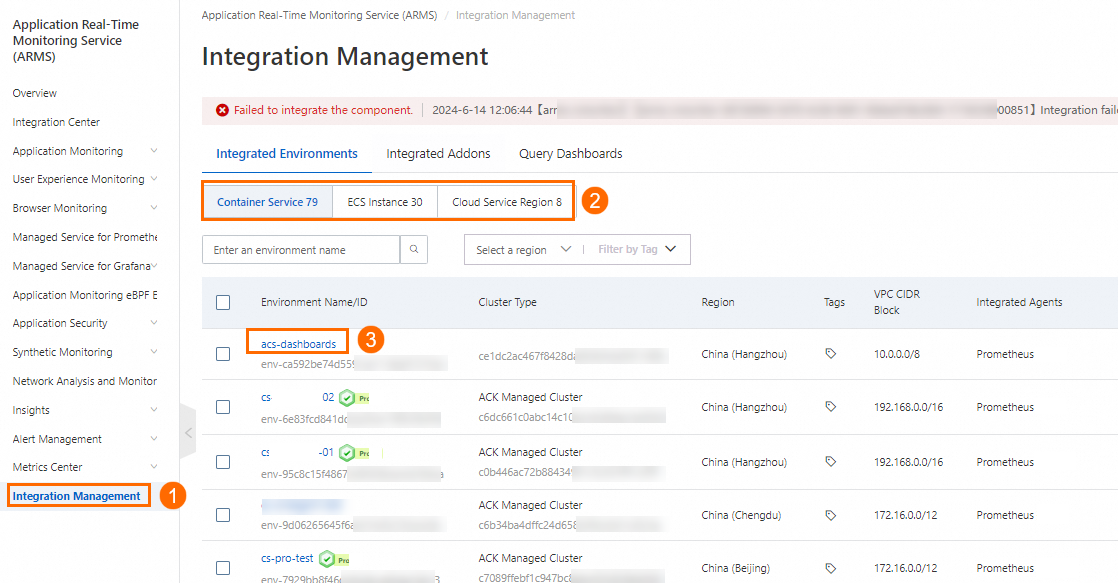
Go to the environment details page: Log on to the Managed Service for Prometheus console. In the left-side navigation pane, click Integration Management. On the Integrated Environments tab of the Integration Management page, click the name of the ECS instance.
View the dashboard names: In the Addon Type section of the Component Management tab, click Windows. Then, click Dashboards to view all the dashboard names.
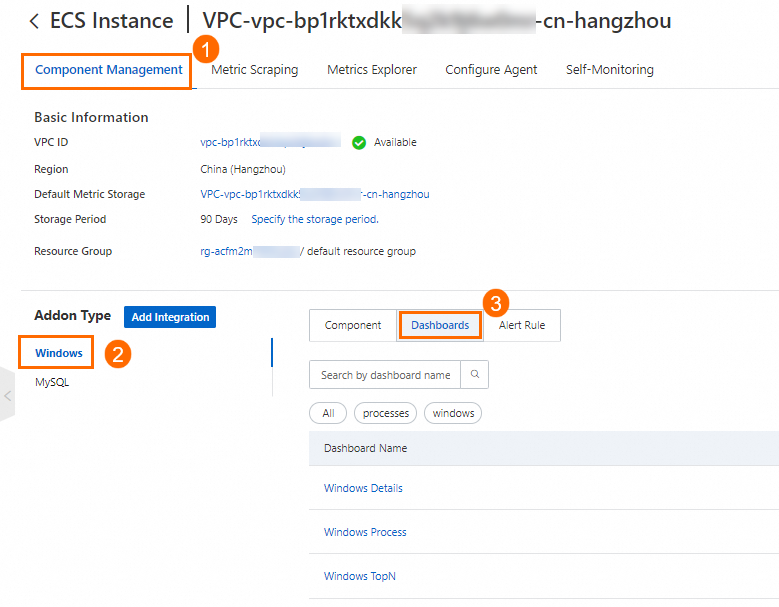
View a dashboard: Click the name of a dashboard.
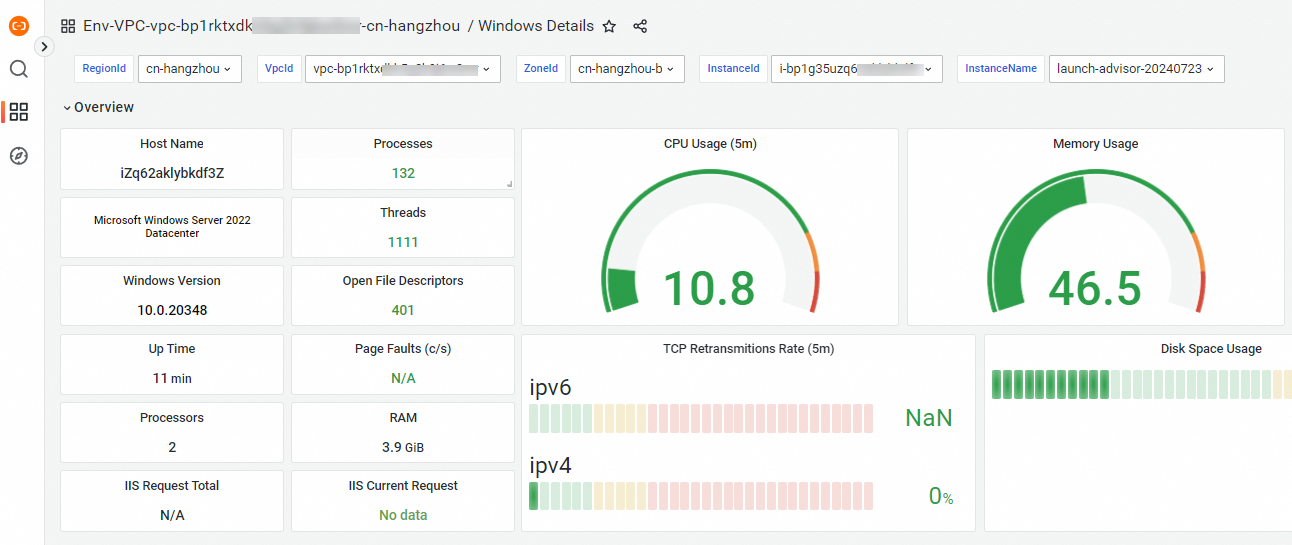
Step 4: Configure alerting
For information about how to create Prometheus alert rules, see Create an alert rule for a Prometheus instance.