This topic describes how to deploy and configure a Kafka JMX agent.
Limit
You can deploy a Kafka JMX agent only in a Prometheus instance for Container Service or a Prometheus instance for ECS.
Step 1: Deploy a Kafka JMX agent
Download the kafka JMX-Agent package to the pod or ECS instance where Kafka resides.
Add
-javaagent:/{jmx-agent directory}/kafka-jmx_prometheus_javaagent-1.18.1.jar={jmx listening port}to the Java Virtual Machine (JVM) startup parameters of Kafka Producer, Broker, and Consumer.jmx-agent directory: Replace the value with the actual directory where the Kafka JMX agent is stored.
jmx listening port: Replace the value with the actual JMX listening port.

Restart Kafka Producer, Broker, and Consumer.
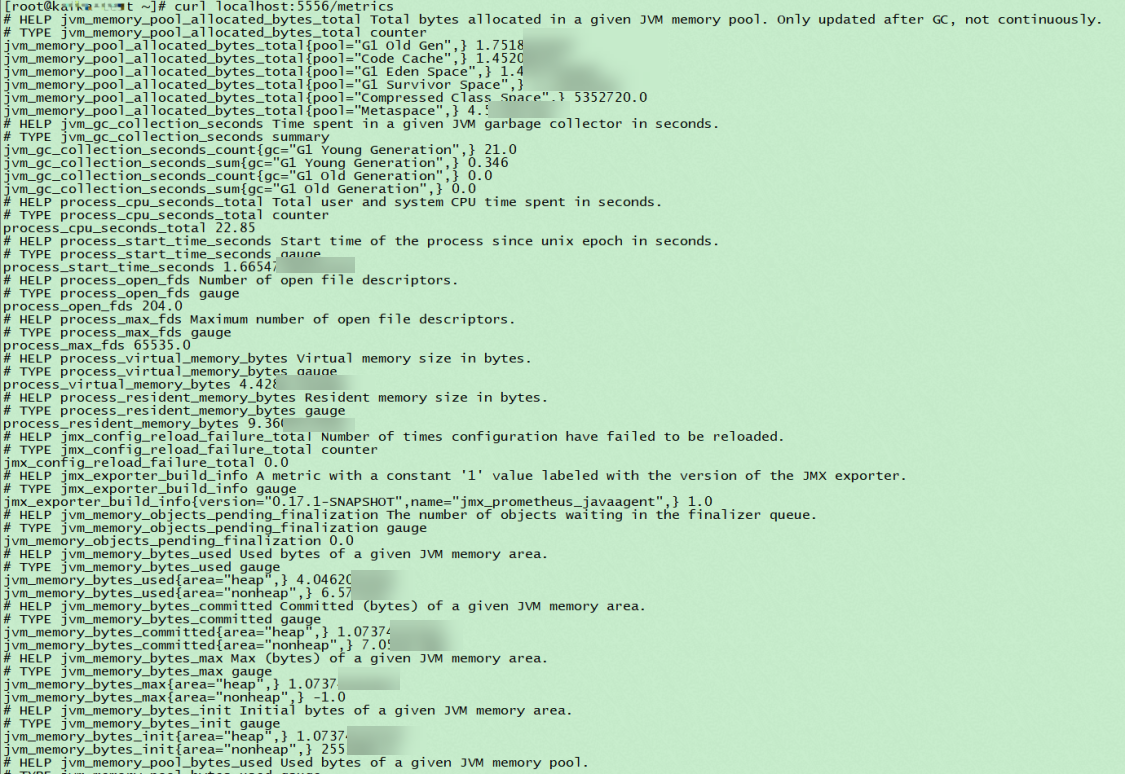
Check whether the Kafka JMX agent is running as expected on Kafka Producer, Broker, and Consumer. Run the
curl localhost:{jmx listening port}/metricscommand on each pod or ECS instance to check whether normal metric data is returned. If normal metric data is returned, the Kafka JMX agent is running as expected on Kafka Producer, Broker, and Consumer.jmx listening port: Replace the value with the actual JMX listening port.

(Optional) Step 2: Configure the container port number
If you deploy a Kafka JMX agent in a Prometheus instance for Container Service, you also need to configure the container port number. This way, Managed Service for Prometheus can capture the data of the Kafka JMX agent. If you deploy a Kafka JMX agent in a Prometheus instance for ECS, skip this step.
Log on to the ACK console. In the left-side navigation pane, click Clusters.
On the Clusters page, find the cluster that you want to manage and click its name. In the left-side pane, choose .
In the Actions column of the deployment that you want to manage, click Edit.
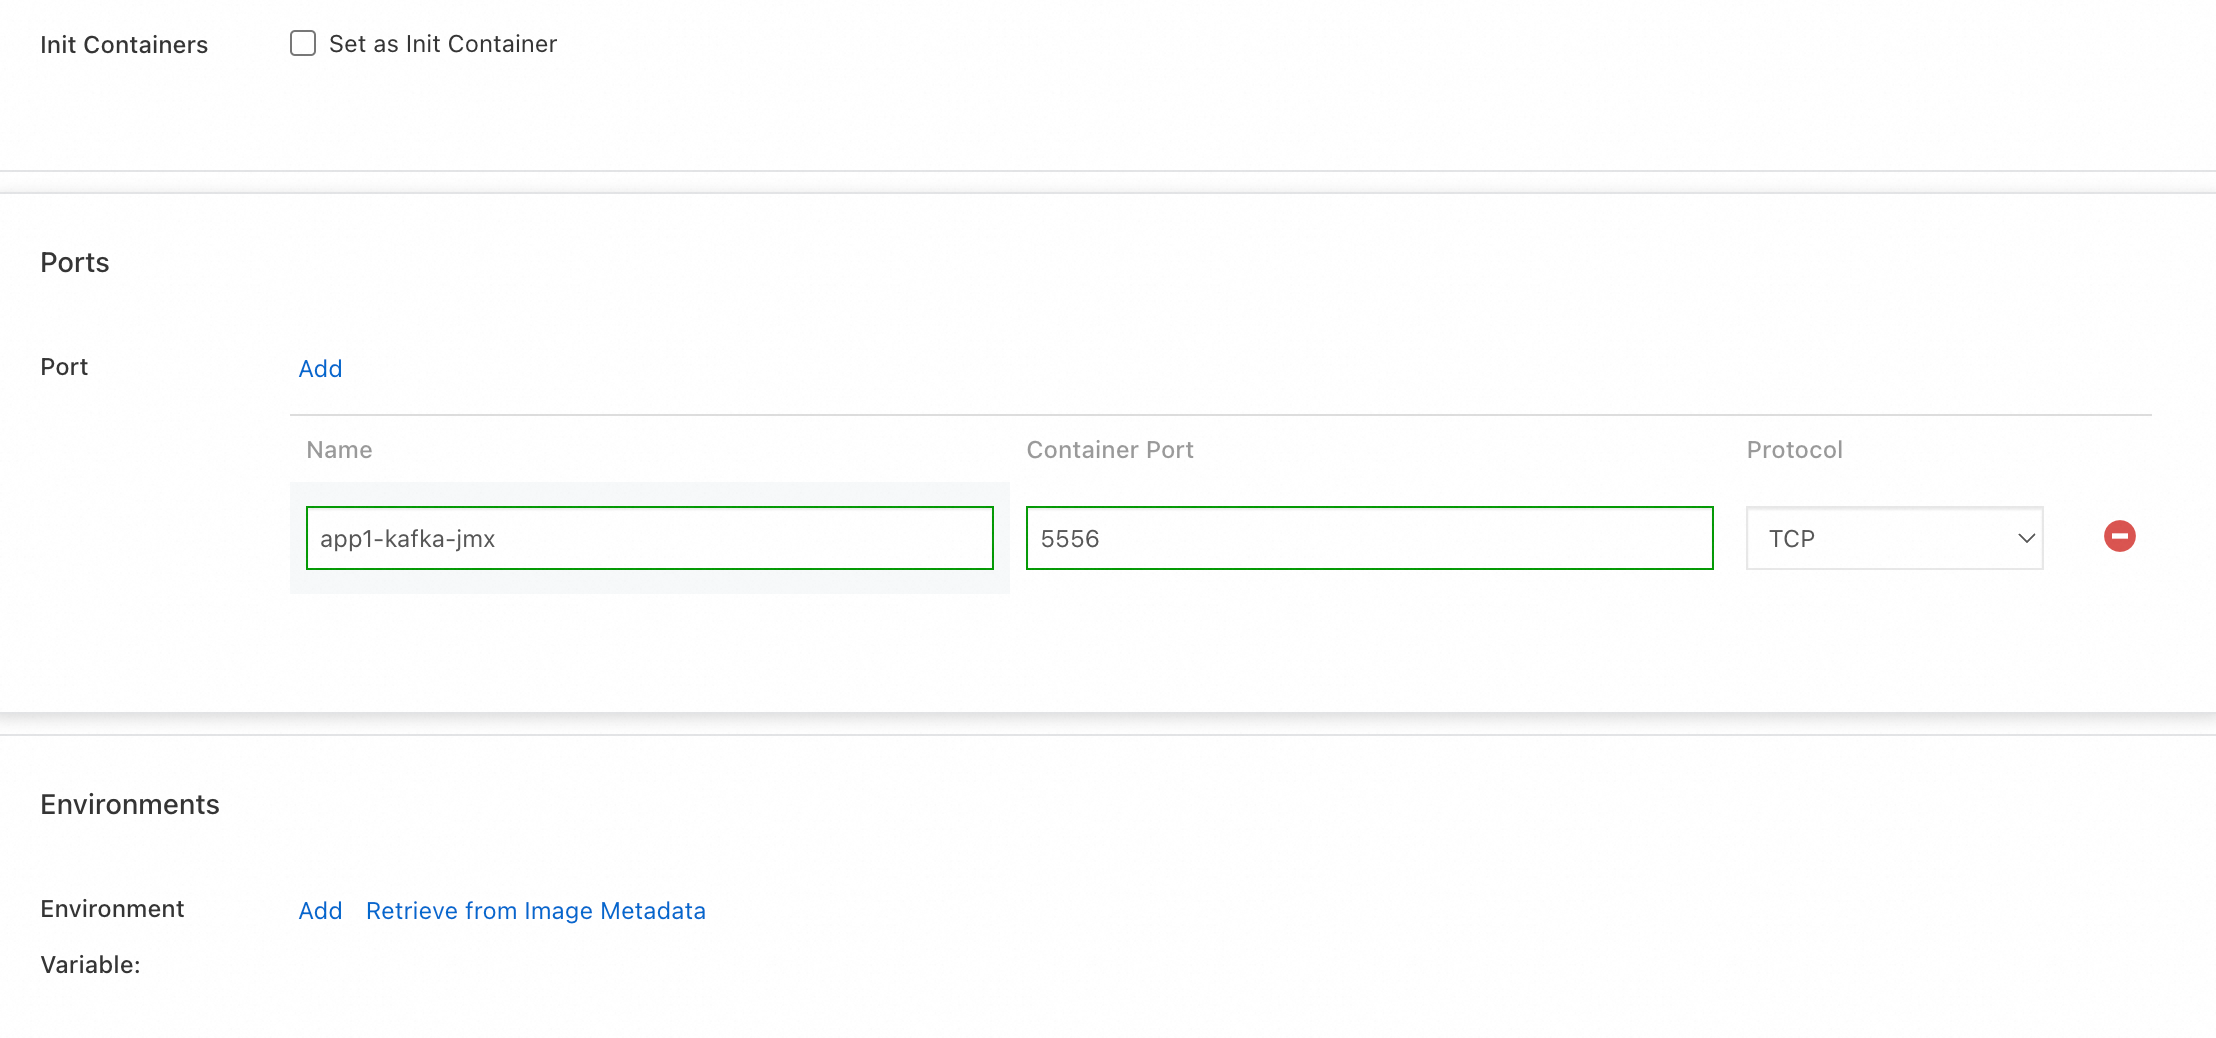
In the panel that appears, set Name, Container Port, and Protocol.

Name: The port name of the Kafka JMX agent. Example: app1-kafka-jmx.
Container Port: The JMX listening port defined in Step 1: Deploy a Kafka JMX agent.
Protocol: Select TCP.
Step 3: Attach tags to Kafka pods or ECS instances
Managed Service for Prometheus can use tags to identify pods or ECS instances to implement service discovery. Therefore, you need to attach tags to Kafka pods or ECS instances. If you have attached tags to Kafka pods or ECS instances, you can skip this step.
Configure a tag for a Prometheus instance for Container Service
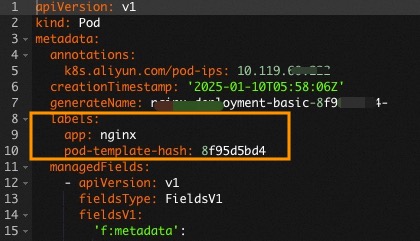
Configure a tag in the format of {custom tag key}:{ custom tag value} for the pods of Kafka Producer, Broker, and Consumer. Example: arms-kafka-exporter:my-kafka1. Perform the following steps to configure the tag:
Log on to the ACK console. In the left-side navigation pane, click Clusters.
On the Clusters page, find the cluster that you want to manage and click its name. In the left-side pane, choose .
On the Pods page, click Edit in the Actions column of the pod that you want to manage.
On the page that appears, add labels and click Update.

Configure a tag for a Prometheus instance for ECS
Configure a tag in the format of {Custom tag key}:{ Custom tag value} for the ECS instances of Kafka Producers, Brokers, and Consumers. Example: arms-kafka-exporter:my-kafka1. For more information about how to create tags for ECS instances, see Tags.
What to do next
After the Kafka JMX agent is configured, you can configure the agent to view monitoring data in the Managed Service for Prometheus console. For more information, see Use Managed Service for Prometheus to monitor self-managed Kafka clusters and ApsaraMQ for Kafka instances.