Configure monitoring alerts to track service metrics and receive notifications when alert conditions are met.
Background information
EAS supports monitoring alerts for the following metrics:
|
Metrics |
Description |
|
CPU consumption |
CPU cores currently consumed by the service. |
|
GPU utilization |
Ratio of current GPU usage to total deployed GPU resources. |
|
GPU memory |
GPU memory currently used by the service. |
|
Memory consumption |
Memory currently consumed by the service (MB). |
|
Total calls per second |
Service invocations per second. |
|
2xx responses per second |
2xx status code responses per second. |
|
Percentage of 2xx responses |
Percentage of 2xx status code responses. |
|
4xx responses per second |
4xx status code responses per second. |
|
Percentage of 4xx responses |
Percentage of 4xx status code responses. |
|
5xx responses per second |
5xx status code responses per second. |
|
Percentage of 5xx responses |
Percentage of 5xx status code responses. |
|
TP5 response time |
Response time at the 95th percentile. |
|
TP80 response time |
Maximum response time of the fastest 80% of requests. |
|
TP90 response time |
Maximum response time of the fastest 90% of requests. |
|
TP95 response time |
Maximum response time of the fastest 95% of requests. |
|
TP99 response time |
99th percentile response time. |
|
TP100 response time |
Maximum response time of all requests. |
|
Inbound traffic |
Data entering the service per second (KB). |
|
Outbound traffic |
Data leaving the service per second (KB). |
Step 1: Configure alert contacts
-
Create an alert contact.
-
Log on to the Cloud Monitor console.
In the navigation pane on the left, choose .
-
On the Alert Contacts tab, click Create Contact.
-
In the Set Alert Contact panel, enter the contact's name, mobile phone number, email address, DingTalk chatbot, and Lark chatbot.
-
Select a language for Alert Notification Language and complete the verification by dragging the slider.
The following options are available:
-
Auto: Automatically sets the alert notification language based on the language of the website that you used to register your account. The language is Chinese for the Alibaba Cloud China Website (www.aliyun.com) and English for the Alibaba Cloud International Website (www.alibabacloud.com) and the Japan website.
-
Chinese
-
English
-
-
Click Confirm.
-
-
Create an alert contact group.
In the navigation pane on the left, choose .
Click the Alert Contact Groups tab.
On the Alert Contact Groups tab, click Create Contact Group.
In the Create Contact Group panel, enter a name for the group and select existing alert contacts.
Click Confirm.
Step 2: Configure alert rules
-
In the navigation pane on the left of the Cloud Monitor console, click .
-
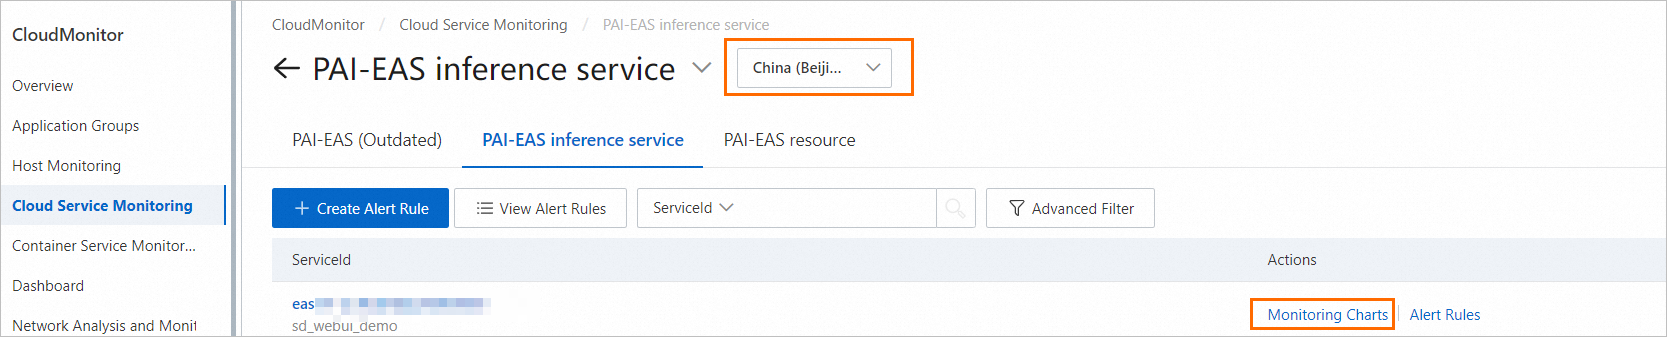
On the Cloud Service Monitoring page, in the search box, search for PAI-EAS Online Prediction Service and click PAI-EAS Online Prediction Service.
-
On the PAI-EAS Online Prediction Service page, select the region where the service is located. Then, in the Actions column for the service, click Monitoring Charts.
-
Click Create Alert Rule.
-
In the Create Alert Rule panel, configure the following parameters and click Confirm.
Parameter
Description
Product
The product managed by Cloud Monitor. Select PAI-EAS Online Prediction Service.
Resource Scope
Scope of the alert rule:
-
All Resources: An alert notification is sent if any EAS service meets the alert rule.
-
Instances: Alerts triggered only when selected service instances meet the rule.
Rule Description
Alert rule conditions. The rule triggers when monitoring data meets specified criteria. Configuration steps:
-
Click Add Rule.
-
In the Add Rule Description panel, configure the rule name, metric type, metric, threshold, alert level, and notification method.
-
Click OK.
Mute Period
Interval for resending alert notifications if the alert remains unresolved.
Effective Time
Time period when the alert rule is active. Monitoring data is checked only during this period.
Alert Contact Group
Contact group that receives alert notifications. Select a group with configured contacts.
Alert Callback
Public URL accessible via HTTP. Cloud Monitor sends alert information to this URL using POST requests.
Auto Scaling
The alert rules for PAI-EAS online prediction services are not adapted for the Auto Scaling feature. You do not need to enable this switch.
Simple Log Service
When enabled, alert information is written to Simple Log Service. Configure the Region, ProjectName, and Logstore.
For information about how to create a ProjectName and Logstore, see Collect and analyze ECS text logs using LoongCollector.
Simple Message Queue (formerly MNS)
If you enable this switch, alert information is written to a topic in Simple Message Queue (formerly MNS) when an alert occurs. You must set the region and topic for Simple Message Queue (formerly MNS). For information about how to create a topic, see Create a topic.
No-Data Handling
Action when no monitoring data is available:
-
Do not process (Default)
-
Send no-data alert
-
Treat as normal
-