After you use Zipkin to instrument an application and report the trace data of the application to Managed Service for OpenTelemetry, Managed Service for OpenTelemetry starts to monitor the application. You can view the monitoring data of the application, such as application topology, traces, abnormal transactions, slow transactions, and SQL analysis. This topic describes how to use Zipkin to instrument a Go application and report the trace data of the application.
To unlock richer features, advanced tracing capabilities, and an optimal user experience, we recommend that you connect your application to Managed Service for OpenTelemetry by using the OpenTelemetry protocol. Alibaba Cloud provides detailed instructions on how to integrate OpenTelemetry with an application and the best practices for using OpenTelemetry to help you get started with Managed Service for OpenTelemetry. For more information, see Preparations.
ARMS provides a commercially supported, self-developed agent for Go applications. This agent enables non-intrusive instrumentation and provides richer feature set and enhanced stability. For more information, see Monitor Go applications.
Prerequisites
Log on to the Managed Service for OpenTelemetry console.
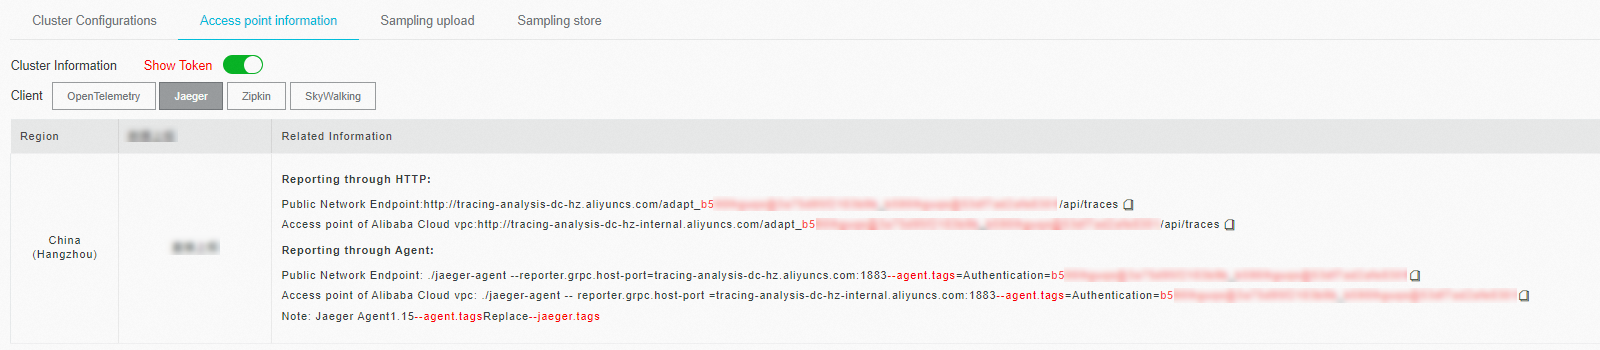
In the left-side navigation pane, click Cluster Configurations. On the page that appears, click the Access point information tab.
In the top navigation bar, select a region. In the Cluster Information section, turn on Show Token.
Set the Client parameter to Jaeger or Zipkin. In this example, Jaeger is selected.
Obtain the endpoint of Jaeger or Zipkin in the Related Information column of the table in the lower part.
 Note
NoteIf your application is deployed in an Alibaba Cloud production environment, use the VPC endpoint. Otherwise, use the public endpoint. Generally, use the endpoint of v2 for Zipkin. Use the endpoint of v1 only if you know Zipkin well.
Background information
Zipkin is an open source distributed tracing system that is developed by Twitter to trace real-time data. Zipkin aggregates real-time monitoring data that is collected from multiple heterogeneous systems.

Instrument the application
Before you use Zipkin to report the trace data of a Go application to the Managed Service for OpenTelemetry console, you must instrument the application.
Add dependencies.
[[constraint]]
  name = "github.com/openzipkin/zipkin-go"
  version = "0.1.1"

[[constraint]]
  name = "github.com/gorilla/mux"
  version = "1.6.2"
Create a tracer. You can use tracers to create spans that record the time of distributed operations. Tracers contain information such as the endpoint from which data is reported, the IP address of the on-premises machine, and the sampling rate. You can adjust the sampling rate to reduce the cost of reporting data.
func getTracer(serviceName string, ip string) *zipkin.Tracer {
  // Create a reporter to be used by the tracer.
  reporter := httpreporter.NewReporter("http://tracing-analysis-dc-hz.aliyuncs.com/adapt_aokcdqnxyz@123456ff_abcdef123@abcdef123/api/v2/spans")
  // Configure the local endpoint for the service.
  endpoint, _ := zipkin.NewEndpoint(serviceName, ip)
  // Configure the sampling strategy.
  sampler := zipkin.NewModuloSampler(1)
  // Initialize the tracer.
  tracer, _ := zipkin.NewTracer(
    reporter,
    zipkin.WithLocalEndpoint(endpoint),
    zipkin.WithSampler(sampler),
  )
  return tracer;
}
Record the request data.
// The tracer can now be used to create spans. span := tracer.StartSpan("some_operation") // ... do some work ... span.Finish()NoteYou can run the preceding code to create a root span that records the root operation of a request. If you want to record the previous and next operations of a request, specify the context information. Example:
childSpan := tracer.StartSpan("some_operation2", zipkin.Parent(span.Context()))
    // ... do some work ...
childSpan.Finish()
Optional. To facilitate troubleshooting, you can add custom tags to a span. For example, you can check whether an error occurs, record the return value of a request, or configure the error message.
Add a custom tag:
childSpan.Tag("http.status_code", statusCode)Create a custom error message:
childSpan := tracer.StartSpan("some_operation2", zipkin.Parent(span.Context()))
// ... do some work ...
var events = make(map[string]string)
events["event"] = "error"
events["stack"] = "Runtime Exception: unable to find userid"
jsonStr, err := json.Marshal(events)
if err == nil {
   childSpan.Annotate(time.Now(), string(jsonStr))
}
childSpan.Finish()
In a distributed system, remote procedure call (RPC) requests are sent together with trace data. Trace data contains the values of the TraceId, ParentSpanId, SpanId, and Sampled parameters. You can call the Extract or Inject method to pass through trace data in HTTP request headers. The following figure shows the entire process.
 Note
NoteZipkin allows you to pass through context information over HTTP or Google Remote Procedure Call (gRPC).
Call the Inject method on the client to specify the context information.
req, _ := http.NewRequest("GET", "/", nil)
// configure a function that injects a trace context into a request
injector := b3.InjectHTTP(req)
injector(sp.Context())
Call the Extract method on the server to extract the context information.
req, _ := http.NewRequest("GET", "/", nil)
        b3.InjectHTTP(req)(sp.Context())

        b.ResetTimer()
        _ = b3.ExtractHTTP(copyRequest(req))
Getting started with Zipkin
The following example shows how to use Zipkin to report the trace data of a Go application.
Download the Demo file.
Modify the endpoint for data reporting in the utils.go file.
NoteReplace
<endpoint>with the endpoint of the region in which your client resides. You can log on to the Managed Service for OpenTelemetry console and view the endpoint on the Access point information tab of the page. For more information about how to obtain the endpoint, see the "Prerequisites" section of this topic.Install the required dependency.
dep ensureRun the test application.
go run main.goOn the Applications page of the Managed Service for OpenTelemetry console, click the name of the application. On the page that appears, view the trace data.
FAQ
Q: Why is no data reported after I perform the preceding steps?
A: You can check the error message that is returned when the application is running and check whether the value of the endpoint_url parameter is valid. For example, if the failed the request with status code 403 message is returned, the username or password is invalid.