The APISIX OpenTelemetry plug-in collects trace data of APISIX and reports the trace data to the OpenTelemetry Collector. Then, the OpenTelemetry Collector forwards the trace data to Managed Service for OpenTelemetry. The APISIX OpenTelemetry plug-in reports trace data to the OpenTelemetry Collector only over HTTP. Reporting trace data over Google Remote Procedure Call (gRPC) is not supported.
Prerequisites
APISIX 2.13.0 or later is used.
An endpoint is obtained.
Overview

To use OpenTelemetry to report trace data of APISIX, perform the following steps:
Deploy the OpenTelemetry Collector. The OpenTelemetry Collector is an open source collector that receives, processes, and exports observability data, such as traces, from various data sources.
Enable the OpenTelemetry plug-in in APISIX. You can enable the OpenTelemetry plug-in by modifying the configuration file of APISIX to allow the OpenTelemetry Collector to collect observability data of APISIX.
Specify the effective scope of the OpenTelemetry plug-in. You can use the APISIX Admin API to specify the effective scope of the OpenTelemetry plug-in.
View APISIX traces. You can view the APISIX traces generated by the OpenTelemetry plug-in in the Managed Service for OpenTelemetry console.
Process
1. Deploy the OpenTelemetry Collector
Method 1: Installation in the ACK console
Log on to the ACK console. In the left-side navigation pane, choose .
On the page that appears, find and click
opentelemetry-collector. In the panel that appears, click Deploy in the upper-right corner.In the Deploy panel, select the target cluster and click Next.
In the Parameters step, add the following parameters and click OK.
NoteReplace
${HTTP Endpoint}with the HTTP endpoint you retrieved in Prerequisites, such ashttp://tracing-analysis-dc-hz.aliyuncs.com/adapt_xxxxx/api/otlp/traces.receivers: otlp: protocols: grpc: endpoint: 0.0.0.0:4317 http: cors: allowed_origins: - http://* - https://* endpoint: 0.0.0.0:4318 # OTLP HTTP Receiver processors: batch: exporters: otlphttp: traces_endpoint: '${HTTP Endpoint}' tls: insecure: true service: pipelines: traces: receivers: [otlp] processors: [batch] exporters: [otlphttp]Example:

Method 2: Manual installation
The following example shows how to deploy the OpenTelemetry Collector by using Docker. For more information, see Install the Collector.
Create a file named
opentelemetry-config.yamland copy the following content to the file.This file is used to define and configure the behavior and features of the OpenTelemetry Collector, including how to receive, process, and export data.
NoteReplace
${HTTP Endpoint}in the file with the HTTP endpoint that you obtained in the Prerequisites section of this topic. Example:http://tracing-analysis-dc-hz.aliyuncs.com/adapt_xxxxx/api/otlp/traces.receivers: otlp: protocols: grpc: endpoint: 0.0.0.0:4317 http: cors: allowed_origins: - http://* - https://* endpoint: 0.0.0.0:4318 # OTLP HTTP Receiver processors: batch: exporters: otlphttp: traces_endpoint: '${HTTP Endpoint}' tls: insecure: true service: pipelines: traces: receivers: [otlp] processors: [batch] exporters: [otlphttp]Start the OpenTelemetry Collector.
docker run -v $(pwd)/opentelemetry-config.yaml:/etc/otelcol-contrib/config.yaml otel/opentelemetry-collector-contrib:0.105.0
2. Enable the OpenTelemetry plug-in in APISIX
APISIX V3.12 and later
In the
config.yamlfile of APISIX, enable theOpenTelemetryplug-in.... plugins: ... # Other enabled plug-ins. - opentelemetry # Enable the OpenTelemetry plug-in.Set parameters for the plug-in.
NoteReplace the following variables in your configuration:
${Service Name}with your application name (e.g.,APISIX), which will be displayed on the Applications page of the Managed Service for OpenTelemetry console.${Host IP}with the host IP address, which will be displayed in the Span Details section on the right of the Trace details page in Step 4.${OpenTelemetry Collector Address}with the OpenTelemetry Collector’s IP address (e.g.,127.0.0.1).${admin_key}with the authentication key for the APISIX Admin API.
For more information about how to configure the OpenTelemetry plug-in, see the "Configuring the collector" section of the opentelemetry topic.
curl http://127.0.0.1:9180/apisix/admin/plugin_metadata/opentelemetry -H "X-API-KEY: ${admin_key}" -X PUT -d ' { "trace_id_source": "x-request-id", "resource": { "service.name": "${Service Name}", "host.ip":"${Host IP}" }, "collector": { "address": "${OpenTelemetry Collector Address}:4318", "request_timeout": 3, "batch_span_processor": { "drop_on_queue_full": false, "max_queue_size": 1024, "batch_timeout": 2, "inactive_timeout": 1, "max_export_batch_size": 16 }, "set_ngx_var": false } }'
APISIX earlier than V3.12
Enable the OpenTelemetry plug-in and modify the configurations of the OpenTelemetry Collector in the config.yaml file of APISIX.
Replace the following variables in your configuration:
${Service Name}with your application name (e.g.,APISIX), which will be displayed on the Applications page of the Managed Service for OpenTelemetry console.${Host IP}with the host IP address, which will be displayed in the Span Details section on the right of the Trace details page in Step 4.${OpenTelemetry Collector Address}with the IP address of the OpenTelemetry Collector (e.g.,127.0.0.1).
For more information about how to configure the OpenTelemetry plug-in, see the "Configuring the collector" section of the opentelemetry topic.
...
plugins:
  ... # Other enabled plug-ins.
  - opentelemetry # Enable the OpenTelemetry plug-in.
plugin_attr:
...
opentelemetry: # The configurations of the OpenTelemetry plug-in.
resource:
service.name: ${Service Name} # The application name.
host.ip: ${Host IP} # The host IP address.
collector:
address: ${OpenTelemetry Collector Address}:4318 # The endpoint of the OpenTelemetry Protocol (OTLP) HTTP receiver of the OpenTelemetry Collector.
request_timeout: 3
batch_span_processor: # The configurations for processing data in batches.
drop_on_queue_full: false
max_queue_size: 6
batch_timeout: 2
inactive_timeout: 1
max_export_batch_size: 23. Specify the effective scope of the APISIX OpenTelemetry plug-in
Configure the OpenTelemetry plug-in to take effect globally.
NoteIf the
samplerparameter is set toalways_on, each request is tracked and a trace is generated.For more information about how to configure the attributes of OpenTelemetry, see the "Attributes" section of the opentelemetry topic.
curl 'http://127.0.0.1:9080/apisix/admin/global_rules/1' \
-H 'X-API-KEY:  edd1c9f034335f136f87ad84b625c8f1' \
-X PUT -d '{
  "plugins": {
      "opentelemetry": {
          "sampler": {
              "name": "always_on"
          }
      }
  }
}'
Configure the OpenTelemetry plug-in to take effect only for specific routes.
curl http://127.0.0.1:9080/apisix/admin/routes/1 \
-H 'X-API-KEY: edd1c9f034335f136f87ad84b625c8f1' \
-X PUT -d '
{
  "uri": "/get",
  "plugins": {
      "opentelemetry": {
          "sampler": {
              "name": "always_on"
          }
      }
  },
  "upstream": {
      "type": "roundrobin",
      "nodes": {
          "httpbin.org:80": 1
      }
  }
}'
4. View APISIX traces
After you complete the preceding configurations, you can create and access a route by using APISIX. Then, you can log on to the Managed Service for OpenTelemetry console to view the APISIX traces generated by OpenTelemetry.
On the Applications page, click the name of the APISIX application.

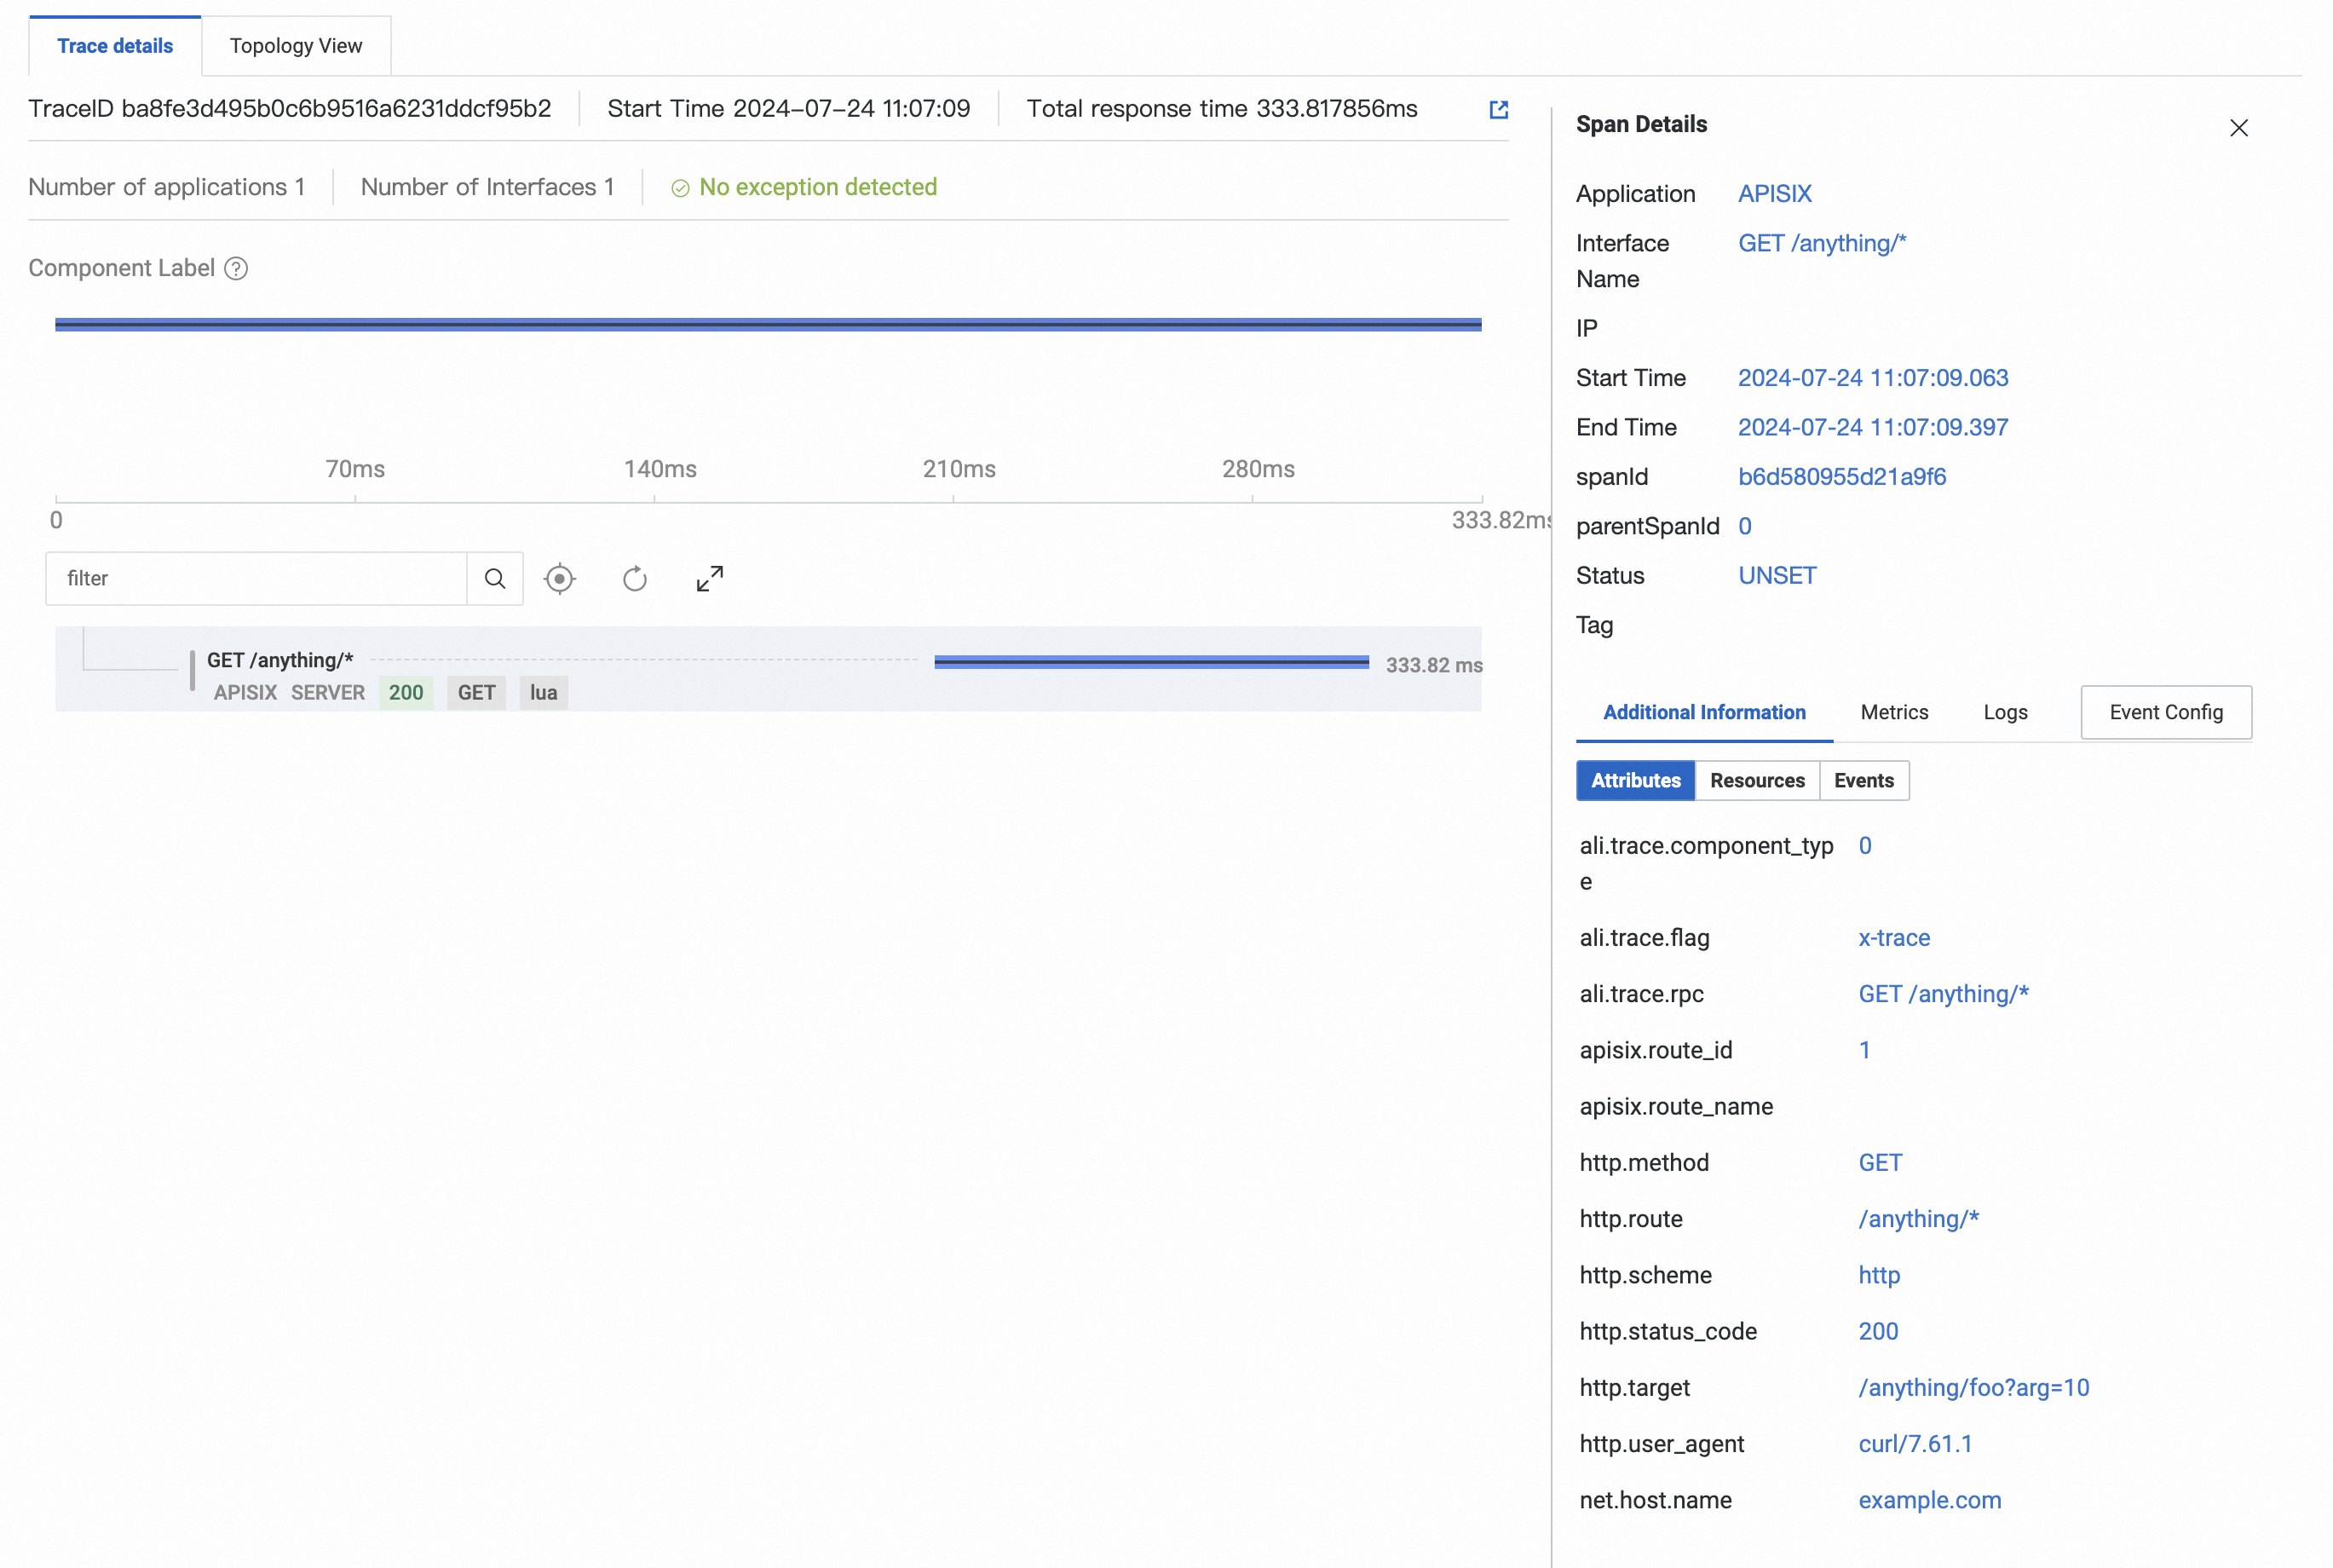
On the Trace details tab, view the APISIX trace information.

Example
Preparations
Install Git, Docker, and Docker Compose.
Make sure that APISIX 2.13.0 or later is used.
Procedure
Download a demo of Docker Compose from the official website of APISIX.
git clone https://github.com/apache/apisix-docker.git
cd apisix-docker/example
Add the OpenTelemetry Collector to the demo of Docker Compose.
Create a folder named
ot_confin theapisix-docker/examplefolder and create a file namedconfig.yaml.NoteReplace
${HTTP Endpoint}with the HTTP endpoint that you obtained in the "Prerequisites" section of this topic. Example:http://tracing-analysis-dc-hz.aliyuncs.com/adapt_xxxxx/api/otlp/traces.
receivers:
  otlp:
    protocols:
      grpc:
        endpoint: 0.0.0.0:4317
      http:
        cors:
          allowed_origins:
          - http://*
          - https://*
        endpoint: 0.0.0.0:4318
processors:
  batch:

exporters:
  otlphttp:
    traces_endpoint: '${HTTP Endpoint}'
    tls:
      insecure: true

service:
  pipelines:
    traces:
      receivers: [otlp]
      processors: [batch]
      exporters: [otlphttp]
Modify the
apisix-docker/example/docker-compose.ymlfile to add the OpenTelemetry Collector to the demo of Docker Compose.The following sample code shows the complete content of the
docker-compose.ymlfile after modification.# # Licensed to the Apache Software Foundation (ASF) under one or more # contributor license agreements. See the NOTICE file distributed with # this work for additional information regarding copyright ownership. # The ASF licenses this file to You under the Apache License, Version 2.0 # (the "License"); you may not use this file except in compliance with # the License. You may obtain a copy of the License at # # http://www.apache.org/licenses/LICENSE-2.0 # # Unless required by applicable law or agreed to in writing, software # distributed under the License is distributed on an "AS IS" BASIS, # WITHOUT WARRANTIES OR CONDITIONS OF ANY KIND, either express or implied. # See the License for the specific language governing permissions and # limitations under the License. # version: "3" services: apisix: image: apache/apisix:${APISIX_IMAGE_TAG:-3.9.0-debian} restart: always volumes: - ./apisix_conf/config.yaml:/usr/local/apisix/conf/config.yaml:ro depends_on: - etcd ##network_mode: host ports: - "9180:9180/tcp" - "9080:9080/tcp" - "9091:9091/tcp" - "9443:9443/tcp" - "9092:9092/tcp" networks: apisix: etcd: image: bitnami/etcd:3.5.11 restart: always volumes: - etcd_data:/bitnami/etcd environment: ETCD_ENABLE_V2: "true" ALLOW_NONE_AUTHENTICATION: "yes" ETCD_ADVERTISE_CLIENT_URLS: "http://etcd:2379" ETCD_LISTEN_CLIENT_URLS: "http://0.0.0.0:2379" ports: - "2379:2379/tcp" networks: apisix: web1: image: nginx:1.19.0-alpine restart: always volumes: - ./upstream/web1.conf:/etc/nginx/nginx.conf ports: - "9081:80/tcp" environment: - NGINX_PORT=80 networks: apisix: web2: image: nginx:1.19.0-alpine restart: always volumes: - ./upstream/web2.conf:/etc/nginx/nginx.conf ports: - "9082:80/tcp" environment: - NGINX_PORT=80 networks: apisix: prometheus: image: prom/prometheus:v2.25.0 restart: always volumes: - ./prometheus_conf/prometheus.yml:/etc/prometheus/prometheus.yml ports: - "9090:9090" networks: apisix: grafana: image: grafana/grafana:7.3.7 restart: always ports: - "3000:3000" volumes: - "./grafana_conf/provisioning:/etc/grafana/provisioning" - "./grafana_conf/dashboards:/var/lib/grafana/dashboards" - "./grafana_conf/config/grafana.ini:/etc/grafana/grafana.ini" networks: apisix: otel-collector: image: otel/opentelemetry-collector-contrib:0.105.0 volumes: - ./ot_conf/config.yaml:/etc/otelcol-contrib/config.yaml # Mount the configuration file of the OpenTelemetry Collector. ports: - 4317:4317 # OTLP gRPC receiver - 4318:4318 # OTLP http receiver networks: apisix: networks: apisix: driver: bridge volumes: etcd_data: driver: local
Enable the OpenTelemetry plug-in in APISIX.
Modify the
apisix-docker/example/apisix_conf/config.yamlconfiguration file of APISIX by appending the following content at the end of the file:plugins: - opentelemetry plugin_attr: prometheus: export_addr: ip: "0.0.0.0" port: 9091 opentelemetry: resource: service.name: APISIX host.ip: 127.0.0.1 collector: address: docker-apisix-otel-collector-1:4318 # OTLP HTTP Receiver address request_timeout: 3 batch_span_processor: drop_on_queue_full: false max_queue_size: 6 batch_timeout: 2 inactive_timeout: 1 max_export_batch_size: 2Start the demo of APISIX Docker Compose.
Run the following command in the
apisix-docker/exampledirectory:docker compose -p docker-apisix up -dConfigure the OpenTelemetry plug-in to take effect globally.
Use the APISIX Admin API to configure the OpenTelemetry plug-in to take effect globally.
curl 'http://127.0.0.1:9180/apisix/admin/global_rules/1' \
-H 'X-API-KEY: edd1c9f034335f136f87ad84b625c8f1' \
-X PUT -d '{
    "plugins": {
        "opentelemetry": {
            "sampler": {
                "name": "always_on"
            }
        }
    }
}'
Create an APISIX route and perform a test on reporting trace data.
Create a route by using the APISIX Admin API.
curl "http://127.0.0.1:9180/apisix/admin/routes/1" -H "X-API-KEY: edd1c9f034335f136f87ad84b625c8f1" -X PUT -d '
{
  "methods": ["GET"],
  "host": "example.com",
  "uri": "/anything/*",
  "upstream": {
    "type": "roundrobin",
    "nodes": {
      "httpbin.org:80": 1
    }
  }
}'
Run the following curl command. The APISIX OpenTelemetry plug-in generates a trace for this request and reports the trace data to Managed Service for OpenTelemetry.
curl -i -X GET "http://127.0.0.1:9080/anything/foo?arg=10" -H "Host: example.com"Expected output:
# curl -i -X GET "http://127.0.0.1:9080/anything/foo?arg=10" -H "Host: example.com"
HTTP/1.1 200 OK
Content-Type: application/json
Content-Length: 501
Connection: keep-alive
Date: Wed, 24 Jul 2024 03:26:11 GMT
Access-Control-Allow-Origin: *
Access-Control-Allow-Credentials: true
Server: APISIX/3.9.0

{
  "args": {
    "arg": "10"
  },
  "data": "",
  "files": {},
  "form": {},
  "headers": {
    "Accept": "*/*",
    "Host": "example.com",
    "Traceparent": "00-xxxxxx-xxxx-01",
    "User-Agent": "curl/7.61.1",
    "X-Amzn-Trace-Id": "Root=1-xxx-xxxx",
    "X-Forwarded-Host": "example.com"
  },
  "json": null,
  "method": "GET",
  "origin": "x.x.x.x, x.x.x.x",
  "url": "http://example.com/anything/foo?arg=10"
}
Log on to the Managed Service for OpenTelemetry console and view the APISIX trace generated by OpenTelemetry.
On the Applications page, click the name of the APISIX application.

On the Trace details tab, view the APISIX trace information.

Reference
APISIX is a cloud-native API gateway maintained by the Apache APISIX community. APISIX supports dynamic configuration, real-time response, and high performance and provides various traffic management features such as load balancing and canary release. For more information, visit the Apache APISIX official website.

