Managed Service for OpenTelemetry displays distributed traces only after your application reports trace data to the backend. This guide walks you through instrumenting a Go application with the OpenTelemetry SDK for Go and submitting trace data over gRPC or HTTP using OpenTelemetry Protocol (OTLP).
Prerequisites
To obtain an endpoint of OpenTelemetry, perform the following steps:
Log on to the Managed Service for OpenTelemetry console.
In the left-side navigation pane, click Cluster Configurations. Then, click the Access point information tab.
In the top navigation bar, select a region. In the Cluster Information section, turn on Show Token.
In the Client section, click OpenTelemetry.
Obtain an endpoint of OpenTelemetry in the Related Information column of the table in the lower part.
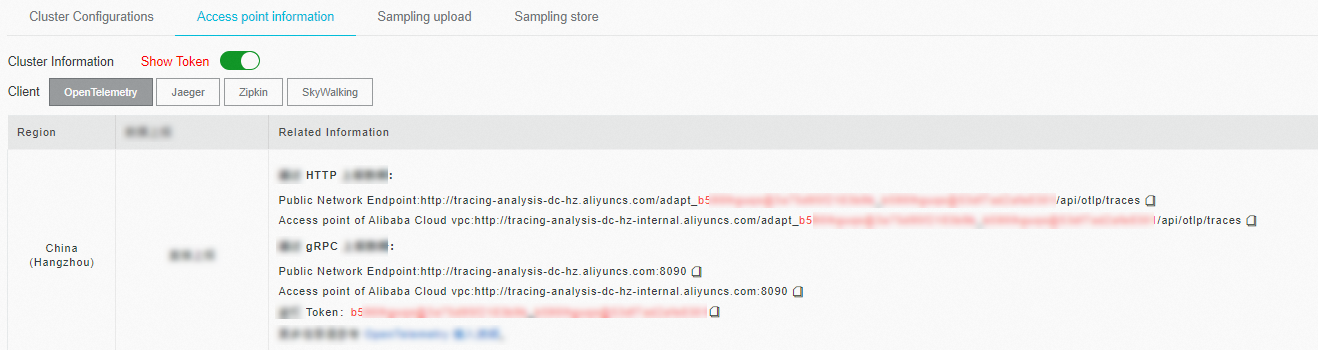
If your application is deployed in an Alibaba Cloud production environment, use a Virtual Private Cloud (VPC) endpoint. Otherwise, use a public endpoint.
gRPC vs. HTTP: choose a transport
Both gRPC and HTTP use OTLP to deliver trace data. The SDK initialization and instrumentation logic are nearly identical -- only the exporter package and client configuration differ.
| Aspect | gRPC | HTTP |
|---|---|---|
| Import package | otlptracegrpc | otlptracehttp |
| Endpoint format | host:port (single value) | Separate Endpoint (host:port) and URLPath |
| Authentication | WithHeaders map containing Authentication token | Embedded in the URL path |
| Typical use case | Low-latency, high-throughput environments | Environments where gRPC is blocked or unavailable |
Two submission paths are available for either transport:
| Path | When to use |
|---|---|
| SDK direct submission | Send trace data directly from your application to Managed Service for OpenTelemetry. Requires the endpoint and authentication token from the Prerequisites section. |
| OpenTelemetry Collector forwarding | Route trace data through a self-managed OpenTelemetry Collector. Replace the endpoint with the IP address of your on-premises service and remove the authentication headers. |
Sample code
For complete working examples, see oltp-exporter.
Submit data over gRPC
Step 1: Install dependencies
go get go.opentelemetry.io/otel \
  go.opentelemetry.io/otel/trace \
  go.opentelemetry.io/otel/sdk \
  go.opentelemetry.io/otel/exporters/otlp/otlptrace/otlptracegrpc
Step 2: Initialize the OpenTelemetry SDK
The initProvider function configures the OTLP gRPC exporter, sets up resource attributes, and registers a global TracerProvider.
Replace otelAgentAddr and xtraceToken with the endpoint and authentication token from the Prerequisites section.
If you forward data through an OpenTelemetry Collector, replace otelAgentAddr with the IP address of your on-premises service and remove the headers map.
func initProvider() func() {
    ctx := context.Background()

    otelAgentAddr, xtraceToken, ok := common.ObtainXTraceInfo()

    if !ok {
        log.Fatalf("Cannot init OpenTelemetry, exit")
        os.Exit(-1)
    }

    // Set the authentication header for Managed Service for OpenTelemetry.
    headers := map[string]string{"Authentication": xtraceToken}
    traceClient := otlptracegrpc.NewClient(
        otlptracegrpc.WithInsecure(),
        otlptracegrpc.WithEndpoint(otelAgentAddr),
        otlptracegrpc.WithHeaders(headers),
        otlptracegrpc.WithDialOption(grpc.WithBlock()))
    log.Println("start to connect to server")
    traceExp, err := otlptrace.New(ctx, traceClient)
    handleErr(err, "Failed to create the collector trace exporter")

    res, err := resource.New(ctx,
        resource.WithFromEnv(),
        resource.WithProcess(),
        resource.WithTelemetrySDK(),
        resource.WithHost(),
        resource.WithAttributes(
            // Set the service name displayed in the Managed Service for OpenTelemetry console.
            semconv.ServiceNameKey.String(common.ServerServiceName),
            semconv.HostNameKey.String(common.ServerServiceHostName),
        ),
    )
    handleErr(err, "failed to create resource")

    bsp := sdktrace.NewBatchSpanProcessor(traceExp)
    tracerProvider := sdktrace.NewTracerProvider(
        sdktrace.WithSampler(sdktrace.AlwaysSample()),
        sdktrace.WithResource(res),
        sdktrace.WithSpanProcessor(bsp),
    )

    // Set the global propagator to tracecontext. The global propagator is not specified by default.
    otel.SetTextMapPropagator(propagation.TraceContext{})
    otel.SetTracerProvider(tracerProvider)

    return func() {
        cxt, cancel := context.WithTimeout(ctx, time.Second)
        defer cancel()
        if err := traceExp.Shutdown(cxt); err != nil {
            otel.Handle(err)
        }
    }
}
Key configuration parameters:
| Parameter | Description |
|---|---|
otelAgentAddr | The gRPC endpoint obtained from the console |
xtraceToken | The authentication token obtained from the console |
Authentication | The header key required for Managed Service for OpenTelemetry authentication |
semconv.ServiceNameKey | The service name displayed in the console |
Step 3: Instrument the application
Create an HTTP handler wrapped with OpenTelemetry instrumentation. The otelhttp.NewHandler wrapper automatically creates spans for incoming HTTP requests.
shutdown := initProvider()
    defer shutdown()

    serverAttribute := attribute.String("server-attribute", "foo")
    fmt.Println("start to gen chars for trace data")
    initTraceDemoData()
    fmt.Println("gen trace data done")
    tracer := otel.Tracer(common.TraceInstrumentationName)

    // Wrap the HTTP handler with OpenTelemetry instrumentation.
    handler := http.HandlerFunc(func(w http.ResponseWriter, req *http.Request) {
        // Simulate a delay.
        var sleep int64
        switch modulus := time.Now().Unix() % 5; modulus {
        case 0:
            sleep = rng.Int63n(2000)
        case 1:
            sleep = rng.Int63n(15)
        case 2:
            sleep = rng.Int63n(917)
        case 3:
            sleep = rng.Int63n(87)
        case 4:
            sleep = rng.Int63n(1173)
        }
        ctx := req.Context()
        span := trace.SpanFromContext(ctx)
        span.SetAttributes(serverAttribute)

        actionChild(tracer, ctx, sleep)

        w.Write([]byte("Hello World"))
    })
    wrappedHandler := otelhttp.NewHandler(handler, "/hello")

    http.Handle("/hello", wrappedHandler)
    http.ListenAndServe(":7080", nil)
Step 4: Run and verify
Start the application:
go run main.goOn the Applications page of the Managed Service for OpenTelemetry console, click the name of the application. On the page that appears, view the trace data.
Submit data over HTTP
Step 1: Install dependencies
go get go.opentelemetry.io/otel \
  go.opentelemetry.io/otel/trace \
  go.opentelemetry.io/otel/sdk \
go.opentelemetry.io/otel/exporters/otlp/otlptrace/otlptracehttpThe only difference from the gRPC dependencies is otlptracehttp instead of otlptracegrpc.
Step 2: Initialize the OpenTelemetry SDK
Replace Endpoint and URLPath with the values from the endpoint obtained in the Prerequisites section.
If you forward data through an OpenTelemetry Collector, replace Endpoint with the IP address of your on-premises service and remove the authentication headers.
func initProvider() func() {
    ctx := context.Background()

    traceClientHttp := otlptracehttp.NewClient(
        otlptracehttp.WithEndpoint("127.0.XX.XX:8080"),                    // Replace with your endpoint host and port.
        otlptracehttp.WithURLPath("/adapt_xxxxx/api/otlp/traces"),         // Replace with your endpoint URL path.
        otlptracehttp.WithInsecure())
    otlptracehttp.WithCompression(1)

    traceExp, err := otlptrace.New(ctx, traceClientHttp)
    handleErr(err, "Failed to create the collector trace exporter")

    res, err := resource.New(ctx,
        resource.WithFromEnv(),
        resource.WithProcess(),
        resource.WithTelemetrySDK(),
        resource.WithHost(),
        resource.WithAttributes(
            // Set the service name displayed in the Managed Service for OpenTelemetry console.
            semconv.ServiceNameKey.String(common.ClientServiceName),
            semconv.HostNameKey.String(common.ClientServiceHostName),
        ),
    )
    handleErr(err, "failed to create resource")

    bsp := sdktrace.NewBatchSpanProcessor(traceExp)
    tracerProvider := sdktrace.NewTracerProvider(
        sdktrace.WithSampler(sdktrace.AlwaysSample()),
        sdktrace.WithResource(res),
        sdktrace.WithSpanProcessor(bsp),
    )

    // Set the global propagator to tracecontext. The global propagator is not specified by default.
    otel.SetTextMapPropagator(propagation.TraceContext{})
    otel.SetTracerProvider(tracerProvider)

    log.Println("OTEL init success")

    return func() {
        cxt, cancel := context.WithTimeout(ctx, time.Second)
        defer cancel()
        if err := traceExp.Shutdown(cxt); err != nil {
            otel.Handle(err)
        }
    }
}
Step 3: Instrument the application
This example manually creates spans in a loop instead of wrapping an HTTP handler. Each iteration starts a span named ExecuteRequest, calls makeRequest, and attaches baggage members that propagate across service boundaries.
tracer := otel.Tracer(common.TraceInstrumentationName)

    method, _ := baggage.NewMember("method", "repl")
    client, _ := baggage.NewMember("client", "cli")
    bag, _ := baggage.New(method, client)

    defaultCtx := baggage.ContextWithBaggage(context.Background(), bag)
    for {
        ctx, span := tracer.Start(defaultCtx, "ExecuteRequest")
        makeRequest(ctx)
        span.End()
        time.Sleep(time.Duration(1) * time.Second)
    }
Step 4: Run and verify
Start the application:
go run main.goOn the Applications page of the Managed Service for OpenTelemetry console, click the name of the application. On the page that appears, view the trace data.
Auto-instrumentation for common frameworks
OpenTelemetry provides semi-automatic instrumentation plug-ins. You do not need to manually create a span. You only need to call the API operations provided by these plug-ins in the code. Spans can be automatically created for common frameworks. For more information about the supported frameworks, see the OpenTelemetry Registry.
What's next
OpenTelemetry Go instrumentation libraries -- automatic instrumentation for popular frameworks
OpenTelemetry SDK for Go -- SDK source code and examples
OpenTelemetry Go documentation -- advanced configuration options