Simple Log Service provides the event configuration feature that allows you to associate logs with trace IDs. If an error occurs in an application, you can use the trace ID that is written to the application logs to identify the trace and troubleshoot the error at the earliest opportunity. This topic describes how to associate application logs with trace IDs in Simple Log Service.
Prerequisites
The application is connected to Managed Service for OpenTelemetry. For more information, see Connection Description.
The logs of the application are imported to Simple Log Service, and trace IDs or span IDs are written to the logs. For more information, see Getting Started and Logger MDC auto-instrumentation.
Step 1: Extract the trace ID
If the trace ID is stored in a separate field in the logs, skip this step.
If the trace ID is contained in a field of the logs such as the content field, you need to extract the trace ID from the content field and display the trace ID in a separate field.
Log on to the Simple Log Service console.
Select the project and Logstore in which the application logs are stored.
Use a Logtail processor to extract the trace ID from the logs in regex mode and display the trace ID in a separate field.
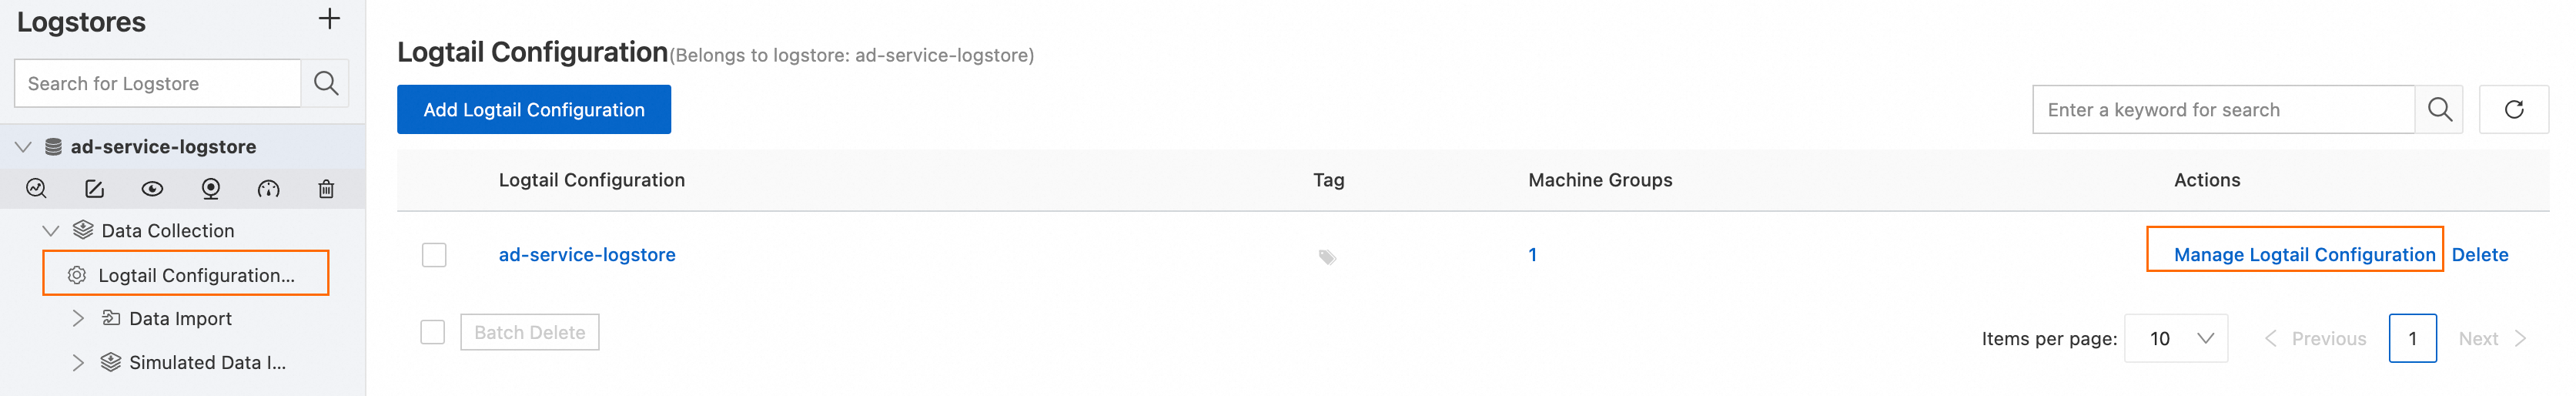
In the left-side Logstores panel, choose . On the Logtail Configuration page, find the Logtail configuration that you want to manage and click Manage Logtail Configuration in the Actions column.
Click Edit to start editing. In the Processor Configurations section on the Configuration Details tab, click Add Processor and select Extract Field (Regex Mode) from the Processor Type drop-down list.
In this example, the trace ID or span ID is contained in the content field of logs. The following sample code shows the content field of a log:
2024-05-06 12:12:49.685 [http-nio-9190-exec-3] DEBUG io.lettuce.core.protocol.DefaultEndpoint - traceId:ea1a00002d17150191696858089d0007 - [channel=0x5d069239, /10.0.0.45:49614 -> redis/192.168.216.80:6379, epid=0x1] write() doneIn the Basic Configuration section, set the Original Field parameter to content, set the Regular Expression parameter to
traceId:([a-zA-Z0-9]+), and add the trace ID or span ID to the New Field Name field. For more information, see Parsing in regex mode. After the configuration is complete, the trace ID is displayed in a separate field in the log, as shown in the following figure.
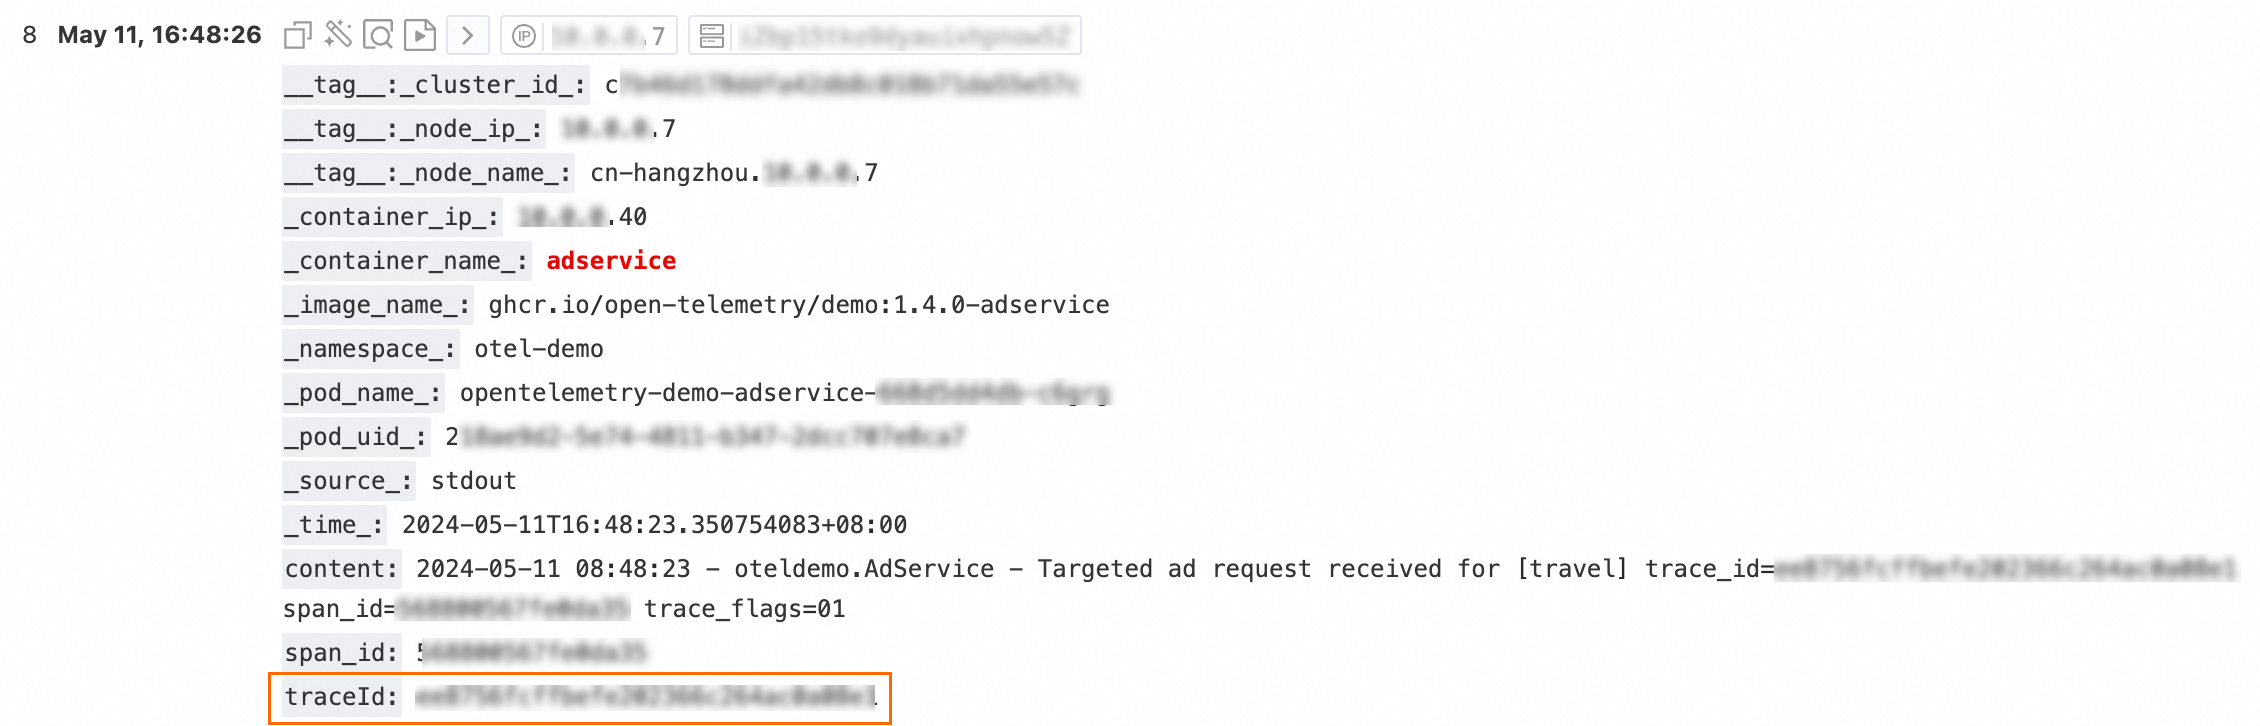
Step 2: Configure an event
Click the trace ID or span ID in a log and then click Go to configuration.
In the Advanced Event Settings dialog box, add an event for the traceId or spanId field and click OK. The following section describes the parameters of the event.
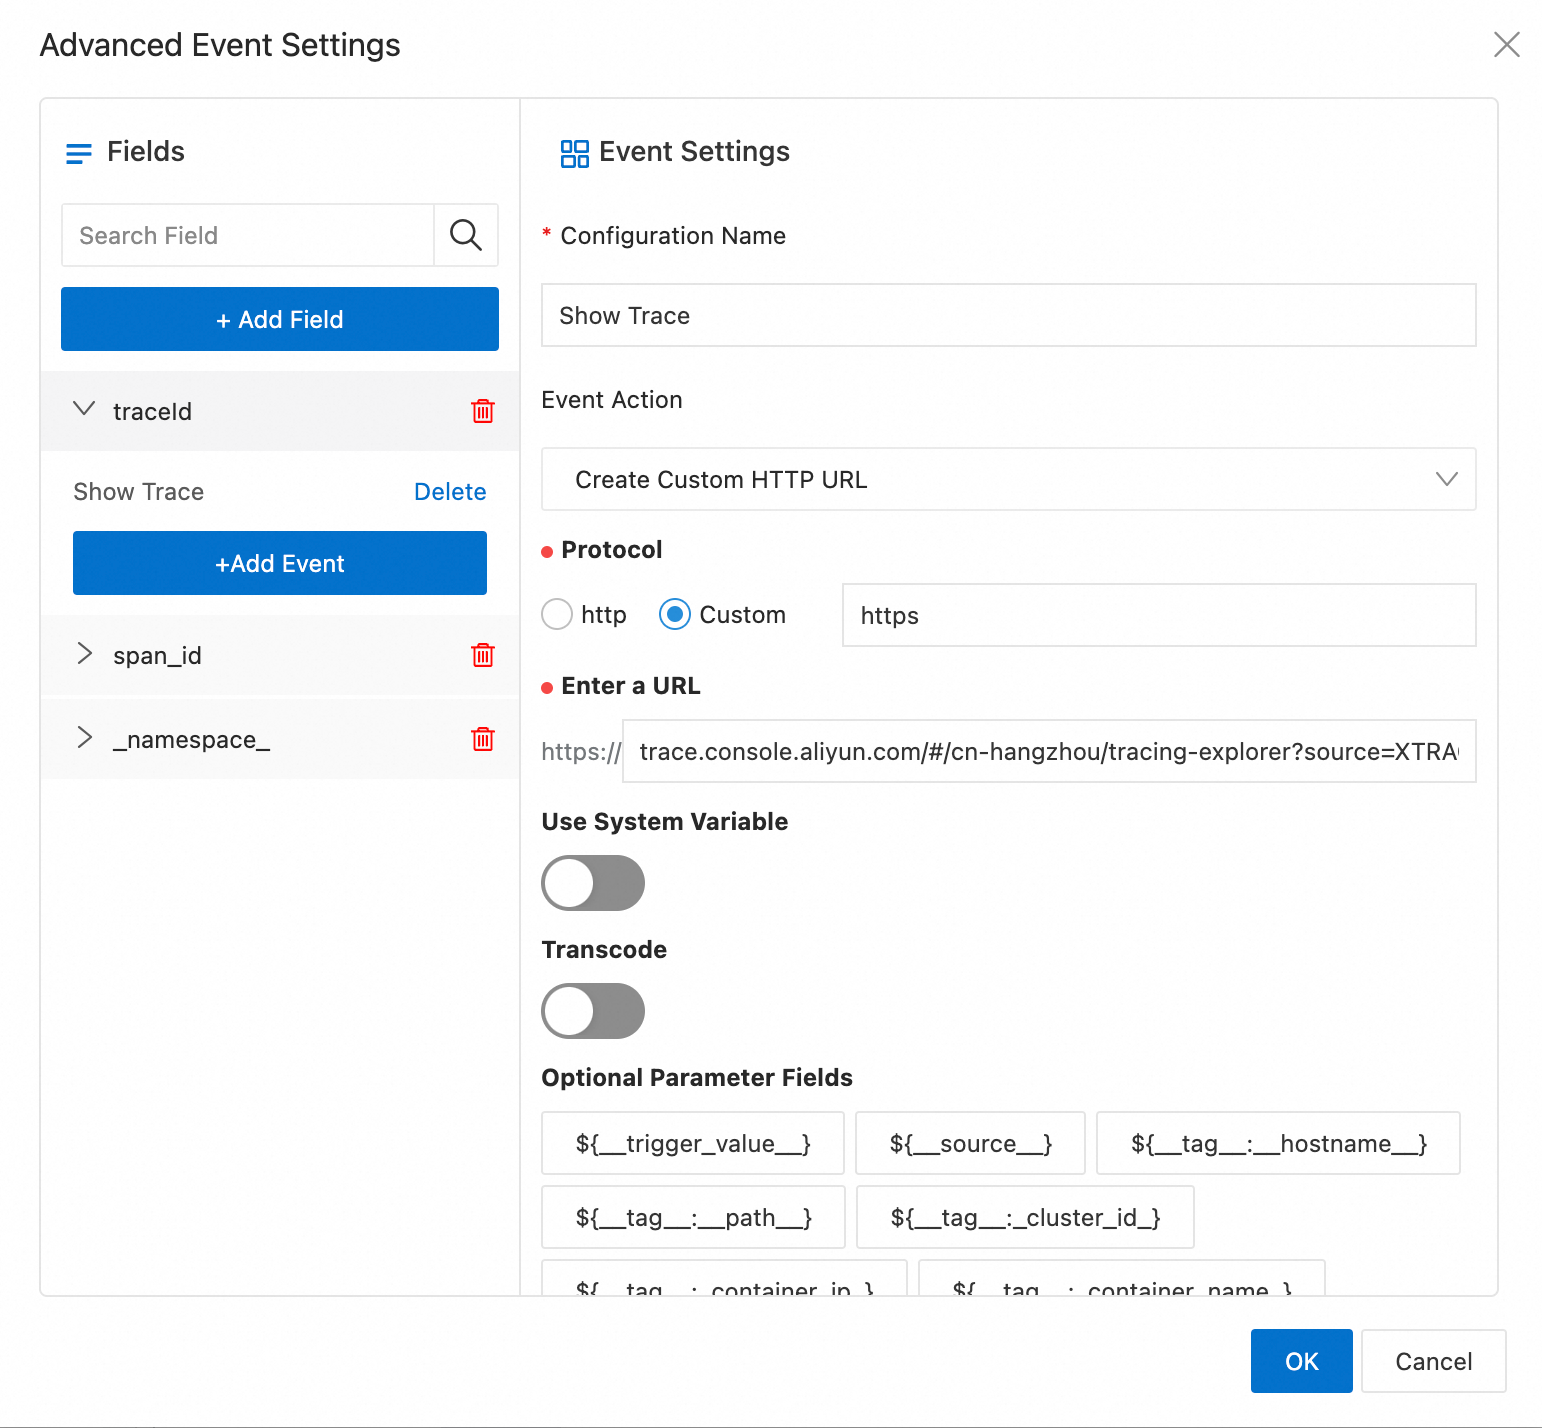
Configuration Name: You can enter a custom name. Example:
Start Trace Analysis.Event Action: Select Create Custom HTTP URL.
Protocol: Select Custom and enter
httpsin the input box.Enter a URL:
If you want to use the trace ID to filter traces, specify the URL in the format of
trace.console.aliyun.com/#/${regionId}/tracing-explorer?source=XTRACE&filters=traceId="${traceId}". You must replace${regionId}with the ID of the region in which your application is connected to Managed Service for OpenTelemetry.For example, if your application is connected to Managed Service for OpenTelemetry in the China (Hangzhou) region, replace
${regionId}withcn-hangzhou. In this case, the complete URL istrace.console.aliyun.com/#/cn-hangzhou/tracing-explorer?source=XTRACE&filters=traceId="${traceId}".If you want to use the span ID to filter traces, you must extract the span ID to display it in a separate field, and replace
${traceId}in the URL with${spanId}. If you want to use both the trace ID and span ID to filter traces, specify the following URL:trace.console.aliyun.com/#/cn-hangzhou/tracing-explorer?source=XTRACE&filters=traceId="${traceId}" AND spanId="${spanId}".If you want to use custom attributes including the Attributes and Resources information to filter traces, specify the URL in the following format:
trace.console.aliyun.com/#/cn-hangzhou/tracing-explorer?source=XTRACE&filters=${Name of the custom attribute in traces}="${Name of the field in logs}".For example, you want to filter traces of a namespace, the logs contain the
namespacefield, and the k8s.namespace.name attribute is added to the traces. In this case, the complete URL istrace.console.aliyun.com/#/cn-hangzhou/tracing-explorer?source=XTRACE&filters=resources.k8s.namespace.name="${namespace}".
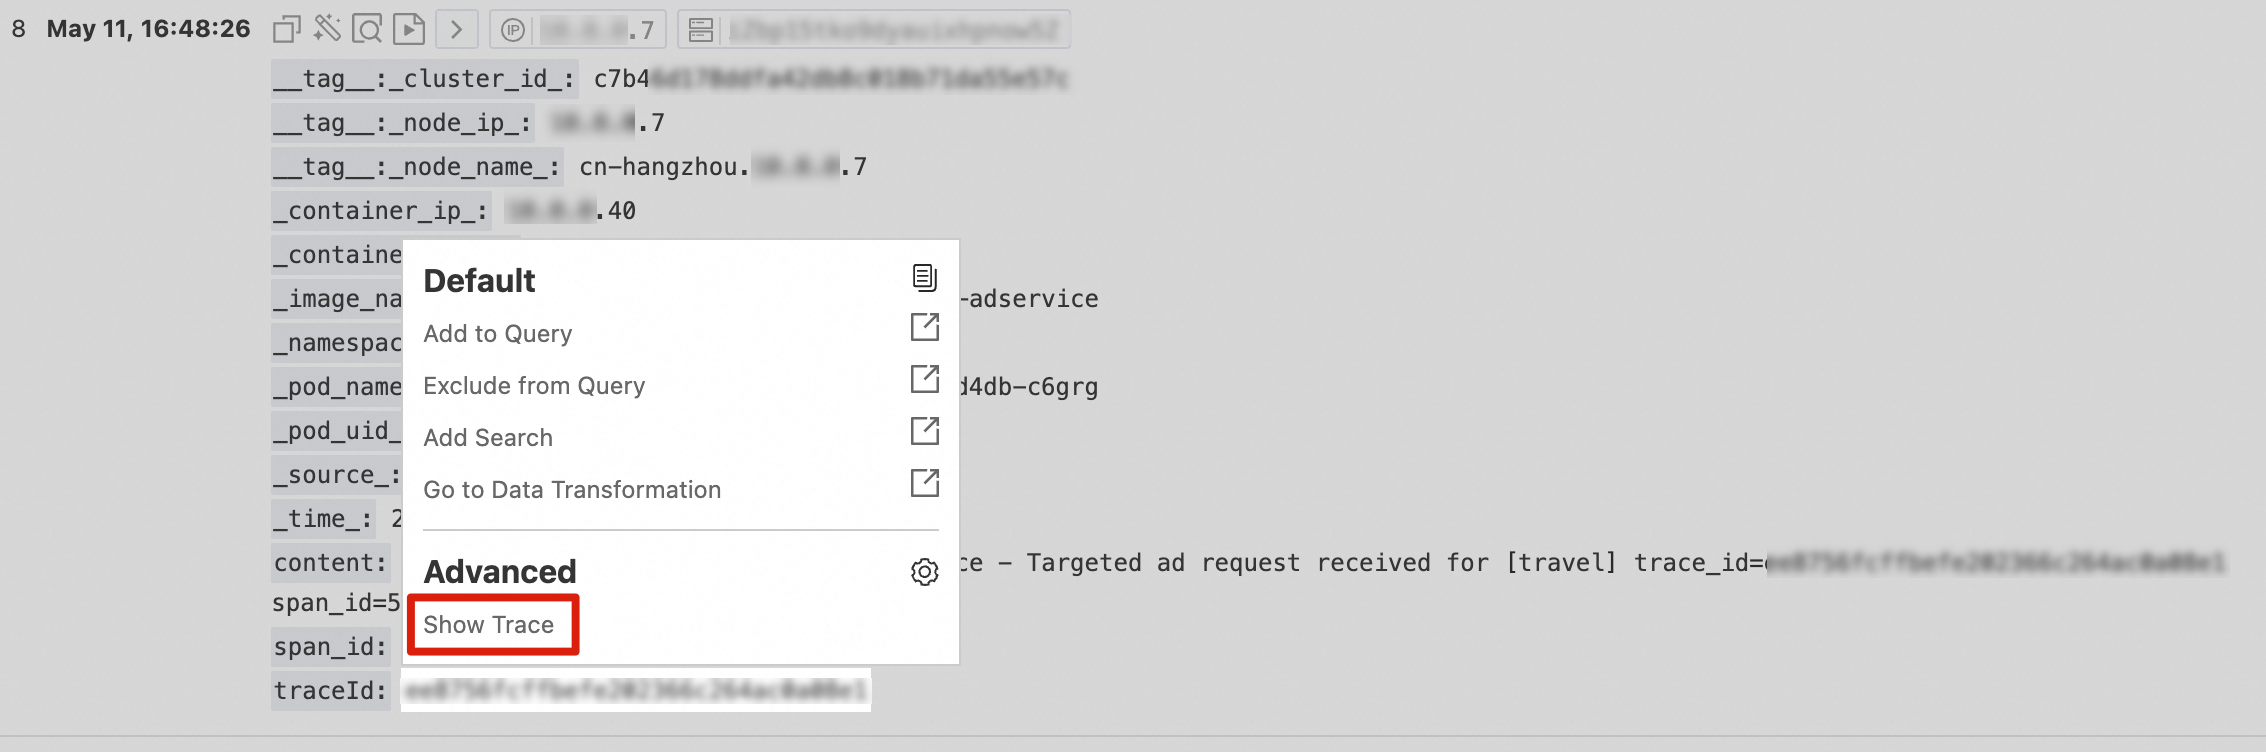
After the event is configured, click the trace ID or span ID again in the log, and click Start Trace Analysis to go to the Trace Explorer page of Managed Service for OpenTelemetry.
On the Trace Explorer page, you can query the trace based on the trace ID. For more information, see Trace Explorer.
