On the Application overview page in the Microservices Engine (MSE) console, you can view application information such as queries per second (QPS) data and top N lists. This topic describes the features of the Application overview page.
Go to the Application overview page
Log on to the MSE console, and select a region in the top navigation bar.
In the left-side navigation pane, choose Microservices Governance > Application Governance.
On the Application list page, click the resource card of the destination application.
In the left-side navigation pane, click Application overview.
Features
The Application overview page is dynamically refreshed to display application information such as Request Data, RT(ms), CPU, and Application Events.
Performance metrics: the metrics that are used to collect statistics on application data such as QPS, response time (RT), and CPU utilization. RT is in the unit of milliseconds.
NoteThe QPS and RT displayed on the Application overview page are the statistics obtained from the ingress interface of the application, excluding the statistics obtained by calling the internal methods of the application.
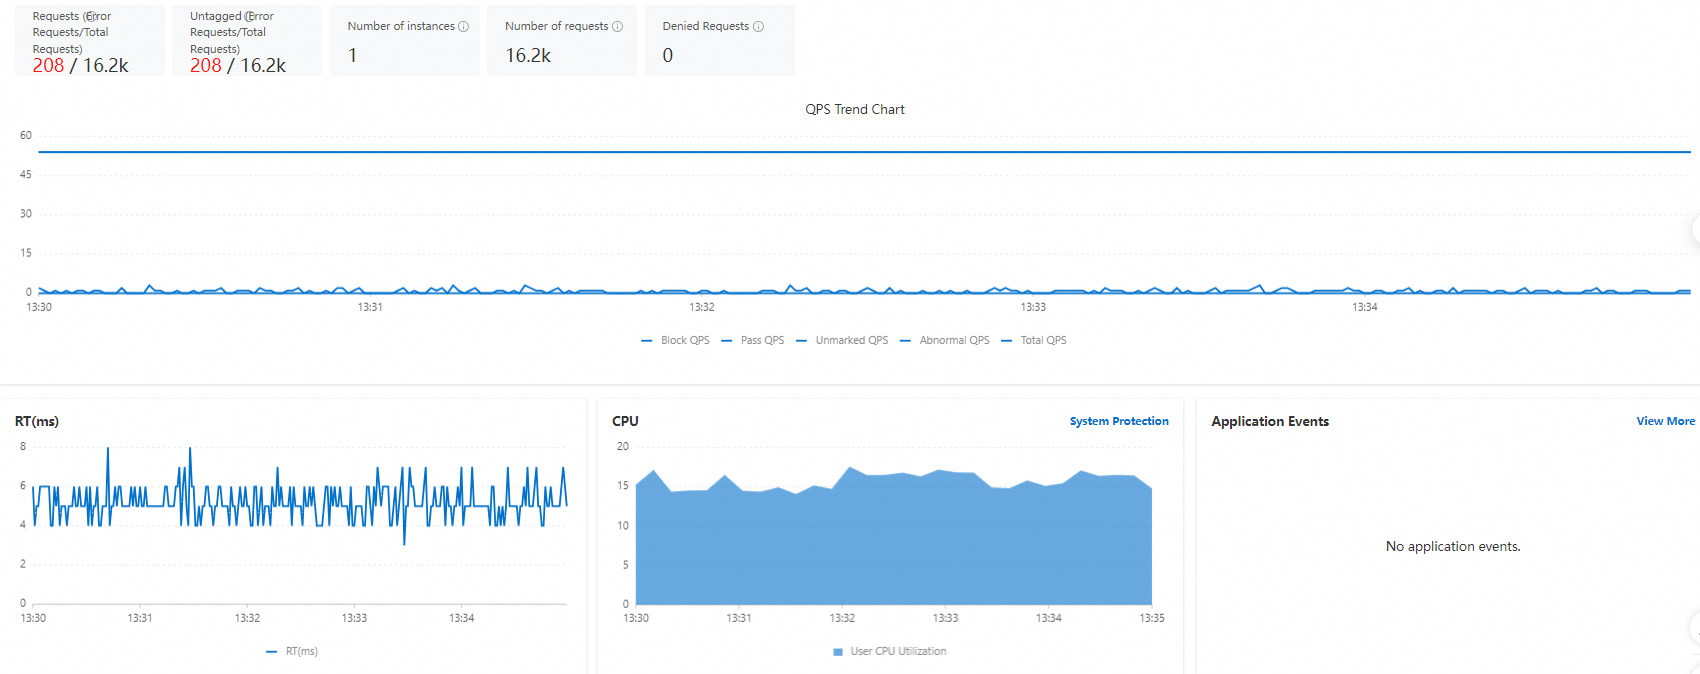
QPS Data: displays a chart that shows the trends of the number of instances with allowed requests, the number of allowed requests, and the number of denied requests in the previous 5 minutes.
Click a legend to hide or show the trend line of the associated metric.
Application Events: displays the events that are recently generated for the application.
RT(ms): displays a chart that shows the trend of RT in the previous 5 minutes. Unit: milliseconds.
CPU: displays the CPU utilization in the previous 5 minutes.
Top N lists and system resource metrics: display the top N interfaces on the Through QPS TOP, Top Block QPS for Protection, and Average RT TOP tabs.

The system dynamically refreshes top N interface lists. On the Through QPS TOP tab, interfaces are sorted based on Pass QPS. On other tabs, interfaces are sorted based on specific fields.
Click the interface name or click View All in the upper-right corner of the section. On the WEB service tab of the API Details page, you can view QPS data (in seconds), RT data (ms), Maximum Concurrency (in Seconds), and Events of all interfaces.
Find the interface that you want to manage and click Flow Control or Isolation in the Actions column to configure relevant rules for the interface.
References
For more information about the metrics involved in this topic, see the "Metrics of Microservices Governance" section in FAQ overview.